
Abstract
Background. The validity of the linear-quadratic (LQ) model at high doses has been questioned due to a decreasing agreement between predicted survival and experimental cell survival data. A frequently proposed alternative is the universal survival curve (USC) model, thought to provide a better fit in the high-dose region. The comparison between the predictions of the models has mostly been performed for uniform populations of cells with respect to sensitivity to radiation. This study aimed to compare the two models in terms of cell survival and tumour control probability (TCP) for cell populations with mixed sensitivities related to their oxygenation.
Methods. The study was performed in two parts. For the first part, cell survival curves were calculated with both models assuming various homogeneous populations of cells irradiated with uniform doses. For the second part, a realistic three-dimensional (3D) model of complex tumour oxygenation was used to study the impact of the differences in cell survival on the modelled TCP. Cellular response was assessed with the LQ and USC models at voxel level and a Poisson TCP model at tumour level.
Results. For hypoxic tumours, the disputed continuous bend of the LQ survival curve was counteracted by the increased radioresistance of the hypoxic cells and the survival curves started to diverge only at much higher doses than for oxic tumours. This was also reflected by the TCP curves for hypoxic tumours for which the difference in D50 values for the LQ and USC models was reduced from 5.4 to 0.2 Gy for 1 and 3 fractions, respectively, in a tumour with only 1.1% hypoxia and from 9.5 to 0.4 Gy in a tumour with 11.1% hypoxia.
Conclusions. For a large range of fractional doses including hypofractionated schemes, the difference in predicted survival and TCP between the LQ and USC models for tumours with heterogeneous oxygenation was found to be negligible.
Radiobiological models are useful tools in the design and evaluation of radiotherapy treatment regimens for research purposes as well as in the daily clinical practice. Iso-effect calculations in radiotherapy are used for treatment comparisons and to estimate the required alteration of a fractionation schedule due to e.g. unexpected interruptions of treatments. Such calculations have often been based on the linear-quadratic (LQ) model [Citation1] which has been well established for the moderate doses per fraction typically delivered in conventionally fractionated radiotherapy. An increasingly common treatment option for several tumour types is stereotactic body radiotherapy (SBRT), employing few fractions of high doses. There is an ongoing debate on whether the LQ model overestimates the cell kill for high doses due to the lack of agreement between the observed experimental data and the predicted survival curve [Citation2–4]. Consequently, in recent years it has been suggested that the LQ model is inappropriate to model the response in patients treated with SBRT. A frequently proposed alternative is the universal survival curve (USC) model, which is an empirical joining of the LQ model at low doses and the single-hit multi- target (SHMT) model at higher doses, causing an exponential fall-off in survival and thus providing a better fit to the experimental data on cell survival in the high-dose region [Citation5].
Comparisons between the two models have mostly been performed for populations of cells with uniform oxygenation and radiosensitivity. Thus, the performance of the models has been assessed depending on how well the predicted survival curves fit the observed experimental data in well-oxygenated cells [Citation5]. However, this is a situation seldom encountered in vivo as the poor quality of the tumour vasculature leads to most tumours being heterogeneous with respect to oxygenation and hence sensitivity [Citation6]. Indeed studies concerned with the differences in predictions for normal tissue and tumour response [Citation7,Citation8] do not include the oxygenation status of the investigated tissues. Therefore, the aim of this study was to add to the previous experience by investigating the impact of hypoxia and heterogeneous radiosensitivity in tumours on tumour control probability (TCP) as predicted by the LQ and USC models using both simple and complex models of tumour oxygenation.
Material and methods
The study was performed using tumour models with different levels of complexity. For the comparison of survival curves, simple representations of tumour oxygenations were assumed, while a three-dimensional (3D) voxelised model of realistic tumour oxygenations was used for the purpose of comparing the predicted treatment outcome in terms of TCP.
According to the LQ model, the surviving fraction SF in a fully oxygenated cell population following irradiation with a dose d is:
where α and β are the radiosensitivity parameters for oxic conditions.
The corresponding expression for the USC model is:
where Dq is the dose at which the tangent of the final slope -1/D0 of the survival curve intercepts the horizontal axis at 100% survival, and DT is the threshold dose at which the LQ model transitions into the SHMT model.
Hypoxia modifies the cellular response to radiation such that less oxygenated cells are more radioresistant, requiring a higher dose to induce an equal amount of damage [Citation6]. Thus, to take into account the decrease in radiosensitivity resulting from hypoxia, the expressions in Equations 1 and 2 were modified as in Equation 3 for the LQ model and as in Equation 4 for the USC model.
The oxygen enhancement ratio (OER) in Equations 3 and 4 is a parameter giving the relative increase in required dose in hypoxic conditions to oxic conditions. In case of fully hypoxic cells, it was assumed that OER = 3.
Equations 1–4 could also be used to describe the response of populations of cells with heterogeneous oxygenations. Thus, for tumours with mixed population of cells, the survival was calculated as the weighted sum of survival in the sub-populations (Equation 5):
where SFoxic corresponds to Equations 1 or 2 while SFhypoxic corresponds to Equations 3 or 4 and HF is the fraction of hypoxic cells [Citation9].
The values of α and β used in all calculations were 0.33 Gy−1 and 0.038 Gy−2, respectively (α/β = 8.6 Gy), as suggested by Park et al. [Citation5] for non-small cell lung cancer. The corresponding values of D0, Dq and DT for NSCLC were 1.25 Gy, 1.8 Gy and 6.2 Gy, respectively [Citation5].
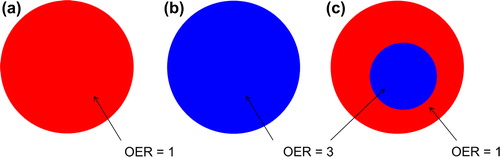
Survival curves were calculated for uniform single doses using both the LQ and USC models for three simple cases of tumour oxygenations: homogeneously oxic, homogeneously anoxic and a simple case of mixed oxygenations. In the completely oxic tumour model, a uniform value of the oxygen enhancement ratio (OER) of 1 was assumed, while in the anoxic case an OER of 3 was assumed. In the partly hypoxic tumour model, 20% of the tumour was assumed to have an OER of 3, and the remaining 80% an OER of 1. Schematic illustrations of these simple tumour oxygenations are shown in .
Figure 1. Simple models of tumour oxygenation: (a) uniformly oxic tumour with OER = 1, (b) uniformly anoxic tumour with OER = 3, and (c) partly hypoxic tumour with 20% hypoxia (OER = 3).
Tumour response was studied on voxelised 3D models simulating tumours with realistic heterogeneous oxygenations as previously described by Daşu et al. [Citation10,Citation11] and Toma-Daşu et al. [Citation12].
Two different heterogeneous oxygen distributions were considered for the modelled tumours; one moderately hypoxic tumour with a resulting hypoxic fraction (HF) less than 5 mmHg of about 1.1% and one more hypoxic tumour with a resulting HF of about 11.1%. The modelled tumours had a diameter of 20 mm, corresponding to a volume of 4.2 cm3. Examples of cross-sections through these tumours are shown in Supplementary Figure 1 available online at http://informahealthcare.com/doi/abs/10.3109/0284186X.2014.925582.
Cell response to the treatment was calculated using the two cell survival models assumed, LQ and the USC. As a result of the spatially varying oxygen tension on voxel level, the survival models were modified to include oxygen modifying factors (OMFs) dependent on the local oxygen tension (pO2) [Citation11]:
where OMFmax is the maximum resistance achieved in the absence of oxygen (corresponding to an OER of 3) and k is a constant around 2.5–3 mmHg [Citation13]. The present simulations used a value of k = 2.5 mmHg.
The tumour response was assessed as the TCP calculated with a Poisson equation [Citation14] as described in the Supplementary Appendix available online at http://informahealthcare.com/doi/abs/10.3109/0284186X.2014.925582.
Uniform dose delivery employing fractionation schemes of 1, 2, 3, 5, 8 and 10 fractions were simulated for the assumed tumours and dose-response curves were fitted to the resulting TCP data using a logit expression [Citation14]. Several assumptions were made for the dynamics of oxygenation in the modelled tumours. Thus, at one end of the spectrum no changes in the oxygenation (either local or global) during the treatment were assumed. This situation might be relevant for tumours treated with relatively short schedules in time periods shorter than the time needed for the removal of dead cells or for creating new blood vessels. On the other end of the spectrum both micro-scale oxygenation changes due to fluctuations in acute hypoxia [Citation15,Citation16] and slow reoxygenation of chronically hypoxic cells could happen for longer treatments consisting of a larger number of fractions [Citation6]. Thus, for the 10-fractions treatment of the 11.1% hypoxic tumour, four instances of reoxygenation have been modelled by randomly re-distributing the oxygen tension values between voxels (fast reoxygenation) as well as shrinking the hypoxic sub-volume (slow reoxygenation) [Citation10–12]. The HF was thus decreased to approximately 10.5%, 9.3%, 8.1% and 7.4% after each reoxygenation. Cross-sections through the tumour with the corresponding oxygenations are displayed in Supplementary Figure 2 available online at http://informahealthcare.com/doi/abs/10.3109/0284186X.2014.925582.
Results
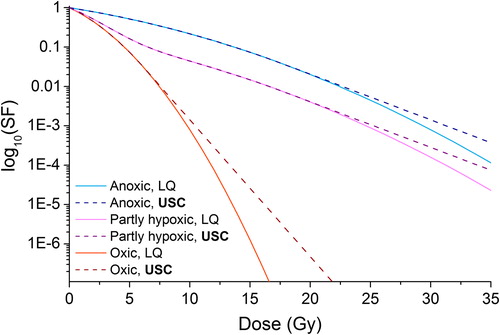
The survival curves obtained using the two different cell survival models for the three cases of simple tumour oxygenations (illustrated in ) clearly demonstrate the impact of hypoxia on the predicted survival for both the LQ and USC models (). The survival curves for the different oxygenation scenarios show that hypoxia increases the survival as predicted by both the LQ and the USC models. The level of hypoxia required for this effect was not found to be substantial, the difference between the 20% and 100% hypoxia survival curves being only moderate as compared to the well-oxygenated case. Moreover, the survival curves for the hypoxic case (blue curves) start to diverge only at much higher doses than for the completely oxic case (red curves). This could be observed for the intermediate case as well, in which only 20% of the cells were hypoxic (purple curves). Thus, in hypoxic cell populations a difference in predicted survival between the LQ and the USC model was only observed at very high doses, well above the commonly quoted upper dose limit beyond which the validity of the LQ model has been questioned.
Figure 2. Survival curves obtained with the LQ (solid curves) and USC (dashed curves) models. Red curves represent a uniformly oxic tumour with OER = 1, blue curves represent a uniformly anoxic tumour with OER = 3, and purple curves represent an intermediate case of a partly hypoxic tumour with 80% OER = 1 and 20% OER = 3.
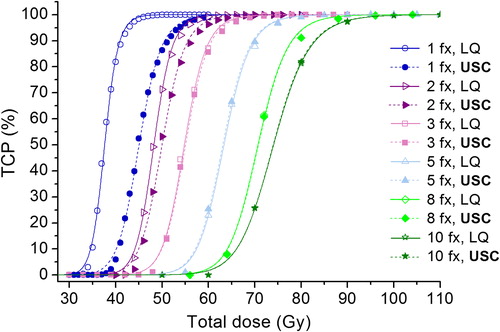
In and Supplementary Figure 3 available online at http://informahealthcare.com/doi/abs/10.3109/0284186X.2014.925582, it could be observed that the difference between the dose-response curves obtained with the two survival models decreases with increasing number of fractions. For the single-fraction schedule, a large difference in D50 could be observed for both tumour types, (5.4 and 9.5 Gy for the 1.1 and 11.1% HF, respectively). For the two-fraction schedule, the difference was considerably reduced to 1.8 and 2.8 Gy, respectively, and at three fractions (pink curves), the TCP curves are virtually indistinguishable (the difference is only 0.2 and 0.4 Gy respectively). At 10 fractions they overlap for both tumour types. The D50 values for each curve as obtained from the curve-fitting are presented in Supplementary Table I available online at http://informahealthcare.com/doi/abs/10.3109/0284186X.2014.925582. Interestingly, for the 11.1% hypoxic tumour, the values of D50 coincide already at five fractions (69.2 Gy), showing that with increasing number of fractions, the difference between the LQ and USC models decreases with increasing level of hypoxia.
Figure 3. Dose-response curves for the various fractionation schedules as a function of total dose delivered to a tumour with 1.1% hypoxic fraction. Calculations have been done based on both the LQ model (solid curves) and the USC model (dashed curves).
It is interesting to note that in spite of the big difference in predicted survival between the LQ and USC models at high doses for well-oxygenated populations of cells, even for just a small a fraction of hypoxic cells as 1%, the survival models predict very similar response to radiation.
For the 10-fractions schedule applied to a tumour with an initial HF of 11.1% and considering the reoxygenation patterns described above, the two survival models both predict a D50 of 48.2 Gy and a γ50 of 9.5. The required total dose was thus substantially reduced from 81.3 Gy as calculated for the corresponding case with no reoxygenation, while the trend for similar predictions by the two survival models could be observed assuming reoxygenation as well (see Supplementary Figure 4, available online at http://informahealthcare.com/doi/abs/10.3109/0284186X.2014.925582).
Discussion
Since the first stereotactic treatments of extra-cranial malignancies in the liver and lung were performed by Blomgren and Lax in the 1990s [Citation17,Citation18], the use of SBRT has continuously grown and led to high success rates in the treatments of several lesions [Citation19–21]. The increasing number of patients treated with SBRT, delivering few, very high-dose fractions, highlights the need for a reliable survival model to compare the radiobiological effectiveness of different fractionation schedules employed in the clinic. The LQ model has been criticised for over-estimating cell kill for high doses (e.g. above ∼8–10 Gy) for in vitro cell survival experiments and for this reason it has been suggested that it might be inadequate to model the response in this dose region. This criticism is based on the inability of the continuously bending LQ survival curve to predict cell survival at high doses in accordance with what has been observed in vitro [Citation1,Citation5]. The USC model developed by Park and colleagues was proposed as a simple solution, with ready-to-use expressions for the SBRT clinician [Citation5]. Nevertheless, the long clinical experience with the LQ model, the lack of a mechanistic basis and the details of the mathematical framework have been brought as arguments against the latter model [Citation2,Citation22,Citation23].
The present study was intended to extend the comparison between the LQ and USC models into the realm of realistic in vivo conditions. As previously mentioned, comparisons between the two models have often been performed on uniform oxic cell populations. This is however a situation that is seldom encountered in vivo as many tumours have heterogeneous oxygenations leading to heterogeneous radiosensitivities. Indeed, lack of oxygen will decrease the overall response of a tumour to radiation due to the increased radioresistance of the hypoxic cells. Mathematically, this is described by introducing OMFs in the expressions for cell survival, modifying the biological effect of the dose. It should be noted in this context that in the LQ model, this factor enters in square for the β-component which dominates at high doses, counteracting the continuous bend of the LQ-curve. This effect will naturally be smaller for the USC beyond the transition dose, as the oxygen modification is linear in the SHMT expression. The transition dose itself is also modified by hypoxia to maintain the relationship between dose and damage, such that the transition from the LQ- to the SHMT-expression occurs at a higher dose. Thus, hypoxia extends the dose-range for which the survival is determined by the LQ-expression in the USC model, and beyond the transition dose the LQ survival curve is affected by hypoxia to a higher degree than the USC. Combining these effects leads to a decrease in the difference in predicted survival between the LQ and USC models, and the survival curves coincide up to much higher doses in hypoxic tumours than in well-oxygenated tumours. It should be stressed that this applies to tumours containing hypoxic cells, and requires that the oxygenation is explicitly taken into account in the models as has been done in this study. This is in contrast to well-oxygenated cases where the two models predict quite different levels of survival or other effects [Citation7]. However, the results of this study have shown that the level of hypoxia required for this effect does not have to be substantial. Indeed, the results of this study show that as little as 1.1% hypoxia will cause the difference in D50 as predicted by either the LQ or the USC model for a two-fraction schedule to be only 1.8 Gy (48.2 and 50.0 Gy for the LQ and USC models, respectively, corresponding to fractional doses of 24.1 and 25 Gy). Thus, even for very high fractional doses far beyond the transition dose of 6.2 Gy reported by Park et al. [Citation5], the LQ and the USC models predict similar TCPs for a realistic model of tumour oxygenation with only 1.1% HF.
A general trend of higher D50 values for the USC model could be observed in the Supplementary Table I available online at http://informahealthcare.com/doi/abs/10.3109/0284186X.2014.925582. As the number of fractions increases, the D50 values calculated based on either the LQ or the USC model become closer for both tumour types (1.1 and 11.1% HF). However, the values coincide at a lower number of fractions for the more hypoxic tumour. This can be explained by the interplay in the effects of hypoxia on the survival models; a higher level of hypoxia requires a higher dose for the same level of control and thus an increase in D50, but hypoxia also increases the transition dose, decreasing the difference in predicted survival between the LQ and USC models for a given dose. It can thus be concluded that the impact of fractionation, i.e. increasing the number of fractions and hence reducing the dose per fraction, is larger for the more hypoxic tumour such that the difference between the LQ and USC models is reduced.
Microscopic changes in tumour oxygenation have been observed between fractions in experimental studies [Citation15,Citation16]. Fluctuations in acute hypoxia could thus be likely to occur from one fraction to another even in short radiotherapy treatments, such as SBRT. Furthermore, some reoxygenation of chronically hypoxic regions might take place in longer SBRT treatments. The results of our study demonstrate that whether reoxygenation occurs or not, the LQ model and the USC model predict similar levels of survival and hence also TCP for hypoxic tumours.
The results of this modelling study show that for a large range of fractional doses including multi-fraction stereotactic schemes, there is a minor difference in predicted survival and TCP between the LQ and USC models for realistic tumours with heterogeneous oxygenation.
http://informahealthcare.com/doi/abs/10.3109/0284186X.2014.925582
Download PDF (2.3 MB)Acknowledgements
Financial support from the Cancer Research Funds of Radiumhemmet is gratefully acknowledged.
Declaration of interest: The authors report no conflicts of interest. The authors alone are responsible for the content and writing of the paper.
References
- Barendsen GW. Dose fractionation, dose rate and iso-effect relationships for normal tissue responses. Int J Radiat Oncol Biol Phys 1982;8:1981–97.
- Brenner DJ. The linear-quadratic model is an appropriate methodology for determining isoeffective doses at large doses per fraction. Semin Radiat Oncol 2008;18:234–9.
- Kirkpatrick JP, Meyer JJ, Marks LB. The linear-quadratic model is inappropriate to model high dose per fraction effects in radiosurgery. Semin Radiat Oncol 2008;18:240–3.
- Kirkpatrick JP, Brenner DJ, Orton CG. Point/Counterpoint. The linear-quadratic model is inappropriate to model high dose per fraction effects in radiosurgery. Med Phys 2009;36: 3381–4.
- Park C, Papiez L, Zhang S, Story M, Timmerman RD. Universal survival curve and single fraction equivalent dose: Useful tools in understanding potency of ablative radiotherapy. Int J Radiat Oncol Biol Phys 2008;70:847–52.
- Hall EJ, Giaccia AJ. Radiobiology for the radiologist, 6th ed. Philadelphia: Lippincott/Williams & Wilkins; 2006.
- Wennberg BM, Baumann P, Gagliardi G, Nyman J, Drugge N, Hoyer M, et al. NTCP modelling of lung toxicity after SBRT comparing the universal survival curve and the linear quadratic model for fractionation correction. Acta Oncol 2011;50:518–27.
- Wennberg B, Lax I. The impact of fractionation in SBRT: Analysis with the linear quadratic model and the universal survival curve model. Acta Oncol 2013;52:902–909.
- Toma-Dasu I, Dasu A. Modelling tumour oxygenation, reoxygenation and implications on treatment outcome. Comput Math Methods Med 2013;2013:141087.
- Daşu A, Toma-Daşu I, Karlsson M. Theoretical simulation of tumour oxygenation and results from acute and chronic hypoxia. Phys Med Biol 2003;48:2829–42.
- Daşu A, Toma-Daşu I, Karlsson M. The effects of hypoxia on the theoretical modelling of tumour control probability. Acta Oncol 2005;44:563–71.
- Toma-Daşu I, Daşu A, Brahme A. Dose prescription and optimisation based on tumour hypoxia. Acta Oncol 2009; 48:1181–92.
- Alper T. Cellular radiobiology. Cambridge, UK: Cambridge University Press; 1979.
- Daşu A, Toma-Daşu I. Prostate alpha/beta revisited – an analysis of clinical results from 14 168 patients. Acta Oncol 2012;51:963–74.
- Ljungkvist AS, Bussink J, Kaanders JH, Wiedenmann NE, Vlasman R, van der Kogel AJ. Dynamics of hypoxia, proliferation and apoptosis after irradiation in a murine tumour model. Rad Res 2006;165:326–36.
- Ljungkvist AS, Bussink J, Kaanders JH, Rijken PF, Begg AC, Raleigh JA, et al. Hypoxic cell turnover in different solid tumor lines. Int J Rad Oncol Biol Phys 2005;62: 1157–68.
- Lax I, Blomgren H, Näslund I, Svanström R. Stereotactic radiotherapy of malignancies in the abdomen. Acta Oncol 1994;33:677–83.
- Blomgren H, Lax I, Näslund I, Svanström R. Stereotactic high dose fraction radiation therapy of extracranial tumours using an accelerator. Acta Oncol 1995;34:861–70.
- Høyer M, Muren LP. Stereotactic body radiation therapy – a discipline with Nordic origin and profile. Acta Oncol 2012;51:564–7.
- Chang UK, Cho WI, Kim MS, Cho CK, Lee DH, Rhee CH. Local control after retreatment of spinal metastasis using stereotactic body radiotherapy; comparison with initial treatment group. Acta Oncol 2012;51: 589–95.
- Scorsetti M, Alongi F, Filippi AR, Pentimalli S, Navarria P, Clerici E, et al. Long-term local control achieved after hypofractionated stereotactic body radiotherapy for adrenal gland metastases: A retrospective analysis of 34 patients. Acta Oncol 2012;51:618–23.
- Fowler J. Linear quadratics is alive and well: In regard to Park et al. (Int J Radiat Oncol Biol Phys 2008;70:847–52). Int J Radiat Oncol Biol Phys 2008;72:957–9.
- McKenna F, Ahmad S. Toward a unified survival curve: In regard to Kavanagh and Newman (Int J Radiat Oncol Biol Phys 2008;71:958–9) and Park et al. (Int J Radiat Oncol Biol Phys 2008;70:847–52). Int J Radiat Oncol Biol Phys 2009;73:640.