
Abstract
Background. The applicability of cone-beam computed tomography (CBCT) image sets for dose calculation purposes relies on high image quality and CT number accuracy. In this study we have investigated the use of stoichiometric calibration for transforming CT numbers into physical parameters, in combination with a new CBCT scatter correction algorithm, focusing on head and neck geometries.
Methods. CBCT projections were acquired using an On-Board-Imager (OBI v1.4; Varian Medical Systems) using both low- and high-dose clinical image acquisition protocols. The CBCT projections were reconstructed twice, using both the standard method (OBI) as well as an experimental pre-clinical reconstruction algorithm (Full Fan Experimental - FFE). Stoichiometric calibration was performed using both a phantom from CIRS with nine tissue equivalent inserts (ranging from lung to dense bone) as well as with a custom made cylindrical PMMA head and neck phantom with variable ‘head’ diameter and with cavities designed to fit the inserts from a Gammex RMI phantom. To benchmark the CBCT performance, the same calibration procedures were performed using two conventional CT scanners. For assessment of influence on dose-volume parameters, the head part of the anthropomorphic Alderson phantom was scanned, reconstructed with both CT and CBCT using the stoichiometric calibration curves, and finally used to compare IMRT dose calculations.
Results. The stoichiometric CBCT calibrations with the CIRS phantom resulted in an excellent fit between calculated and measured CT numbers (R = 1.000 for all combinations tested), equivalent to the results for the conventional scanners. Using the PMMA phantom, the stoichiometric calibration curves again showed excellent agreement, although the OBI reconstruction showed marginally increasing deviation from the unity line as the phantom size decreased. For the dose-volume parameters, deviations well within 1% were seen between the different reconstruction methods and acquisition modes.
Conclusion. This study showed that the combination of an improved reconstruction method and stoichiometric calibration improved the CT number accuracy of CBCT scans acquired for head and neck phantoms. In particular, a radial size dependence of the scanned object similar to that in conventional CT could be achieved. Although high density inhomogeneities still are challenging for the reconstruction process, clinically acceptable agreement in key dose-volume parameters between CT-based and CBCT-based IMRT planning calculations on a humanoid phantom was found.
With the integration of kilovoltage (kV) cone-beam computed tomography (CBCT) on linear accelerators for radiotherapy (RT) the possibility to image the patient anatomy on a daily basis has improved [Citation1] and several adaptive RT (ART) studies have emerged [Citation2–11]. The usability of the acquired image sets for dose verification, treatment planning and adaptation depends to a very high degree on the image quality and accuracy of CT numbers [Hounsfield units (HU)]. An inherent property of this image modality is the large cone-beam geometry which leads to image artefacts primarily due to scatter [Citation12], as opposed to conventional kV fan-beam CT used for standard RT planning. Such inaccuracies can have a significant impact on dose calculations which, in general, relies on conversion from CT numbers to radiological properties of human tissues. For high-energy photons these properties are dominated by Compton interactions and depending on the electron density ratios (EDRs) and for charged particle RT the stopping power ratios (SPRs) (both ratios relative to water) [Citation13–18].
The calibration for HU to EDR (or SPR) conversion in a treatment planning system (TPS) is typically based on measurements in CT scans of tissue equivalent materials of known electron densities in a phantom. The stability of this tissue substitute HU-EDR calibration has been investigated previously also for CBCT-based dose calculation. Based on CBCT scans of the Catphan 504 phantom (The Phantom Laboratory, Salem, NY, USA), supplied by the vendor for linear attenuation to HU calibration and image quality assessment, the HU-EDR curve has been found to be stable both over time and across different scan settings [Citation19]. However, the phantom uses Teflon composed of carbon and fluorine as the high EDR substitute for dense bone. In real bone the presence of calcium and phosphor with higher effective atomic number results in higher HU values for the same EDR as Teflon due to more photoelectric interactions [Citation20,Citation21] leading to dose calculation inaccuracies [Citation22,Citation23]. More importantly for the variation in HU-EDR relation for CBCT is the amount of scatter present during calibration which should resemble the clinical treatment situation. For the pelvic region the phantom length and especially the radial diameter has been shown to have a large impact on HU numbers [Citation22]. Also a reduction in scan length or cone angle will reduce the scatter contribution and change the HU-EDR curve [Citation23,Citation24]. To minimize the influence on dose calculation accuracy site-specific HU-EDR calibrations has been suggested [Citation24,Citation25]. The latter work also aimed to avoid the use of tissue equivalent materials by creating population/patient-specific HU-EDR curves. The average CBCT HU values for clinical tissue types were determined and subsequently mapped to average CT electron density for the same tissues [Citation25]. Alternatively, methods for a complete override of CBCT HU values using either rigid [Citation26,Citation27] or deformable image registration [Citation19,Citation28] to CT have also been investigated.
Previous studies have clearly showed that key requirements to obtain accurate HU-EDR calibration for CBCT are the use of tissue equivalent material under appropriate scatter conditions. In this study we therefore aimed at addressing these for the head and neck region by applying a stoichiometric calibration method for transforming CT numbers into physical parameters, in combination with a newly developed CBCT scatter correction algorithm [Citation29]. Stoichiometric calibration has been found to be more accurate than direct tissue substitution and was proposed by Schneider et al. [Citation16]. By measuring HU-values in a set of tissue substitutes with known elemental composition, scanner-specific parameters was determined and further used to calculate HU-values of standard human biological tissues to give the relation to EDR or proton SPR.
Material and methods
Imaging devices and acquisition parameters
All CBCT scans presented in this study were acquired on a Trilogy Tx linear accelerator from Varian Medical Systems (Varian Medical Systems, Palo Alto, CA, USA) equipped with an On-Board-Imager (OBI v1.4) that consisted of a kilovoltage x-ray source and an amorphous silicon detector mounted on the gantry orthogonal to the treatment beam. The geometry of the system was kept fixed for all measurements according to our HN protocols: Full-fan cone fan type with bow tie filtration, anti-scatter grid, source-detector distance of 1500 mm, 3 mm slice thickness, transversal field-of-view (FOV) of 250mm, and scan length of 180 mm giving rise to approximately 175 mm longitudinal FOV. Two different CBCT acquisition modes were applied in the evaluation, the standard-dose head (SDH) and high-quality head (HQH) clinical HN protocols based on 200o ‘partial-angle’ scan technique. Both modes have a peak voltage of 100 kVp. SDH uses a tube current of 20 mA and an exposure time of 20 ms, whereas HQH has a five times higher exposure with 80 mA and 25 ms, respectively.
To benchmark the CBCT image properties, two conventional multislice CT scanners used for RT planning in our department were studied (models Mx8000 IDT 16 and BB16, Philips Medical Systems, Eindhoven, The Netherlands). The standard clinical spiral CT HN protocols were applied for both scanners: kVp 120; FOV 250 mm, 350 mm and 500 mm; collimation 16 × 0.75 mm; matrix 512 × 512 pixels; filter sharp C; 3 mm slice thickness. The exposure was varied between values of 150 mAs and 300 mAs per frame.
CBCT image reconstruction
For all CBCT scans the raw image projections were transferred to a stand-alone reconstruction computer along with a copy of the calibration files for CBCT acquisition on the clinical OBI system. The stand-alone reconstruction software was installed with a complete copy of the clinical reconstruction (referred to as OBI) as well as an experimental reconstruction algorithm (Full fan experimental reconstruction – FFE) recently implemented on the Varian TrueBeam linear accelerator platform. All sets of image projections were reconstructed twice, with each of the methods. The FFE includes an analytical beam hardening correction and uses an adaptive pencil beam-based scatter correction algorithm to account for scatter in the raw projections due to object size, object edge effects, detector scatter properties and the anti-scatter grid mounted on the clinical system. A detailed description of the scatter model and parameters used as well as the complete reconstruction process has been published previously [Citation29], and we have in this study not modified any parameters from the original setup. Only one additional calibration had to be performed ‘in-house’ for FFE reconstruction. The linear attenuation to HU calibration was done using scans of Catphan 504 phantom by assigning HU values from the Catphan manual to FFE reconstructed raw image values of the seven material inserts followed by a linear fit [Citation30]. To compare with the stoichiometric calibration described below the HU-EDR curve generated from Catphan nominal HU-values and EDRs was used.
Phantoms for HU-EDR stoichiometric calibration
For HU to EDR calibration on conventional CT scanners the Gammex RMI model 467 (Gammex Inc., Middleton, WI, USA) is used as standard in our department (Supplementary Figure 1, (available online at: http://informahealthcare.com/doi/abs/10.3109/0284186X.2014.927073). This phantom is a 33 cm diameter, 5 cm thick disk made of CT solid water with 16 2.8 cm diameter holes for 7 cm long inserts of tissue equivalent epoxy resin materials. The 13 different inserts available for calibration were LN-300 and LN-450 lung equivalent materials, AP6 adipose, BR-12 breast, CT solid water, BRN-SR2 brain, LV1 liver, IB inner bone, B200 bone mineral, CB2-30% CaCO3, CB2-50% CaCO3, SB3 cortical bone, and a water syringe. Their mass densities and elemental composition were provided by Gammex Inc. The size of this phantom makes it unsuitable for CBCT calibration of full fan protocols which are limited to a maximum FOV of 25 cm.
To study the influence of the radial object size on the calibration, a custom made cylindrical PMMA phantom designed to enable a crude simulation of the head and neck anatomy was employed (Supplementary Figure 1 available online at: http://informahealthcare.com/doi/abs/10.3109/0284186X.2014.927073). The phantom consisted of a 12 cm long ‘neck’ part with a fixed diameter of 12 cm attached to a 15 cm long ‘head’ which has an outer diameter of 20 cm. The size corresponds to that of the Catphan 504 calibration phantom used for the general calibration of CT numbers on the CBCT imaging system. Two concentric cylinders can be removed to shrink the diameter of the head part to 18 cm and 16 cm, respectively. At the end of the ‘head’ five holes to fit the Gammex RMI inserts described above have been made, one central positioned and the rest at increasing radial distance. The ‘neck’ end holds three similar holes for inserts. To provide sufficient scatter when the CBCT isocenter was positioned at the center of the inserts, an 8 cm long diameter-adjustable ‘hat’ was used to extend the head part longitudinally. For all stoichiometric calibration measurements only the central hole was equipped with the inhomogeneity inserts, one insert scanned at a time, the rest of the holes was filled with PMMA.
The CIRS model 062A CBCT phantom (CIRS INC., Norfolk, VA, USA) made of plastic water has a central section consisting of a 18 cm diameter disk, 5 cm thick, which can hold nine tissue equivalent (epoxy resin based) inserts of 3 cm diameter (Supplementary Figure 1 available online at: http://informahealthcare.com/doi/abs/10.3109/0284186X.2014.927073). One insert is positioned in the center and eight in the periphery with 6 cm radial displacement. The inserts were: lung (inhale), lung (exhale), adipose, breast 50/50, plastic water (PW), muscle, liver, trabecular bone 200 mg/cc and dense bone 800 mg/cm3 (only 1 cm diameter inserted in plastic water). Mass densities and elemental composition were provided by CIRS Inc. The phantom was squeezed between 10 cm solid water on each side to create full scatter in the FOV. In this setup data for stoichiometric calibration can be acquired in one scan. However, to average the effect of CT number non-uniformity in the CBCT axial slices, nine scans were performed with permutation of the position of the inserts so each insert were scanned in each of the eight periphery and center positions. This enabled a separate stoichiometric calibration for the center and the periphery of the phantom.
Stoichoimetric calibration
The theory and equations used for stoichiometric calibration are described in the Supplementary Appendix (available online at: http://informahealthcare.com/doi/abs/10.3109/0284186X.2014.927073). From the HU of the scanned inserts and their elemental composition the derived values of the three parameters ![]() ,
, ![]() , and
, and ![]() , were used to predict the corresponding values of EDR and HU values for real human tissues. We used the 71 human tissues also considered by Schneider et al. [Citation18] (tables 3–5 therein) with the mass densities and elemental compositions from the literature [Citation31,Citation32]. To obtain the stoichiometric calibration from plotting EDR against HU, Schneider et al. [Citation16] created three linear fits through lung, soft and bony tissues, respectively. As an alternative approach, Schneider et al. [Citation18] found that, depending on the HU value, the tissue parameters of human adipose, muscle/organ or bone could be interpolated between either ‘adipose tissue 3’ ([Citation18], table 3) and adrenal gland, small intestine tract and connective tissue, or bone marrow and cortical bone. We have combined these two approaches in the sense that separate linear fits have been made in the latter three tissue regions. From the fitting parameters we calculated connection points to combine the regions into the full HU-EDR curve which in our case has to be monotonously increasing to be accepted by the TPS.
, were used to predict the corresponding values of EDR and HU values for real human tissues. We used the 71 human tissues also considered by Schneider et al. [Citation18] (tables 3–5 therein) with the mass densities and elemental compositions from the literature [Citation31,Citation32]. To obtain the stoichiometric calibration from plotting EDR against HU, Schneider et al. [Citation16] created three linear fits through lung, soft and bony tissues, respectively. As an alternative approach, Schneider et al. [Citation18] found that, depending on the HU value, the tissue parameters of human adipose, muscle/organ or bone could be interpolated between either ‘adipose tissue 3’ ([Citation18], table 3) and adrenal gland, small intestine tract and connective tissue, or bone marrow and cortical bone. We have combined these two approaches in the sense that separate linear fits have been made in the latter three tissue regions. From the fitting parameters we calculated connection points to combine the regions into the full HU-EDR curve which in our case has to be monotonously increasing to be accepted by the TPS.
Starting from the high EDR end, the upper bone point corresponded to cortical bone. To avoid discontinuity between the bone and muscle/organ regions, the bone part was ended at the EDR value for connective tissue. At the HU-value for connective tissue the average EDR value calculated from the bone and muscle/organ fits was subsequent used to estimate the CT number for the muscle/organ endpoint. The two regions were finally connected. Between the two soft tissue parts the average EDR from adrenal gland and small intestine was used to calculate the corresponding HU-values for the endpoint and starting point for the adipose and muscle/organ regions, respectively. Finally, the ‘adipose tissue 3’ was used as the lower point of the soft tissue part and the completion of the HU-EDR curve downward was done by connection of this point to air. All together seven connection points were estimated to characterize the full HU-EDR curve.
For all the stoichiometric calibration the mean CT number and standard deviation in regions of interest (ROIs) of 17 mm diameter (8 mm diameter used for CIRS dense bone) positioned in the center of the different tissue-substitute material inserts have been used and presented results were averaged over five consecutive slices. For CBCT the isocenter of the imaging system coincided with the radial center of the phantoms and in the longitudinal direction with the center of inserts. All ROI statistics were performed in the software ImageJ (National Institute of Health, USA, http://rsb.info.nih.gov/ij) on image sets which were DICOM exported after the reconstruction.
Dose calculation and evaluation
The head part of the anthropomorphic Alderson Radiation Therapy phantom (RSD INC., Long Beach, CA, USA) was scanned and reconstructed with both CT and CBCT using the same parameters as for the stoichiometric calibrations, followed by import into the Eclipse TPS (Varian Medical Systems). On the CT scan a six-field 6 MV photon IMRT plan with gantry angles 45, 75, 165, 195, 285, and 315 was created and optimized according to clinical practise. To drive the optimization several hypothetical structures were contoured to simulate a real patient in terms of location, shape and size: a clinical target volume (CTV) expanded with 5 mm margin to a planning target volume (PTV), spinal cord, left and right parotid gland, and mandible. CT and CBCT image sets were rigidly registered as deformations were carefully avoided in the transfer of the phantom between the two imaging modalities. Following the registration the structure set was propagated from CT to CBCT with resulting volume differences less than 1.7 cm3. Subsequently, the IMRT plan with fluence maps and monitor units was copied to the CBCT and calculated using the anisotropic analytic algorithm (AAA) with the different HU-EDR calibration curves. Differences in source-to-skin distance between the two image sets due to the registration were less than 1 mm for all fields. To evaluate the dose distributions the central-axis dose in the plans and the minimum, maximum and mean dose from dose-volume histogram (DVH) parameters of the structures were recorded. Finally, the complete three-dimensional dose distributions were compared using gamma-index pass/fail analysis [Citation33–35] by in-house software using 1% dose difference and 3 mm distance-to-agreement criteria.
Results
Stoichiometric calibration
For reference stoichiometric calibration curves, CT scans of the three phantoms were acquired, CT numbers were measured and the model was applied; the results of this procedure are shown in Supplementary Figure 2 (available online at: http://informahealthcare.com/doi/abs/10.3109/0284186X.2014.927073). For each phantom the results obtained with the HN protocol on the two CT scanners were averaged as the difference for the final seven connection points were at most 1 HU for the soft tissue region and 14 HU for the upper cortical bone. Results obtained with different FOV settings and exposures on the two CT scanners were included in this variation. In Supplementary Figure 2(a) (available online at: http://informahealthcare.com/doi/abs/10.3109/0284186X.2014.927073) the CT numbers calculated from the fitted stoichiometric models versus measured values of material inserts are illustrated for the Gammex RMI, CIRS and PMMA HN phantoms. A linear regression fit for each data set gave R 2-values > 0.999. For the PMMA phantom only the extreme 20 cm and 12 cm diameters are shown since the remaining variants lie in between. Supplementary Figure 2(b) and (c) (available online at: http://informahealthcare.com/doi/abs/10.3109/0284186X.2014.927073) show the HU conversion obtained for Gammex RMI (our clinical reference) calculated from fitted values of ![]() = 2.26E-05,
= 2.26E-05, ![]() = 3.70E-04 and
= 3.70E-04 and ![]() = 9.47E-01. To illustrate the components of the full HU-EDR curve, the linear fits to the human tissue points in the adipose, muscle/organ and bone regions have been added. In Supplementary Figure 2(d) (available online at: http://informahealthcare.com/doi/abs/10.3109/0284186X.2014.927073) the stoichiometric calibration curves for the CIRS phantom using either the center or periphery HU-value readings of the inserts are seen to be very similar. The difference for the cortical bone tissue point (small insert) is 24 HU, and an average of the two readings yields a value of 1548 HU (based on
= 9.47E-01. To illustrate the components of the full HU-EDR curve, the linear fits to the human tissue points in the adipose, muscle/organ and bone regions have been added. In Supplementary Figure 2(d) (available online at: http://informahealthcare.com/doi/abs/10.3109/0284186X.2014.927073) the stoichiometric calibration curves for the CIRS phantom using either the center or periphery HU-value readings of the inserts are seen to be very similar. The difference for the cortical bone tissue point (small insert) is 24 HU, and an average of the two readings yields a value of 1548 HU (based on ![]() = 5.34E-06,
= 5.34E-06, ![]() = 5.31E-03 and
= 5.31E-03 and ![]() = 8.31E-01) which is 235 HU or 18% higher than for the Gammex RMI calibration. This difference corresponds to approximately 7% in EDR. The gap observed in the soft tissue range of 0–100 HU on Supplementary Figure 2(d) (available online at: http://informahealthcare.com/doi/abs/10.3109/0284186X.2014.927073) between the CIRS curves and the ones based on Gammex inserts leads to 3–5% difference in EDR. For the PMMA HN phantom the reduction in diameter from 20 cm to 12 cm resulted primarily in a decrease of the slope of the HU-EDR curve in the bone region which for the cortical bone point increased the CT number from 1452 HU to 1557 HU, or approximately −13 HU/cm (ΔHU/Δdiameter) if a linear relation is assumed.
= 8.31E-01) which is 235 HU or 18% higher than for the Gammex RMI calibration. This difference corresponds to approximately 7% in EDR. The gap observed in the soft tissue range of 0–100 HU on Supplementary Figure 2(d) (available online at: http://informahealthcare.com/doi/abs/10.3109/0284186X.2014.927073) between the CIRS curves and the ones based on Gammex inserts leads to 3–5% difference in EDR. For the PMMA HN phantom the reduction in diameter from 20 cm to 12 cm resulted primarily in a decrease of the slope of the HU-EDR curve in the bone region which for the cortical bone point increased the CT number from 1452 HU to 1557 HU, or approximately −13 HU/cm (ΔHU/Δdiameter) if a linear relation is assumed.
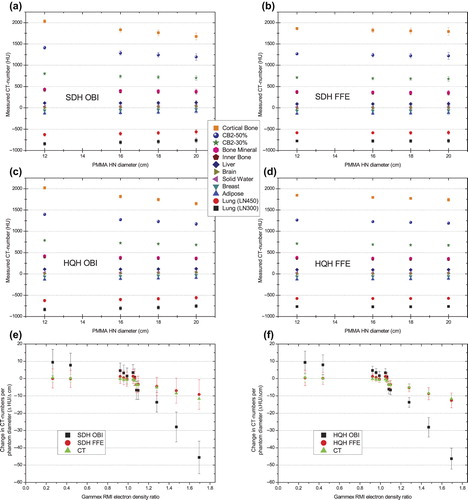
For the CBCT modes the effect of four different phantom sizes on the measured CT numbers is shown in . For the same reconstruction method the HU-values in the 12 inserts were very similar [(a) vs. (c) and (b) vs. (d)] with the error bars being smaller for HQH due to the five times higher exposure. However, the CT numbers from FFE compared to OBI reconstruction exhibited less sensitivity to phantom size as depicted in and where the slopes from linear regression fits of CT number versus size for each insert have been plotted. For inserts with electron density lower than water (EDR < 1) the CT numbers increased up to 10 HU/cm with increasing phantom diameter for OBI whereas for FFE the CT numbers were practically unaffected. With increasing substitute electron density above water the OBI resulted in decreasing CT numbers, strongest for cortical bone with −46 HU/cm. The corresponding value for the FFE reconstruction was only approximately −10 HU/cm. For comparison the equivalent phantom size dependence measurements from CT have been added.
Figure 1. CBCT scans of the PMMA HN phantom of 12, 16, 18 and 20 cm diameter with 12 different Gammex RMI density inserts positioned in the center one at a time. (a) and (b) Measured mean CT numbers and standard deviations from SDH mode with OBI and FFE image reconstruction, respectively, as a function of phantom diameter (abbreviations in Material and methods). Similar results for HQH mode are depicted in (c) and (d). Assuming a linear dependence, (e) and (f) show the change in CT number per phantom diameter (ΔHU/Δcm) plotted as a function of increasing insert EDR for the SDH data in (a) and (b) and the HQH data in (c) and (d), respectively. Error bars correspond to ± one standard error from linear regression. For comparison the equivalent CT data have been added on both.
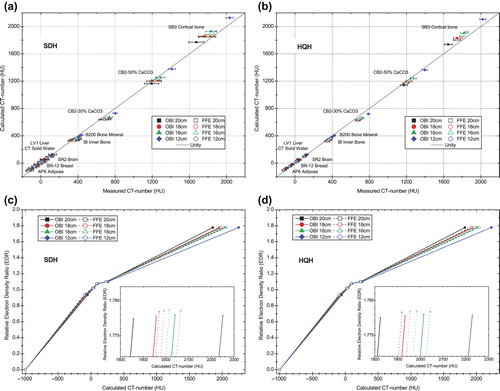
The stoichiometric calibrations obtained from the different phantom sizes are illustrated in . The correspondence between the calculated and measured CT numbers depicted in and gave R2-values > 0.996 for all data sets. Similar for the two CBCT modes the FFE reconstruction gave better agreement in the models which worked equally well for all phantom diameters, whereas OBI showed marginally increasing deviation from the unity line as the phantom size decreased. The effect of phantom size on the CT numbers for the bone substitutes lead to the variation in HU-EDR curves shown in and . For the upper cortical bone point depicted in the zoom inserts, the span in CT numbers was approximately 400 HU going from 20 cm to 12 cm diameter or − 50 HU/cm for OBI. For FFE the effect reduced to around 100 HU or − 13 HU/cm. The adipose connection point also experienced considerable less sensitivity to phantom size as the variation decreased from 40 HU for OBI to 7 HU with FFE.
Figure 2. CBCT scans of the PMMA HN phantom of 12, 16, 18 and 20 cm diameter with 12 different Gammex RMI density inserts positioned in the center one at a time. (a) and (b) Calculated versus measured CT numbers from stoichiometric calibration models of SDH and HQH modes fitted for the four different phantom sizes and two reconstruction methods. (c) and (d) The corresponding HU-EDR curves. The two inserts show zooms around the highest EDR value (cortical bone).
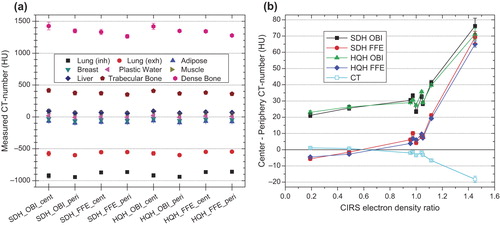
The results of measured CT numbers from CBCT scans of the CIRS phantom with inserts positioned in either center or periphery (average over eight different positions) are depicted in . The difference between the two locations has been visualized in for each mode and reconstruction. CT numbers that were around 20–30 HU higher in the center of the phantom was observed for OBI for electron densities up to those of water, with increasing difference for higher densities. The equivalent FFE reconstruction showed agreement within ± 10 HU below the bone region but a similar increase as OBI for high densities. For CT the corresponding measurements also depicted in gave less variation and lower CT numbers in the center than in the periphery for bone. Supplementary Figure 3(a) (available online at: http://informahealthcare.com/doi/abs/10.3109/0284186X.2014.927073) illustrates the correlation between the calculated and measured CT numbers after the eight linear regression model fits which all had a R2-values = 1.000 and a slope of unity. The course of the corresponding HU-EDR curves in Supplementary Figure 3(b) (available online at: http://informahealthcare.com/doi/abs/10.3109/0284186X.2014.927073) and the order of the connection points for the different data sets followed the trend and behavior in . As for the CT CIRS data we averaged the measured CT numbers for the center and periphery to calculate CBCT HU-EDR curves based on the CIRS phantom (i.e. four different curves). For the two clinical OBI reconstruction methods the three model parameters yielded ![]() = 4.04E-06,
= 4.04E-06, ![]() = 1.10E-02 and
= 1.10E-02 and ![]() = 6.62E-01 for SDH, and
= 6.62E-01 for SDH, and ![]() = 8.11E-06,
= 8.11E-06, ![]() = 9.83E-03, and
= 9.83E-03, and ![]() = 6.92E-01 for HQH, respectively.
= 6.92E-01 for HQH, respectively.
Figure 3. CBCT scans of CIRS 18cm diameter phantom with cyclic permutation of insert positions. (a) The measured mean CT number and standard deviation for each insert in either the center or eight periphery positions as a function of mode and reconstruction method. (b) The measured CT number in the center minus periphery for each insert plotted as a function of increasing EDR for the inserts. For comparison the equivalent CT data have been added. Error bars correspond to ± one standard error of the mean.
Dose calculation
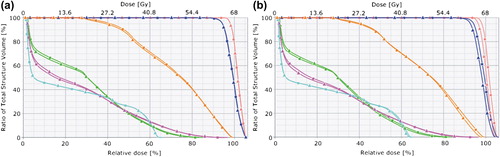
The comparison of DVH parameters obtained for the six-field IMRT plan on CT versus CBCT is listed in Supplementary Table I (available online at: http://informahealthcare.com/doi/abs/10.3109/0284186X.2014.927073). The parameters at the top of the upper, middle and lower part of the table stem from a separate IMRT plan on CT using the stoichiometric calibrations in Supplementary Figure 2(d) (available online at: http://informahealthcare.com/doi/abs/10.3109/0284186X.2014.927073) for Gammex, PMMA16cm, and CIRS, respectively. Displayed is the net inhomogeneous dose difference (obtained by subtracting the inhomogeneous CBCT-CT dose difference from the corresponding homogenous difference) in central-axis dose Dcax (%), and the Dmin (%), the Dmax (%) and Dmean (%) for each structure shown as a function of CBCT mode, reconstruction method and applied HU-EDR curve. We found that the variation with mode and reconstruction within each of the six groups was small, maximum 0.3% but mostly less. The overall picture in the upper part of the table showed that the dose difference was within ± 1.0% for the first three groups while as much as −1.7% difference was observed based on Catphan. For the middle and lower part with the same phantom used for CT and CBCT HU-EDR calibration the differences were smaller and within ± 0.8%. compares the DVH curves from the IMRT plan calculated on CT and on HQH CBCT in FFE reconstruction using the CIRS phantom HU-EDR calibration on both. Supplementary Figure 4 (available online at: http://informahealthcare.com/doi/abs/10.3109/0284186X.2014.927073) illustrates the corresponding isodose distributions which appeared similar. For comparison shows the DVH plots for one of the scenarios in Supplementary Table I (available online at: http://informahealthcare.com/doi/abs/10.3109/0284186X.2014.927073) which gave the largest dose difference, namely IMRT plans based on HU-EDR curve from Gammex on CT and Catphan on CBCT, respectively. Finally, as depicted to the right in Supplementary Table I (available online at: http://informahealthcare.com/doi/abs/10.3109/0284186X.2014.927073), the gamma-index fail rate (Γ fail) comparing the entire dose distributions was very low in general except when using the Catphan HU-EDR curve where more than 3% of the dose grid points failed.
Figure 4. DVH plot of CTV (pink), PTV (blue), spinal cord (cyan), left parotid (green), right parotid (magenta), and mandible (orange) comparing IMRT plan on CT (solid square) and HQH CBCT (solid triangle) in FFE reconstruction. (a) HU-EDR curve calibrated with CIRS phantom on both CT and CBCT. (b) HU-EDR curve from Gammex on CT and Catphan on CBCT, respectively.
In addition to re-calculations of dose distributions from the copied IMRT plan on CBCT, we also performed a full re-planning based on the optimization objectives from the CT plan. Using the CIRS HU-EDR calibration for CT and the CIRS mode and reconstruction-specific HU-EDR curves for CBCT, we observed changes in monitor units between − 4% and + 2% for the six fields. The DVH parameters of the four re-optimized IMRT plans agreed within ± 0.3% which was similar to the values in Supplementary Table I (available online at: http://informahealthcare.com/doi/abs/10.3109/0284186X.2014.927073). Comparing these re-optimized plans with the re-calculated ones copied from CT showed agreement within ± 1.1% for the same mode and reconstruction method.
Discussion
In this study, we have evaluated the effect of reconstruction method for CT number accuracy and HU-EDR calibration stability in dedicated, clinically applied CBCT acquisition modes for the head and neck region. A direct comparison between present clinical image reconstruction and the use of a new algorithm was performed using different phantoms and stoichiometric calibration, and the impact on dose calculation was investigated in an anthropomorphic head phantom.
Before application for CBCT a benchmark of the stoichiometric calibration model on the conventional CT scanners with clinical HN protocols was investigated. The Gammex RMI phantom has been reported to yield a considerable variety in stoichiometric calibration parameters between different scanners [Citation21]. However, we found consistent results on two scanners, the average result shown in Supplementary Figure 2 (available online at: http://informahealthcare.com/doi/abs/10.3109/0284186X.2014.927073). Beam hardening has also been shown to influence stoichiometric calibration in CT [Citation17] which is also evident from Supplementary Figure 2 (available online at: http://informahealthcare.com/doi/abs/10.3109/0284186X.2014.927073) for the custom made PMMA HN phantom. As the phantom size decreases the measured CT numbers increases due to reduced effect of beam hardening, most notably for substitutes with high Z since the attenuation from photoelectric interactions scales proportional to (Z/E)3. For the CIRS phantom a small beam hardening effect between center and periphery was observed [Supplementary Figure 2(b) available online at: http://informahealthcare.com/doi/abs/10.3109/0284186X.2014.927073].
For CBCT, the situation is more complicated as beam hardening and scatter are confounding effects influencing the CT number accuracy. The measured HU-values for varying diameter of the PMMA phantom were depicted in . There was a minor effect of the different exposure between the two CBCT modes as reported earlier for the OBI v1.3 [Citation24]. However, the change in CT number with phantom diameter showed a marked difference from OBI to FFE reconstruction. In FFE utilizing analytical beam hardening and scatter corrections based on estimated object size, the dependence looked very similar to CT, which also holds for the stoichiometric calibration curves in . For OBI a possible explanation could go along the line of Guan and Dong [Citation23] who looked at scatter variation with changing FOV for pelvic CBCT mode. For a given projection ray the line integral of the attenuation is:
log(I0/I) = log(I0/(Iprimary + Iscatter)) = log(I0/ (Iprimary (1 + Iscatter/Iprimary))), where I0, Iprimary, and Iscatter are unattenuated, primary transmitted, and scattered x-rays, respectively. Increasing the phantom size for low density lung increases Iscatter and decreases Iprimary which lead to higher attenuation and increasing CT number. At the other end of the density scale, as Iprimary is already low passing through bone, the combined effect of beam hardening and increased scatter decreases attenuation and CT numbers accordingly. The consequence of this flattened projection attenuation profile is a steeper HU-EDR curve with increasing phantom size, as observed in .
A difference in HU-values was observed for inserts located in either center or periphery of the CIRS phantom []. The general offset in CT numbers between OBI and FFE reconstruction in center minus periphery was approximately 25 HU for densities below bone, and agreed with the amount of capping reported earlier [Citation30]. Using the HU- values for the plastic water insert gives a uniformity index [(HUperiphery – HUcenter)/(HUcenter + 1000 HU)] of − 2.5% for OBI and − 0.5% for FFE on average for the two modes. For the dense bone insert both reconstruction methods showed a relative difference of + 5% between center and periphery, and a variation in periphery CT number of ± 2% from the average value (lowest for FFE) as the position was shifted between the eight locations (data not shown). Neither of the reconstructions takes object heterogeneity into consideration (OBI uses a phantom norm calibration and FFE a scatter algorithm based on a water object), so dense structures may generate scatter distributions not accounted for. Future reconstruction algorithms should be optimized to correct for this effect.
The comparison of DVH parameters in Supplementary Table I (available online at: http://informahealthcare.com/doi/abs/10.3109/0284186X.2014.927073) revealed that the difference in image quality obtainable with the two considered CBCT modes, irrespective of the reconstruction method [Citation30], had little influence on the dose calculation properties in comparison with CT. Using the same HU-EDR curve (Gammex and Catphan) gave at most 0.2% dose difference in this ideal case with an anthropomorphic HN phantom. A similar difference was found using mode and reconstruction-specific calibration. The lower parts of Supplementary Table I (available online at: http://informahealthcare.com/doi/abs/10.3109/0284186X.2014.927073) showed that the best agreement was obtained by stoichiometric calibration with the same phantom on both CT and CBCT (± 0.8%), compared to the upper part based on Gammex (± 1.0%). Also from an IMRT plan in an anthropomorphic HN phantom DVH differences of approximately 1% have been reported using the older clinical OBI v1.3 with the CIRS HU-EDR calibration [Citation24]. Well aware that CBCT HU-EDR calibration using Catphan has been reported problematic [Citation22,Citation23] in the pelvis, we included it for comparison and found the largest dose difference of 1.7%.
This study has been limited to the head and neck region for the purpose of benchmarking CBCT-based dose calculation in ART. The findings may differ for pelvis (previously studied [Citation22,Citation23]) and thorax where different scatter distributions are present requiring separate HU-EDR curves [Citation24,Citation25,Citation27]. The ‘direct’ calibration method studied here has a relatively simple and easy use for dose recalculation on CBCT compared to ‘indirect’ methods relying on density override [Citation19,Citation26–28]. Particularly the latter with the use of deformable image registration which, although a central component in ART for contour propagation and dose accumulation, still needs further development in validation and robustness for unsupervised daily clinical application [Citation28,Citation36,Citation37]. The use of the presented method for HU-SPR conversion in CBCT-based dose calculation for proton therapy is currently under investigation.
In conclusion, this study showed that the combination of an improved reconstruction method and stoichiometric calibration improved the CT number accuracy in CBCT scans acquired of head and neck phantoms. In particular, a radial size dependence of the scanned object similar to that in conventional CT could be achieved. Although high density inhomogeneities are still challenging for the reconstruction process, agreement well within 1% in key dose-volume parameters between CT-based and CBCT-based IMRT planning calculations on a humanoid phantom was found.
Supplementary Figures 1–4 and Table I
Download PDF (1.9 MB)Acknowledgements
Supported by CIRRO – The Lundbeck Foundation Center for Interventional Research in Radiation Oncology, the Danish Council for Strategic Research, the Danish Cancer Society, and a research grant from Varian Medical Systems, Palo Alto, CA, USA.
Declaration of interest: The authors report no conflicts of interest. The authors alone are responsible for the content and writing of the paper.
References
- Jaffray DA, Siewerdsen JH, Wong JW, Martinez AA. Flat-panel cone-beam computed tomography for image-guided radiation therapy. Int J Radiat Oncol Biol Phys 2002;53:1337–49.
- Ahmad R, Bondar L, Voet P, Mens JW, Quint S, Dhawtal G, et al. A margin-of-the-day online adaptive intensity- modulated radiotherapy strategy for cervical cancer provides superior treatment accuracy compared to clinically recommended margins: A dosimetric evaluation. Acta Oncol 2013; 52:1430–6.
- Gill S, Pham D, Dang K, Bressel M, Kron T, Siva S, et al. Plan of the day selection for online image-guided adaptive post-prostatectomy radiotherapy. Radiother Oncol 2013; 107:165–70.
- Vestergaard A, Søndergaard J, Petersen JB, Høyer M, Muren LP. A comparison of three different adaptive strategies in image-guided radiotherapy of bladder cancer. Acta Oncol 2010;49:1069–76.
- Vestergaard A, Muren LP, Sondergaard J, Elstrom UV, Hoyer M, Petersen JB. Adaptive plan selection vs. re-optimisation in radiotherapy for bladder cancer: A dose accumulation comparison. Radiother Oncol 2013;109:457–62.
- Schmidt ML, Hoffmann L, Kandi M, Moller DS, Poulsen PR. Dosimetric impact of respiratory motion, interfraction baseline shifts, and anatomical changes in radiotherapy of non-small cell lung cancer. Acta Oncol 2013;52:1490–6.
- Grau C, Hoyer M, Alber M, Overgaard J, Lindegaard JC, Muren LP. Biology-guided adaptive radiotherapy (BiGART)– more than a vision?Acta Oncol 2013;52:1243–7.
- Meijer GJ, Toorn Pvd, Bal M, Schuring D, Weterings J, Wildt Md. High precision bladder cancer irradiation by integrating a library planning procedure of six prospectively generated SIB IMRT plans with image guidance using lipiodol markers. Radiother Oncol 2012;105:174–9.
- Tuomikoski L, Korhonen J, Collan J, Keyriläinen J, Visapää H, Sairanen J, et al. Implementation of adaptive radiation therapy for urinary bladder carcinoma: Imaging, planning and image guidance. Acta Oncol 2013;52:1451–7.
- Schwartz DL, Garden AS, Shah SJ, Chronowski G, Sejpal S, Rosenthal DI, et al. Adaptive radiotherapy for head and neck cancer – Dosimetric results from a prospective clinical trial. Radiother Oncol 2013;106:80–4.
- Moller DS, Khalil AA, Knap MM, Hoffmann L. Adaptive radiotherapy of lung cancer patients with pleural effusion or atelectasis. Radiother Oncol 2013;110:517–22.
- Siewerdsen JH, Jaffray DA. Cone-beam computed tomography with a flat-panel imager: Magnitude and effects of x-ray scatter. Med Phys 2001;28:220–31.
- Battista JJ, Bronskill MJ. Compton scatter imaging of transverse sections: An overall appraisal and evaluation for radiotherapy planning. Phys Med Biol 1981;26:81–99.
- Mustafa AA, Jackson DF. The relation between X-ray CT numbers and charged particle stopping powers and its significance for radiotherapy treatment planning. Phys Med Biol 1983;28:169–76.
- Constantinou C, Harrington JC, DeWerd LA. An electron density calibration phantom for CT-based treatment planning computers. Med Phys 1992;19:325–7.
- Schneider U, Pedroni E, Lomax A. The calibration of CT Hounsfield units for radiotherapy treatment planning. Phys Med Biol 1996;41:111–24.
- Schaffner B, Pedroni E. The precision of proton range calculations in proton radiotherapy treatment planning: Experimental verification of the relation between CT-HU and proton stopping power. Phys Med Biol 1998;43:1579–92.
- Schneider W, Bortfeld T, Schlegel W. Correlation between CT numbers and tissue parameters needed for Monte Carlo simulations of clinical dose distributions. Phys Med Biol 2000;45:459–78.
- Yang Y, Schreibmann E, Li T, Wang C, Xing L. Evaluation of on-board kV cone beam CT (CBCT)-based dose calculation. Phys Med Biol 2007;52:685–705.
- Verhaegen F, Devic S. Sensitivity study for CT image use in Monte Carlo treatment planning. Phys Med Biol 2005;50: 937–46.
- Vanderstraeten B, Chin PW, Fix M, Leal A, Mora G, Reynaert N, et al. Conversion of CT numbers into tissue parameters for Monte Carlo dose calculations: A multi- centre study. Phys Med Biol 2007;52:539–62.
- Hatton J, McCurdy B, Greer PB. Cone beam computerized tomography: The effect of calibration of the Hounsfield unit number to electron density on dose calculation accuracy for adaptive radiation therapy. Phys Med Biol 2009;54: N329–46.
- Guan H, Dong H. Dose calculation accuracy using cone-beam CT (CBCT) for pelvic adaptive radiotherapy. Phys Med Biol 2009;54:6239–50.
- Rong Y, Smilowitz J, Tewatia D, Tome WA, Paliwal B. Dose calculation on kV cone beam CT images: An investigation of the Hu-density conversion stability and dose accuracy using the site-specific calibration. Med Dosim 2010;35: 195–207.
- Richter A, Hu Q, Steglich D, Baier K, Wilbert J, Guckenberger M, et al. Investigation of the usability of conebeam CT data sets for dose calculation. Radiat Oncol 2008;3:42.
- van Zijtveld M, Dirkx M, Heijmen B. Correction of conebeam CT values using a planning CT for derivation of the “dose of the day”. Radiother Oncol 2007;85:195–200.
- Fotina I, Hopfgartner J, Stock M, Steininger T, Lütgendorf-Caucig C, Georg D. Feasibility of CBCT-based dose calculation: Comparative analysis of HU adjustment techniques. Radiother Oncol 2012;104:249–56.
- Elstrøm UV, Wysocka BA, Muren LP, Petersen JBB, Grau C. Daily KV cone-beam CT and deformable image registration as a method for studying dosimetric consequences of anatomic changes in adaptive IMRT of head and neck cancer. Acta Oncol 2010;49:1101–8.
- Sun M, Star-Lack JM. Improved scatter correction using adaptive scatter kernel superposition. Phys Med Biol 2010; 55:6695–720.
- Elstrøm UV, Muren LP, Petersen JBB, Grau C. Evaluation of image quality for different kV cone-beam CT acquisition and reconstruction methods for the head and neck region. Acta Oncol 2011;50:908–17.
- Woodard HQ, White DR. The composition of body tissues. Br J Radiol 1986;59:1209–18.
- White DR, Woodard HQ, Hammond SM. Average soft-tissue and bone models for use in radiation dosimetry. Br J Radiol 1987;60:907–13.
- Low DA, Harms WB, Mutic S, Purdy JA. A technique for the quantitative evaluation of dose distributions. Med Phys 1998;25:656–61.
- Depuydt T, Van Esch A, Huyskens DP. A quantitative evaluation of IMRT dose distributions: Refinement and clinical assessment of the gamma evaluation. Radiother Oncol 2002;62:309–19.
- Wendling M, Zijp LJ, McDermott LN, Smit EJ, Sonke JJ, Mijnheer BJ, et al. A fast algorithm for gamma evaluation in 3D. Med Phys 2007;34:1647–54.
- Thor M, Petersen JB, Bentzen L, Hoyer M, Muren LP. Deformable image registration for contour propagation from CT to cone-beam CT scans in radiotherapy of prostate cancer. Acta Oncol 2011;50:918–25.
- Thörnqvist S, Petersen JB, Høyer M, Bentzen LN, Muren LP. Propagation of target and organ at risk contours in radiotherapy of prostate cancer using deformable image registration. Acta Oncol 2010;49:1023–32.