
Abstract
Background. In the context of dose painting by numbers delivered with intensity-modulated radiotherapy, the robustness of dose distributions against geometric uncertainties can be ensured by robust optimization. As robust optimization is seldom available in treatment planning systems (TPS), we propose an alternative method that reaches the same goal by modifying the heterogeneous dose prescription (based on 18FDG-PET) and guarantees coverage in spite of systematic and random errors with known standard deviations Σ and σ, respectively.
Material and methods. The objective was that 95% of all voxels in the GTVPET received at least 95% of the prescribed dose despite geometric errors. The prescription was modified by a geometric dilation of αΣ for systematic errors and a deconvolution by a Gaussian function of width σ for random errors. For a 90% confidence interval, α = 2.5. Planning was performed on a TomoTherapy system, such that 95% of the voxels received at least 95% of the modified prescription and less than 5% of the voxels received more than 105% of the modified prescription. The applicability of the method was illustrated for two head-and-neck tumors.
Results. Systematic and random displacements larger than αΣ and σ degraded coverage. Down to 62.8% of the points received at least 95% of prescribed dose for the largest considered displacements (5 mm systematic translation and 3 mm standard deviation for random errors). When systematic and random displacements were smaller than αΣ and σ, no degradation of target coverage was observed.
Conclusions. The method led to treatment plans with target coverage robust against geometric uncertainties without the need to incorporate these in the optimizer of the TPS. The methodology was illustrated for head-and-neck cancer but can be potentially extended to all treatment sites.
In the last decade, voxel by voxel heterogeneous dose prescription, also known as dose painting by numbers (DPBN) [Citation1], has gained interest in the radiotherapy community [Citation1–6]. A heterogeneous dose prescription within the tumor volume in accordance with a given tumor phenotype, instead of uniform dose, is expected to improve the treatment outcome in terms of local control and/or side effects [Citation1]. However, DPBN suffers from limitations that fall into three categories: 1) biological relevance and soundness of the heterogeneous prescription, based for instance on functional imaging like positron emission tomography (PET); 2) ability of the treatment delivery method to match the prescription with an actual dose distribution; 3) geometric uncertainties in the broad sense (patient setup, tumor motion, etc).
At the moment, the first point has not been completely addressed and important questions are still raised in the literature [Citation1–5]. As in Witte et al. [Citation6], we assume that a prescription may be derived from PET images and needs to be delivered with minimal, controlled distortion.
Regarding the second issue, several groups have already established the technical feasibility of DPBN prescriptions for advanced treatments modalities (VMAT, TomoTherapy) using structure-based treatment planning systems [Citation7,Citation8]. In such systems, it is possible to closely approximate DPBN using a sufficient number of sub-contours within the volume of interest.
However, the literature is sparse regarding the inclusion of patient-related geometric errors. Usual margin recipes are valid for one or several uniform dose prescriptions [Citation9], but not for DPBN.
In this study, we assume a non-uniform dose escalation in the tumor volume (the GTV). The objective is to find a methodology such that planned dose distributions are robust against geometric errors. In Witte et al. [Citation6], geometric uncertainties are directly taken into account during the dose optimization process. This approach is termed ‘robust optimization’ and has been implemented by several groups for uniform prescriptions [Citation10–13]. However, such robust optimization techniques are rarely available in commercial TPSs.
Illustrated with two head-and-neck cases, this study proposes a methodology that provides robust DPBN treatment plans, without specific optimization algorithms in the TPS. Our methodology has therefore the potential to popularize robust DPBN. It accounts for geometric uncertainties by appropriately modifying the heterogeneous prescription. Although the chosen treatment modality is TomoTherapy, the methodology also applies to any other treatment modality relying on photon beams, provided that geometric errors do not exceed certain limits that are discussed further below and also that the treatment modality can accurately deliver heterogeneous prescriptions like those encountered in DPBN.
Material and methods
Consider a volume candidate to DPBN (the GTV) with a prescription Dp(r) defined in all points r of the CT geometry. The proposed workflow to deal with geometric uncertainties is illustrated in of Supplementary Appendix 1 ‘Mathematical formalism of the robust prescription’ (available online at http://informahealthcare.com/doi/abs/10.3109/0284186X.2014.930171). The method consists in calculating a modified prescription DRp(r), where RP stands for robust prescription, such that the planned dose distribution DPlanning(r) is consistent with the original prescription Dp(r) and robust against geometric errors, with regards to target coverage.
Quantification of treatment planning quality for non-uniform dose prescriptions
For the volume candidate to DPBN, treatment- planning quality is quantified using the decumulative quality-volume histogram (QVH) introduced by Vanderstraeten et al. [Citation2], where the quality is defined in every voxel as the ratio of the planned dose to the prescribed dose.
For the TomoTherapy system, Deveau et al. [Citation7] showed that the following quality criteria should be achievable using appropriate planning parameters: 1) more than 95% of the points receive at least 95% of the local prescription [(VQ = 0.95)Planning ≥ 95%]; 2) less than 5% of the points receive more than 105% of the local prescription [(VQ = 1.05)Planning ≤ 5%]; and 3) the mean quality value (Qmean)Planning is close to 1 within 1%. The subscript ‘Planning’ indicates that the metric quantifies the TPS ability to reproduce the prescription.
Robust prescription
Like in Witte et al. [Citation6], a plan is considered to be robust when the planned dose is superior or equal to the prescribed dose in all points of the GTV within a certain tolerance (tumor coverage objective), in spite of geometric errors. Considering our planning objective [(VQ = 0.95)Planning ≥ 95%], this amounts to requiring that (VQ = 0.95)(αΣ,σ) ≥ 95%, i.e. robustness against systematic shifts of ±αΣ and random shifts with standard deviation σ (see [Citation9] and Supplementary Appendix 1 available online at http://informahealthcare.com/doi/abs/10.3109/0284186X.2014.930171). As ensuring robustness of tumor coverage necessarily entails excess dose, the criterion (VQ = 1.05)(αΣ,σ) ≤ 5% no longer applies.
The methodology proposed in this study relies on the hypothesis of local shift invariance of the dose distributions, which is generally accepted for external photon therapy [Citation9,Citation14]. The presented methodology aims at satisfying (VQ = 0.95)(αΣ,σ) ≥ (VQ = 0.95)Planning ≥ 95%.
Robustness against systematic errors within a 90% confidence interval is ensured by dilating the original prescription Dp(r) by an ellipsoid with vector radius αΣ (α = 2.5). A PTVPET is subsequently defined as the GTVPET plus a margin of αΣ. For the random errors, the dilated prescription is deconvolved with a Gaussian function (zero mean and standard deviation σ), which corresponds to the assumed distribution of random errors. An exact solution to the deconvolution problem exists only if the prescription is the result of a convolution with a similar Gaussian function having a width greater or equal to σ. Due to various physical limitations, PET images may fulfill this requirement. In particular, their rather poor resolution is often approximately characterized with a Gaussian point-spread function.
Dilation is carried out prior to deconvolution. The order of these two operations is important to properly counteract the effect of random errors on the planned dose distributions (blurring does not have the same effect depending on whether the dose distributions reproduce original or dilated prescriptions). The effects of the aforementioned operations on the prescription are illustrated on a clinical case in Supplementary Appendix 2 (available online at http://informahealthcare.com/doi/abs/10.3109/0284186X.2014.930171) ‘Illustrations of original, dilated and robust prescriptions on CT geometries’ (available online at http://informahealthcare.com/doi/abs/10.3109/0284186X).
Preparation and execution of treatment planning tests
The proposed robust method was tested on two consecutive patients treated for locally advanced head-and-neck squamous cell carcinoma using a simultaneous integrated boost protocol (SIB). The prophylactic and the therapeutic PTVs were created from the CTV delineated on the planning CT according to published guidelines [Citation15–17] and expanded by a 4 mm margin using a generic margin recipe [Citation9]. For prophylactic and therapeutic PTVs, uniform doses of 56 and 70 Gy were prescribed, respectively.
The volume subject to DPBN (the GTVPET) was automatically segmented on FDG-PET images with the gradient-based method previously implemented and validated by our group [Citation18]. The subscript PET indicates that the external contour of the GTVPET stems from the FDG-PET image. The FDG-PET images were acquired with a Philips Gemini PET-CT camera; the point-spread function was approximately Gaussian, with a FWHM of 7.5 mm, corresponding to a standard deviation of 3.2 mm. This gives the theoretical assurance that PET images from this camera may be deconvolved with a Gaussian function having a standard deviation up to 3.2 mm. Accurate dilation was guaranteed by resampling the PET images to 1 mm3 voxels with trilinear interpolation. Dilation itself used a nearest neighbor interpolator, leading to an accuracy of 0.5 mm. The validity of the present method does not depend on any particular segmentation method, provided the image may be deconvolved.
Consistently with Vanderstraeten et al. [Citation2] and Witte et al. [Citation6], the FDG uptake was converted linearly to a non-uniform dose-escalation from 70 (minimal uptake) to 86 Gy (maximal uptake).
Treatment planning was performed on a TomoTherapy TPS with a GPU architecture, whose accuracy is comparable to the extensively validated CPU algorithm [Citation19–21]. Unless otherwise mentioned, the TPS parameterization of Deveau et al. [Citation7] was followed (slice width of 1 cm; modulation factor of 3.0; and pitch of 0.43). The dose calculation grid was set in “fine” mode (about 2 × 2× 2 mm3 resolution).
Except for the boost volume (PTVPET), the clinical constraints were D95 ≥ 95% for target volumes, Dmean inferior to 30 and 26 Gy for ipsilateral and contralateral parotids, respectively, and D2 inferior to 35 Gy for the spinal cord extended with a 5 mm margin.
The PTVPET was divided into seven equally spaced sub-contours to approximate the DPBN prescription. For each volume enclosed in the ith sub-contour (i going from 1 to 7), the minimum dose constraint equaled Gy and the maximum
. Another constraint was that Dmean between contours i and i + 1 equaled the average of the minimum and maximum constraints. For the last contours, the maximum dose constraint equaled (DRP)max.
Evaluation of the robustness of the non-uniform dose distributions to geometric displacements
reports four couples of (αΣ, σ) values used to compute the robust prescriptions DRP. For all cases, Σx = Σy = Σz = Σ and σx = σy = σz = σ.
Table I. Details of the systematic and random standard deviations values used for each patient included in this study.
The robustness of the dose distributions was evaluated by: 1) shifting the dose distributions by a displacement T in six directions (left, right, anterior, posterior, superior, and inferior); and 2) blurring the dose distributions with a Gaussian distribution with standard deviation σd. Subscript d was used to distinguish σd from σ used to compute the robust prescription. Symbols (T, σd) denoted the values of the displacements. Random ones were limited to σd lower or equal to 3 mm, thus lower than the resolution of the PET camera (3.2 mm standard deviation). Two sets of robustness tests were considered.
First, three scenarios evaluated tumor coverage for each patient. The associated values of (T, σd) are detailed in . The three scenarios can be met in, respectively: 1) head-and-neck treatments using the best imaging tools available [Citation22]; 2) thoracic treatments with baseline shift correction [Citation23]; and 3) the idealized case of random errors only. To enhance readability of the results, only the scenarios involving displacements (T, σd) larger than or equal to (αΣ, σ) were considered.
In the second set of tests, the robustness was more finely tested for DRP prepared with (αΣ, σ) = (2.5 mm, 1 mm). Translations of 2.5, 3.12, 3.75, 4.37 and 5 mm were applied (which corresponds to values of Σ of 1, 1.25, 1.5, 1.75 and 2 mm, respectively). Random errors σd were kept at 1 mm. Ideally, the plan should be robust to displacements of maximum (2.5 mm, 1 mm).
Results
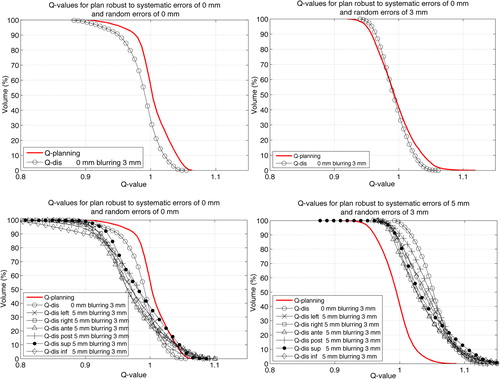
For the first set of tests, constraints on organs at risk were easily met for each pair (αΣ, σ) (see ). shows examples of QVHs for patient 1 for shifted and blurred DPlanning with respect to DP within GTVPET, for the scenarios detailed in . We focus on a possible crossing of the curves corresponding to each scenario and the one named Qplanning at VQ = 0.95, which is the threshold the robust prescription method aims at. When translations T exceed αΣ, there is always at least one translation direction for which (VQ = 0.95)(T, σd) is lower than the value of (VQ = 0.95)Planning that was obtained to quantify treatment planning quality and listed in . However, (VQ = 0.95)(T, σd) is superior to the value of (VQ = 0.95)Planning that was obtained to quantify treatment planning quality when translations T are smaller than αΣ.
Table II. Quantification of treatment planning quality using (VQ = 0.95)Planning and (VQ = 1.05)Planning computed within PTVPET for Dplanning with respect to DRP.
The only case where random errors do impact robustness of treatment planning by more than 1% [(VQ = 0.95)(T, σd)] is for a random error with 3 mm of standard deviation and no systematic error. In and , target coverage is preserved when σ = 3 mm, whereas the QVH is shifted towards lower values when σ = 0 mm. Moreover, there is no significant excess dose to the GTVPET observed if no systematic translation occurs (VQ = 1.05)(T, σd) [≤ 5% in GTVPET for (T, αd) = (0 mm, 3 mm)].
As the margin was used for systematic errors, excess dose was inherently planned to the GTVPET as soon as αΣ departed from zero. For (αΣ, σ) of (5 mm, 3 mm), (VQ = 1.05)(T, σd) reached a maximum of 53%.
These observations are confirmed quantitatively for both patients in .
Table III. Treatment planning robustness for various scenarios and robust prescriptions using (VQ = 0.95)(T,σd) computed within GTVPET for DPlanning with respect to DP.
reports the results of the second set of tests, where (αΣ, σ) is fixed to (2.5 mm,1 mm). For systematic displacements larger than twice αΣ, target coverage is clearly degraded, down to 94.5% and 92.2% for patients 1 and 2, respectively. However, target coverage is preserved for translations up to 3.75 and 3.12 mm for patients 1 and 2, respectively.
Table IV. Quantification of treatment planning robustness for a specific robust prescription using (VQ = 0.95)(T, σd) computed within GTVPET for DPlanning with respect to DP.
Discussion
Overall, the results shown in confirmed the ability of TomoTherapy to closely approximate voxel by voxel prescriptions, following similar guidelines as those proposed by Deveau et al. [Citation7]. Despite our efforts during planning, we could not perfectly satisfy (VQ = 0.95)Planning ≥ 95% and (VQ = 1.05)Planning ≤ 5% for (αΣ, σ) of (5 mm, 3 mm) in patient 2. The likely cause is deconvolution, which sharpens the transition between dose levels and thus complicates the task of the TPS to match the prescription (limitation by the finite penumbra [Citation24]). The deconvolution process increases the dose gradient and thus the difficulty in matching the prescription.
Results shown in and demonstrate that the objective of robustness is achieved for values of T and σd both lower than or equaling αΣ and σ. The effect of random errors is far less important than that of systematic errors. Only the case of (T, σd) of (0 mm, 3 mm) applied to plans computed with (αΣ, σ) = (0 mm, 0 mm) degraded target coverage () beyond 1%. However, the methodology proved to enhance target coverage when accounting for random errors implicitly in the prescription. No degradation was observed for (VQ = 0.95)(T, σd) for (T, σd) of (0 mm, 3 mm) applied to plans set up with (αΣ, σ) = (0 mm, 3 mm) for both patients. When considering only random errors, no excess dose was observed either, as shown in . This was expected since only the shape of the prescription is modified during the convolution. Moreover, the deconvolution process has the advantage that it does not require an a priori knowledge of the dose distribution (compared to the margin added for random errors in the case of homogeneous dose distributions, which assume spherical symmetry, perfect conformation and Gaussian penumbra [Citation9]). Notice, however, that the deconvolution is an ill-posed problem and the exact solution of the deconvolution problem might not exist. This would occur if σ were larger than the resolution of the PET images. As the correspondence between prescription (robust or not) and planning quality does not need to be strict, an approximate solution to deconvolution might still lead to dose distributions that satisfy (VQ = 0.95)(T, σd) ≥ (VQ = 0.95)Planning ≥ 95% without any unnecessary excess dose. This is performed in algorithms implementing robust optimization, which actually do attempt to solve implicitly a deconvolution problem using an iterative approach but during the dose optimization process. The validity of the present method for prescriptions and values of σ larger than the resolution of the PET images requires further investigation. In this case, another approach might be necessary that still circumvents robust optimization of the planned dose. This approach could actually involve robust optimization of the prescription, with a model accounting for random errors. The objectives of the optimization process would then be: 1) coverage of the (dilated) prescription; and 2) minimization of the excess dose to the GTVPET.
To reach robustness in spite of systematic errors, some excess dose must be delivered but should be kept as low as possible. Considering the isotropic expansion used for the clinical examples, the dose in the dilated prescription at every point equals the maximum dose in the original prescription within a sphere of radius αΣ around the considered point. Assuming that the TPS can match with comparable accuracy the original and dilated prescriptions, this process necessarily ensures that target coverage for systematic displacements of T = αΣ will be better than or equal to target coverage achieved during treatment planning (provided that the dose distributions are shift-invariant). This approach is conservative. For instance, points that are not displaced towards the edge of the dilated boost volume (the PTVPET) but rather towards a hot spot get moved to higher dose regions on average. This phenomenon combined to the fact that the planned dose is not perfectly conformal [(VQ = 1.05)Planning equals 2.8 and 3.0 % for patients 1 and 2, respectively] may explain the good coverage obtained for values of T slightly exceeding αΣ (). For both patients, coverage starts to degrade from 3.75Σ, thus a confidence interval of more than 99%.
A dilation of αΣ is also extremely conservative if we consider a dose tolerance of, i.e. 5% at every point. In such case, the dilation of αΣ could be reduced by the distance between any point in the heterogeneous prescription and the closest point that has a 5% lower prescription. This would allow for a flexible margin from zero to αΣ, depending on the local gradient in the prescription (a large gradient leads to a larger margin). However, such strategy potentially violates the condition (VQ = 0.95)(αΣ, σ) ≥ (VQ = 0.95)Planning and was not considered in the present study.
To further evaluate the efficiency of the robust prescription method to avoid unnecessary excess dose, let us compare our results to a robust optimization option as implemented by Witte et al. [Citation6], who use robust optimization. For (αΣ, σ) = (5 mm, 3 mm), (VQ = 1.05)(T, σd) may reach 53%. The prescription range for the head-and-neck case in Witte et al. (70–85 Gy) is similar to the one used here, allowing for a fair comparison, at least to some extent (the acceptability criterion of Witte et al. is different since 99% of the points must receive more than 95% of the dose). At (VQ = 1.05)(T, σd) the excess dose in absolute values is within 3.5–4.3 Gy (5% of prescribed dose ranging from 70 to 86 Gy). This conversion to absolute dose values is necessary to compare with Witte et al. who use ΔVH to assess treatment planning quality. Using a 90% confidence interval and hence assuming (αΣ, σ) = (6.25 mm, 2.5 mm), Witte et al. report an excess dose of 4 Gy within, roughly, 30 up to almost 70% of the GTV, thus comparable to the 53% achieved in the present study.
As one of its main advantages, robust optimization can potentially take into account modifications of the dose distributions caused by geometric errors. The hypothesis of shift invariance of the dose distributions is common in the computation of safety margins for homogeneous distributions. Witte et al. [Citation6] also rely on this hypothesis to implement robust optimization. Nevertheless, significant modifications of the dose distributions because of geometrical shifts of the patient have been reported [Citation25]. Dose distributions sensitive to patient shifts should therefore be recomputed during robust optimization to comprehensively address the problem of geometric uncertainties in DPBN, especially for large geometric errors.
At the present time, a formal validation of our methodology requires more patient cases as well as other target locations than head-and-neck. This study aimed to demonstrate that, under some reasonable hypotheses, robust DPBN treatments can be planned without robust optimization techniques. The proposed method yields satisfactory results in terms of target coverage and limited excess dose to the GTVPET. It proceeds by modifying the dose prescription, using first dilation to compensate for systematic errors and then deconvolution for random errors. The latter operation remains formally valid for random errors smaller than the resolution of the PET images. Random deviations of about 1 mm did not show any significant impact based on the considered cases. In contrast, systematic errors have a much stronger impact but they can be taken into account quite easily without robust optimization. Future investigations aim at applying our approach to other target locations than head-and-neck and also to larger random errors.
Supplementary material available online
ionc_a_930171_sm8224.pdf
Download PDF (2.6 MB)Acknowledgements
The medical and physics teams of the radiotherapy department of Cliniques Universitaires Saint-Luc are acknowledged for their precious help. Sarah Differding is a PhD student supported by a grant T l vie from the Belgian “Fonds National pour la Recherche Scientifique’ (Grant T l vie-FC 92318-n°7460113F)”. J. A. Lee is a Research Associate of the Belgian ‘Fonds National pour la Recherche Scientifique’ (Research Associate-FC 63880)”.
Declaration of interest: The authors report no conflicts of interest. The authors alone are responsible for the content and writing of the paper.
References
- Bentzen SM. Theragnostic imaging for radiation oncology: Dose-painting by numbers. Lancet Oncol 2005;6:112–7.
- Vanderstraeten B, Duthoy W, De Gersem W, De Neve W, Thierens H.[18F]fluoro-deoxy-glucose positron emission tomography ([18F]FDG-PET) voxel intensity-based intensity-modulated radiation therapy (IMRT) for head-and-neck cancer. Radiother Oncol 2006;79:249–58.
- Christian N, Lee JA, Bol A, De Bast M, Jordan B, Grégoire V. The limitation of PET imaging for biological adaptive-IMRT assessed in animal models. Radiother Oncol 2009;91:101–6.
- Tanderup K, Olsen DR, Grau C. Dose painting: Art or science?Radiother Oncol 2006;79:245–8.
- Aerts HJWL, Lambin P, Ruysscher DD. FDG for dose painting: A rational choice. Radiother Oncol 2010;97:163–4.
- Witte M, Shakirin G, Houweling A, Peulen H, van Herk M. Dealing with geometric uncertainties in dose painting by numbers: Introducing the ΔVH. Radiother Oncol 2011; 100:402–6.
- Deveau MA, Bowen SR, Westerly DC, Jeraj R. Feasibility and sensitivity study of helical tomotherapy for dose painting plans. Acta Oncol 2010;49:991–6.
- Korreman SS, Ulrich S, Bowen S, Deveau M, Bentzen SM, Jeraj R. Feasibility of dose painting using volumetric modulated arc optimization and delivery. Acta Oncol 2010;49: 964–71.
- van Herk M, Remeijer P, Rasch C, Lebesque JV. The probability of correct target dosage: Dose-population histograms for deriving treatment margins in radiotherapy. Int J Radiat Oncol Biol Phys 2000;47:1121–35.
- Unkelbach J, Oelfke U. Inclusion of organ movements in IMRT treatment planning via inverse planning based on probability distributions. Phys Med Biol 2004;49:4005–29.
- McShan DL, Kessler ML, Vineberg K, Fraass BA. Inverse plan optimization accounting for random geometric uncertainties with a multiple instance geometry approximation (MIGA). Med Phys 2006;33:1510–21.
- Witte MG, van der Geer J, Schneider C, Lebesque JV, Alber M, van Herk M. IMRT optimization including random and systematic geometric errors based on the expectation of TCP and NTCP. Med Phys 2007;34:3544–55.
- Gordon JJ, Sayah N, Weiss E, Siebers JV. Coverage optimized planning: Probabilistic treatment planning based on dose coverage histogram criteria. Med Phys 2010;37:550–63.
- Mexner V, Wolthaus JWH, van Herk M, Damen EMF, Sonke J-J. Effects of respiration-induced density variations on dose distributions in radiotherapy of lung cancer. Int J Radiat Oncol Biol Phys 2009;74:1266–75.
- Grégoire V, Coche E, Cosnard G, Hamoir M, Reychler H. Selection and delineation of lymph node target volumes in head and neck conformal radiotherapy. Proposal for standardizing terminology and procedure based on the surgical experience. Radiother Oncol 2000;56:135–50.
- Grégoire V, Levendag P, Ang KK, Bernier J, Braaksma M, Budach V, et al. CT-based delineation of lymph node levels and related CTVs in the node-negative neck: DAHANCA, EORTC, GORTEC, NCIC, RTOG consensus guidelines. Radiother Oncol 2003;69:227–36.
- Grégoire V, Eisbruch A, Hamoir M, Levendag P. Proposal for the delineation of the nodal CTV in the node-positive and the post-operative neck. Radiother Oncol 2006;79: 15–20.
- Geets X, Lee J a, Bol A, Lonneux M, Grégoire V. A gradient-based method for segmenting FDG-PET images: Methodology and validation. Eur J Nucl Med 2007;34: 1427–38.
- Chen Q, Lu W, Chen Y, Chen M, Henderson D, Sterpin E. Validation of GPU based TomoTherapy dose calculation engine. Med Phys 2012;39:1877–86.
- Sterpin E, Salvat F, Olivera GH, Vynckier S. Monte Carlo evaluation of the convolution/superposition algorithm of Hi-ArtTM Tomotherapy in heterogeneous phantoms and clinical cases. Med Phys 2009;36:1566–75
- Sterpin E, Tomsej M, Cravens B, Salvat F, Ruchala K, Olivera GH, et al. Monte Carlo simulation of the Tomotherapy treatment unit in the static mode using MC HAMMER, a Monte Carlo tool dedicated to Tomotherapy. J Phys: Confer Ser 2007;74:021019.
- Boswell S, Tome W, Jeraj R, Jaradat H, Mackie TR. Automatic registration of megavoltage to kilovoltage CT images in helical tomotherapy: An evaluation of the setup verification process for the special case of a rigid head phantom. Med Phys 2006;33:4395–404.
- Wolthaus JWH, Sonke J-J, van Herk M, Belderbos JS, Rossi MMG, Lebesque JV, et al. Comparison of different strategies to use four-dimensional computed tomography in treatment planning for lung cancer patients. Int J Radiat Oncol Biol Phys 2008;70:1229–38.
- Sterpin E, Chen Y, Lu W, Mackie TR, Olivera GH, Vynckier S. On the relationships between electron spot size, focal spot size, and virtual source position in Monte Carlo simulations. Med Phys 2011;38:1579–86.
- McShan DL, Kessler ML, Vineberg K, Fraass B. Inverse plan optimization accounting for random geometric uncertainties with a multiple instance geometry approximation (MIGA). Med Phys 2006;33:1510–21.