
Abstract
Background. To assess the value of combined T2-weighted magnetic resonance imaging (MRI) (T2w) volumetry, diffusion-weighted (DW)-MRI and dynamic contrast enhanced (DCE)-MRI for pathological response prediction after neo-adjuvant chemoradiation (CRT) in locally advanced rectal cancer (LARC).
Material and methods. MRI with DW-MRI and DCE-MRI sequences was performed before start of CRT and before surgery. After surgery, the tumor regression grade (TRG) was obtained based on the score by Mandard et al. Pathological complete responders (pCR, TRG 1), and pathological good responders (GR, TRG 1 + 2) were compared to non-pCR and non-GR patients, respectively.
Results. In total 55 patients were analyzed, six had a pCR (10.9%) and 10 a GR (18.2%). Favorable responders had a larger decrease in tumor volume and Ktrans and a larger increase in apparent diffusion coefficient (ADC) values compared to non-responders. ADC change showed the best diagnostic accuracy for pCR. For GR, the model including ADC change and volume change showed the best diagnostic performance. However, this performance was not statistically better compared to the model with ADC change alone. Inclusion of Ktrans change did not increase the diagnostic accuracy for pathological favorable response.
Conclusions. This explorative study showed that ADC change is a promising diagnostic tool for pCR and GR. Volume decrease showed potential limited additional diagnostic value for GR while Ktrans change showed no additional diagnostic value for pCR and GR.
The standard of care treatment for locally advanced rectal cancer (LARC) is neo-adjuvant chemoradiation (CRT) followed by total mesorectal excision surgery [Citation1]. After neo-adjuvant therapy approximately 15% of patients reach a pathological complete response (pCR) which is the state without vital tumor on histological examination [Citation2]. The lack of tumor in these resection specimens questioned the additional value of radical resection in good responders after neo-adjuvant treatment and led to the introduction of organ sparing treatment strategies [Citation3,Citation4]. A major challenge for these strategies is the selection of patients suitable for an organ sparing approach. Ideally, techniques for the selection of patients for this approach need to be accurate for the pathological response after neo-adjuvant therapy to prevent undertreatment of patients.
Magnetic resonance imaging (MRI) is standard of care for staging and re-staging of rectal cancer. In multiple studies it was shown that T2-weighted (T2w) MRI tumor volume reduction was predictive for pathological response after neo-adjuvant therapy [Citation5–8]. Besides, also several studies showed that functional MR imaging is helpful for response prediction after neo-adjuvant therapy. Diffusion-weighted (DW)-MRI and dynamic contrast enhanced (DCE)-MRI both showed promising results regarding response prediction after CRT in LARC. Both functional imaging techniques assess different aspects of the tissue. DW-MRI with the apparent diffusion coefficient (ADC) assesses the impedance of water molecules diffusion which is most dependent on the tissue cellularity [Citation9]. DCE-MRI, however, measures a volume transfer constant (Ktrans) which is dependent on the perfusion and the permeability of the tumor vasculature [Citation10]. Both the ADC and Ktrans change after neo-adjuvant therapy were correlated with pathological favorable response in previous studies [Citation11–17].
In this study, we assessed the diagnostic value of combined T2w-MRI volumetry, DW-MRI and DCE-MRI for pathological response after neo-adjuvant CRT in patients with LARC.
Material and methods
We prospectively included patients from December 2008 to March 2012 after obtaining informed consent. The inclusion criteria were a histologically proven locally advanced rectal adenocarcinoma eligible for treatment with neo-adjuvant CRT followed by resection. Locally advanced tumors were tumors with close distance or invasion of the mesorectal fascia and/or > 3 pathological locoregional lymph nodes. Patients with contra-indications for MRI were excluded. The study was approved by the institutional review board of our center.
Treatment
Neo-adjuvant CRT treatment was standard of care treatment. A total radiation dose of 50 Gy, in 25 daily fractions of 2 Gy was delivered over a period of five weeks. The radiotherapy was combined with twice daily oral 5-FU (capecitabine). The CRT was followed by surgery 7–10 weeks after the end of the CRT and was performed by surgeons trained in colorectal oncological surgery.
Magnetic resonance imaging
Before the start of CRT and a week before surgery, an MRI with transverse and sagittal T2w, transverse DW-MRI and transverse DCE-MRI sequences on a 3-Tesla MR (AchievaTX, Philips Medical Systems, Best, The Netherlands) was performed. A phased array 32-element coil was used as receiver coil. All scans were performed in supine position on a flat tabletop without specific bowel preparation. The T2w sequence was a Turbo Spin Echo (TSE) sequence (TR/TE, 5632/120 ms; acquired resolution 0.45 × 0.45 mm2, slice thickness 3.0 mm). Diffusion weighting was achieved by using a single-shot Spin-Echo Echo Planar Imaging (ssSE-EPI) sequence (TR/TE: 7600 ms/63 ms; EPI factor: 63), with spectral attenuated inversion-recovery (SPAIR) fat suppression and isotropic diffusion weighting in three directions with b-values: 0, 200, 800 s/mm2. Images were acquired with a resolution of 2.5 × 2.5 mm2, slice thickness was 4.0 mm and the number of averages was three. The DCE-MRI protocol consisted of three-dimensional (3D) spoiled gradient echo sequence (TR/TE, 4/1 ms; acquired resolution 2.5 × 2.5 × 4.0 mm3; acquisition matrix, 144 × 132× 20; flip angle 8°). Scans were repeated 120 times at 2.4 s interval. A concentration of 0.1 ml/kg of Gadobutrol (1.0 M) (Gadovist, Schering AG, Berlin, Germany) contrast was injected with 2 ml/s using an automatic power injector, followed by a saline flush. The total examination time including patient preparation was approximately 35 minutes.
Data processing
Using in-house developed software ADC-maps were generated from the diffusion weighted images with b-values of 0, 200, and 800 s/mm2. A linear regression after a logarithmic transformation of the signal intensity (lnS) was used to calculate the ADC values ln(S) = ln(A)-b.ADC, where A is the relative amplitude. For perfusion assessment, contrast-enhanced time series were converted to concentration time series using in-housed developed software. Subsequently, the generalized kinetic model by Tofts et al. was fitted to the concentration time series using a generic, patient averaged, arterial input function (AIF) [Citation10]. The generic AIF was obtained using phase-based measurements from the femoral arteries using the method described by Korporaal et al. [Citation18]. Due to the extent of measurement errors on the patient-specific input functions causing non-significant different AIF between patients a generalized AIF was used as described in earlier publications [Citation19,Citation20]. This resulted in 3D maps of Ktrans.
Data analyses
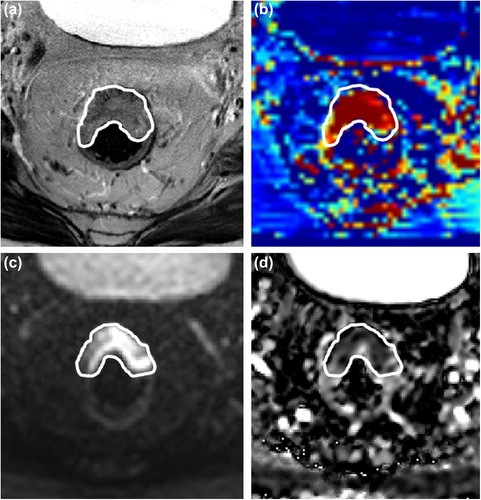
Tumor delineation was performed by a single expert observer using the in-house developed image analysis package Volumetool [Citation21]. The tumors were delineated as a volume of interest (VOI) on the high b-value DWI-MR image and on the T2w-MRI before and after neo-adjuvant therapy. In cases where no residual tumor was identified after therapy, the VOI was drawn in the apparent tumor bed. The tumor delineated on the T2w-MRI was automatically transferred to the corresponding K-trans map and the VOI on the high b-value image to the ADC map (). Corresponding ADC values and Ktrans values of the VOI were extracted from the ADC and Ktrans maps using Matlab (Matlab, version 7.14.0.739, The Mathworks Inc, USA). Based on the pre- and post-CRT T2w tumor volumes, ADC values and Ktrans values the relative change in these parameters was calculated. These relative changes are shown as ∆Volume, ∆ADC and ∆Ktrans, respectively.
Figure 1. cT3N2 rectal adenocarcinoma in a 60-year-old male patient. T2-weighted imaging (a), Ktrans map (b), b800 image (c) and apparent diffusion coefficient map (d).
Pathology
After surgery the resection specimens were evaluated by pathologists specialized in gastrointestinal oncological pathology. Besides standard protocolized macroscopic and microscopic assessments of the resection specimen also tumor regression grade (TRG) analysis was performed [Citation22]. For data analyses, patients were grouped according to the pathological response based on the TRG described by Mandard et al. [Citation23]. Patients classified as pathological complete responders (pCR, TRG 1) were compared with patients without pCR (TRG > 1, non-pCR). Patients with pCR or solitary tumor cells in the resection specimen (TRG 1 + 2) were classified as good responders (GR) and compared with partial and poor responding patients (non-GR).
Statistics
The diagnostic value for pCR and GR of ∆Volume, ∆ADC and ∆Ktrans and their combinations were assessed with logistic regression analysis using Firth bias-correction [Citation24]. Correlations between the ∆Volume, ∆ADC and ∆Ktrans were calculated using the Pearson's correlation coefficient. Receiver operating characteristic (ROC) analysis was applied and the area under the ROC curve (AUC) was obtained. ROC curves were compared using the method described by Hanley and McNeil [Citation25]. Calibration of the models was determined by comparing predicted probabilities of response and observed probabilities using a calibration plot. Calibration was also assessed by performing the Hosmer-Lemeshow test. The cut-off values for calculating diagnostic accuracy for the various models was the value with the highest positive likelihood ratio [LR+, sensitivity/(1-specificity)] for favorable response. Accuracy was calculated to assess the discriminative performance of the models, i.e. the ability of the model to distinguish responders and non-responders. The percent of patients accurately classified was compared between models using the McNemar’s test. Statistical analyses were performed using SPSS version 20.0.0, SAS version 9.4, and GraphPad Prism version 6.04.
Results
Patient characteristics
A total of 63 patients were included in the study. Eight patients were excluded from analyses due to refusal of surgery after neo-adjuvant treatment (n = 2), contrast agent intolerance (n = 1), mucinous tumor at pathology (n = 1) or severe imaging artifacts hampering analysis (n = 4). This resulted in 55 patients available for analyses. The pCR group consisted of six patients (10.9%) and the GR group of 10 patients (18.2%).
Univariate analyses
After CRT, pathological favorable responders showed a larger increase in ADC and a larger decrease in tumor volume and Ktrans (). Correlation tests showed a weak negative correlation (Pearson's correlation coefficient −0.41, p = 0.02) between the ∆ADC and ∆Ktrans. No correlations existed between the other variables. ROC analyses showed the best discriminative value for pathological favorable response with ∆ADC in both response analyses. An optimal ∆ADC threshold for both pCR and GR was found of 43%. The sensitivity, specificity, positive predictive value (PPV) and negative predictive value (NPV) for prediction of pCR were 83%, 96%, 71% and 98%, respectively (). For GR, these values were 80%, 98%, 89% and 96%, respectively (). The area under the ROC curves for ∆ADC was 0.93 for pCR and 0.97 for GR.
Table I. Comparison of response groups.
Table II. Classification tables for the diagnosis of pathological complete response (pCR).
Table III. Classification tables for the diagnosis of pathological good response (GR).
Multivariable analyses
The ∆volume, ∆ADC and ∆Ktrans were combined in a multivariate diagnostic model for pCR and GR. The Hosmer-Lemeshow test showed a non-significant result in all models which shows a good model fit. For pCR, the model with ∆ADC alone showed the highest diagnostic accuracy (, ). For GR, the full model with all three parameters and the model with the ∆ADC and the ∆Volume combined performed best, both on discriminating GR form non-GR and on calibration (, ). As both models performed equivalent the model with the lowest number of parameters, the combined ∆ADC and ∆Volume model, was best. This model showed better accuracy compared to the single parameter ∆ADC model, however this difference was not statistically significant.
Comparison of ROC curves
ROC curves for the individual parameters and the models are shown in . There was no significant difference between the ROC curves for the single parameter and multiparameter prediction models for pCR. For GR the relative volume difference performed inferiorly to the combined ∆ADC and ∆Volume model and the model with three parameters. All other ROC curves for GR were not significantly different.
Discussion
This explorative study showed good diagnostic performance of functional MR imaging for favorable pathological response after neo-adjuvant CRT in LARC. ∆ADC appeared the parameter with the best diagnostic performance for pCR and GR. For GR addition of volume decrease showed a potential advantage to ∆ADC alone, but this was not statistically significant. The addition of ∆Ktrans did not increase the diagnostic value in both response groups.
This is one of the first studies to combine functional MR techniques for pathological response assessment after neo-adjuvant CRT in rectal cancer. Single technique studies already showed good response prediction accuracy for functional MRI [Citation11,Citation13,Citation15,Citation26]. For DW-MRI for pCR a sensitivity, specificity and PPV was found of 83%, 96% and 71%, respectively. The optimal cut-off value to distinct pCR from non-pCR was 43% ADC increase. These values were in accordance with previous DW-MRI response prediction studies. These studies reported sensitivity, specificity and PPV of 83–100%, 70–93% and 37–91% by cut-off values between 30% and 48% ADC increase [Citation11,Citation14,Citation15,Citation27]. The experience with DCE-MR for response prediction in rectal cancer is more limited. In the present study, the sensitivity for pCR with a cut-off value of 32% Ktrans decrease after CRT was 67%. The specificity and PPV were 90% and 44%, respectively. This was comparable with values reported by others groups [Citation16,Citation28].
Besides data from the DW-MRI and DCE-MRI, we also investigated volumetry data in this study. As T2w sequences are part of the standard of care staging and re-staging MRI protocol for rectal cancer, the T2w analyses were also included in the present study. The relative T2w volume difference showed diagnostic value for favorable pathological response. These results were comparable with recent publications [Citation6,Citation7].
To make optimal use of all MRI information, we assessed the diagnostic performance of the combination between T2w volumetry, ADC and Ktrans. For pCR, the best diagnostic parameter for pCR remained ∆ADC. For GR, addition of volume data to ∆ADC improved the model prediction although this difference was not significant. No additional value was found including DCE-MRI next to T2w imaging and DW-MRI in an MRI protocol used for response assessment in LARC. The lack of added value can be partly explained by the weak correlation which was found between relative ADC difference and relative Ktrans difference. This indicates that there is a correlation between tumor microstructure and vascular permeability. For response prediction, this implies that ∆ADC and ∆Ktrans partially predicted a good response in the same patients and thus, that combining both methods does not have an additional value. For patients the lack of additional value of DCE-MRI is beneficial because contrast administration in a protocol without DCE-MRI can be omitted. Our results show a better accuracy for detecting GR than pCR. This indicates that the detection of solitary tumor cells with DW-MRI, DCE-MRI or volumetry remains a challenge, even with multiparameter imaging.
A limitation of the study is that the study is underpowered as it was an explorative study initiated as a prelude to a larger multicenter study. The percentage of pCR in our patient group is with 11% slightly lower compared to the 15% found in a meta-analysis by Sanghera et al. [Citation2]. This is probably due to the mixed composition of the studies included in the meta-analysis compared to this single center study. First, in this study the patient group consisted of a group of patients with locally advanced rectal tumors. This group was a more homogeneous group compared to the patients included in the meta-analyses. The inclusion of only locally advanced instead of also smaller tumors could partially explain the lower amount of good responding patients. Second, we used a standardized pathology protocol with examination of extra tissue blocks in good responding patients to confirm the status of pCR and GR. This thorough search for individual tumor cells could have resulted in a lower number of good responding patients compared with studies with less standardized pathology.
The limited patient group restricted the statistical power of the model comparison, which showed no significant differences between the models for pCR. For GR it is shown that volumetry alone performed worse than the combined ∆ADC and ∆Volume. When assessed in a larger patient group it is likely that more differences between the predictive models can be seen. This may also reveal whether models containing multiple MR techniques are more predictive than single technique models.
Another limitation of this study is that the models presented in this study are composed from one study set and no external dataset was available to validate the models. Also no pre-selected cut-off value was used to calculate the diagnostic accuracy. Optimally, there is a cut-off value selected before start of study. This has to be done in a larger diagnostic study.
A strength of this study was that relative changes instead of absolute values itself were used in the models. By using the relative parameter changes the results become less dependent on the known inter-machine and protocol variations in ADC or Ktrans values.
In conclusion, this explorative study showed that ADC change is a promising diagnostic tool for both pCR and GR in patients with LARC after neo- adjuvant CRT. Volume decrease showed potential limited additional diagnostic value for GR while Ktrans change showed no additional diagnostic value for pCR and GR. Despite the limited patient group, these results justify further research in a larger prospective study with DW-MRI and tumor volumetry.
Declaration of interest: The authors report no conflicts of interest. The authors alone are responsible for the content and writing of the paper.
References
- van de Velde CJ, Boelens PG, Borras JM, Coebergh JW, Cervantes A, Blomqvist L, et al. EURECCA colorectal: Multidisciplinary management: European consensus conference colon & rectum. Eur J Cancer 2014;50:1.e1–34.
- Sanghera P, Wong DW, McConkey CC, Geh JI, Hartley A. Chemoradiotherapy for rectal cancer: An updated analysis of factors affecting pathological response. Clin Oncol (R Coll Radiol) 2008;20:176–83.
- Maas M, Beets-Tan RG, Lambregts DM, Lammering G, Nelemans PJ, Engelen SM, et al. Wait-and-see policy for clinical complete responders after chemoradiation for rectal cancer. J Clin Oncol 2011;29:4633–40.
- Habr-Gama A, Gama-Rodrigues J, Sao Juliao GP, Proscurshim I, Sabbagh C, Lynn PB, et al. Local recurrence after complete clinical response and watch and wait in rectal cancer after neoadjuvant chemoradiation: Impact of salvage therapy on local disease control. Int J Radiat Oncol Biol Phys 2014;88:822–8.
- Nougaret S, Fujii S, Addley HC, Bibeau F, Pandey H, Mikhael H, et al. Neoadjuvant chemotherapy evaluation by MRI volumetry in rectal cancer followed by chemoradiation and total mesorectal excision: Initial experience. J Magn Reson Imaging 2013;38:726–32.
- Aiba T, Uehara K, Nihashi T, Tsuzuki T, Yatsuya H, Yoshioka Y, et al. MRI and FDG-PET for assessment of response to neoadjuvant chemotherapy in locally advanced rectal cancer. Ann Surg Oncol 2014;21:1801–8.
- Lambregts DM, Rao SX, Sassen S, Martens MH, Heijnen LA, Buijsen J, et al. MRI and diffusion-weighted MRI volumetry for identification of complete tumor responders after preoperative chemoradiotherapy in patients with rectal cancer: A bi-institutional validation study. Ann Surg Epub 2014 Sep 10.
- Kim YC, Lim JS, Keum KC, Kim KA, Myoung S, Shin SJ, et al. Comparison of diffusion-weighted MRI and MR volumetry in the evaluation of early treatment outcomes after preoperative chemoradiotherapy for locally advanced rectal cancer. J Magn Reson Imaging 2011;34:570–6.
- Padhani AR, Liu G, Koh DM, Chenevert TL, Thoeny HC, Takahara T, et al. Diffusion-weighted magnetic resonance imaging as a cancer biomarker: Consensus and recommendations. Neoplasia 2009;11:102–25.
- Tofts PS. Modeling tracer kinetics in dynamic Gd-DTPA MR imaging. J Magn Reson Imaging 1997;7:91–101.
- Intven M, Reerink O, Philippens ME. Diffusion-weighted MRI in locally advanced rectal cancer: Pathological response prediction after neo-adjuvant radiochemotherapy. Strahlenther Onkol 2013;189:117–22.
- Intven M, Reerink O, Philippens ME. Dynamic contrast enhanced MR imaging for rectal cancer response assessment after neo-adjuvant chemoradiation. J Magn Reson Imaging Epub 2014 Aug 14.
- Lambregts DM, Vandecaveye V, Barbaro B, Bakers FC, Lambrecht M, Maas M, et al. Diffusion-weighted MRI for selection of complete responders after chemoradiation for locally advanced rectal cancer: A multicenter study. Ann Surg Oncol 2011;18:2224–31.
- Lambrecht M, Vandecaveye V, De Keyzer F, Roels S, Penninckx F, Van Cutsem E, et al. Value of diffusion-weighted magnetic resonance imaging for prediction and early assessment of response to neoadjuvant radiochemotherapy in rectal cancer: Preliminary results. Int J Radiat Oncol Biol Phys 2012;82:863–70.
- Kim SH, Lee JY, Lee JM, Han JK, Choi BI. Apparent diffusion coefficient for evaluating tumour response to neoadjuvant chemoradiation therapy for locally advanced rectal cancer. Eur Radiol 2011;21:987–95.
- Kim SH, Lee JM, Gupta SN, Han JK, Choi BI. Dynamic contrast-enhanced MRI to evaluate the therapeutic response to neoadjuvant chemoradiation therapy in locally advanced rectal cancer. J Magn Reson Imaging 2013;40:730–7.
- Hotker AM, Garcia-Aguilar J, Gollub MJ. Multiparametric MRI of rectal cancer in the assessment of response to therapy: A systematic review. Dis Colon Rectum 2014; 57:790–9.
- Korporaal JG, van den Berg CA, van Osch MJ, Groenendaal G, van Vulpen M, van der Heide UA. Phase-based arterial input function measurements in the femoral arteries for quantification of dynamic contrast-enhanced (DCE) MRI and comparison with DCE-CT. Magn Reson Med 2011;66:1267–74.
- Groenendaal G, Borren A, Moman MR, Monninkhof E, van Diest PJ, Philippens ME, et al. Pathologic validation of a model based on diffusion-weighted imaging and dynamic contrast-enhanced magnetic resonance imaging for tumor delineation in the prostate peripheral zone. Int J Radiat Oncol Biol Phys 2012;82:e537–44.
- Borren A, Groenendaal G, Moman MR, Boeken Kruger AE, van Diest PJ, van Vulpen M, et al. Accurate prostate tumour detection with multiparametric magnetic resonance imaging: Dependence on histological properties. Acta Oncol 2014; 53:88–95.
- Bol GH, Kotte AN, van der Heide UA, Lagendijk JJ. Simultaneous multi-modality ROI delineation in clinical practice. Comput Methods Programs Biomed 2009;96: 133–40.
- Quirke P, Morris E. Reporting colorectal cancer. Histopathology 2007;50:103–12.
- Mandard AM, Dalibard F, Mandard JC, Marnay J, Henry-Amar M, Petiot JF, et al. Pathologic assessment of tumor regression after preoperative chemoradiotherapy of esophageal carcinoma. Clinicopathologic correlations. Cancer 1994;73:2680–6.
- Firth D. Bias reduction of maximum likelihood estimates. Biometrika 1993;80:27–38.
- Hanley JA, McNeil BJ. A method of comparing the areas under receiver operating characteristic curves derived from the same cases. Radiology 1983;148:839–43.
- Lambrecht M, Deroose C, Roels S, Vandecaveye V, Penninckx F, Sagaert X, et al. The use of FDG-PET/CT and diffusion-weighted magnetic resonance imaging for response prediction before, during and after preoperative chemoradiotherapy for rectal cancer. Acta Oncol 2010;49:956–63.
- Genovesi D, Filippone A, Ausili Cefaro G, Trignani M, Vinciguerra A, Augurio A, et al. Diffusion-weighted magnetic resonance for prediction of response after neoadjuvant chemoradiation therapy for locally advanced rectal cancer: Preliminary results of a monoinstitutional prospective study. Eur J Surg Oncol 2013;39:1071–8.
- Lim JS, Kim D, Baek SE, Myoung S, Choi J, Shin SJ, et al. Perfusion MRI for the prediction of treatment response after preoperative chemoradiotherapy in locally advanced rectal cancer. Eur Radiol 2012;22:1693–700.