
To the Editor,
Salivary function loss has a strong impact on one's quality of life [Citation1]. As salivary gland function is not crucial for patient survival, parotids are often irradiated to reduce dose to more critical tissues in head and neck cancers [Citation2]. Salivary function loss is common [Citation3]. Although such irradiation is unavoidable, treatment planners using modern treatment techniques like volumetric modulated arc therapy or intensity-modulated proton therapy have freedom to adjust intra-parotid radiation quantities and locations. Detailed knowledge of tissue response and outcome risk is therefore needed for effectual planning [Citation4,Citation5].
Presently used consensus guidelines for parotid gland sparing assume a homogeneous distribution of functional burden [Citation3], are difficult to attain in practice, and do not ensure specific outcomes [Citation6]. In recent years, evidence has mounted to suggest a heterogeneous distribution [Citation4]. Recent reports have found delivering dose to one region of rat parotid results in a different incidence of objective xerostomia (dry mouth) than delivering that same dose elsewhere [Citation7]. Regional susceptibility of subjective (i.e. patient-reported) xerostomia has been noted in human parotid [Citation8]. In light of an earlier investigation by our group, it is presently unclear to what extent these findings relate to objective function alteration in humans, or whether such regions align with parotid parenchyma [Citation9].
In a recent survey of salivary gland radiation reduction techniques, Vissink et al. [Citation2] advocate tissue sparing as the most effective. There is growing evidence that functional imaging can be clinically relevant for more clearly defining target volumes and assessing adverse normal tissue effects [Citation4]. We report the development of a novel technique making use of dynamic contrast-enhanced magnetic resonance imaging (DCE-MRI) and concurrent salivary stimulation which can potentially identify parotid parenchyma in healthy volunteers. Inter- and intra-parotid tissue differentiation is possible, and application of the protocol could potentially improve tissue sparing. Results from a small, healthy volunteer trial are provided.
Methods
Ethics and accrual of volunteers
The study protocol was approved by the University of British Columbia, British Columbia Cancer Agency Research Ethics Board, and is in accordance with agency ethical standards and the Helsinki Declaration. Four volunteers were recruited, resulting in a total of eight parotids. Exclusion criteria are available in the Supplementary document (available online at: http://informahealthcare.com/doi/abs/10.3109/0284186X.2015.1067718).
Image collection and processing
Perfusion imaging was chosen as the primary imaging method to non-invasively characterize functioning tissues with high temporal resolution. Reports have demonstrated that DCE-MRI (without concurrent stimulation) can quantitatively measure radiotherapy-induced parotid gland perfusion alterations. Such alterations are thought to result from increased extracellular-extravascular space and decreased vascular permeability stemming from radiation damage [Citation10]. Function alteration can also be quantified via blood perfusion to parenchyma [Citation11]. Perfusion changes measured via DCE-MRI reflect physiological changes.
The protocol is detailed in the Supplementary materials. Standard T1-weighted DCE imaging was performed for 450–600s. Contrast agent was administered 45–60s after DCE sequence commencement. Salivation was manually induced 170–240s afterward via a weak (2% by weight) citric acid solution. Volunteer hydration was controlled.
Total scan time was reduced by forgoing additional flip angle images typically used for T1 maps. Instead, the signal difference method discussed by Ashton [Citation12] was used to compute per-voxel contrast agent time courses C(t). Spatial averaging was used to reduce the impact of noise.
For 3/4 volunteers, two DCE sequences were performed back-to-back: first with no stimulation and only 1/3 of the total contrast agent, and then the remaining 2/3 was injected and salivation was stimulated. Splitting 1/3–2/3 produced a baseline curve without substantially reducing the second scan SNR with lingering contrast agent.
Regions of interest (ROIs: parotid, masseter, and pharyngeal tissues) were manually contoured from anatomical and DCE MR images using the DICOMautomaton software suite [Citation13]. Parotid ROIs were also partitioned into anterior/posterior halves.
Statistics – variance analysis
Non-parametric techniques were used. The primary technique developed for inter-parotid analysis (and cross-organ analysis, e.g. parotid vs. masseter) is a topological analysis that characterizes C(t) variance on a cluster-of-voxels basis. We refer to it simply as “variance analysis”. The procedure is detailed in the Supplementary document. Essentially, temporal variance is computed over a sliding window and variance curve mean differences before/after stimulation are compared using standard tests (also described in the Supplementary document).
Image maps
A qualitative, topological method was developed to characterize intra-parotid tissue variation before and after stimulation. It is detailed in the Supplementary document. The core idea is to compare changes in slope in the temporal vicinity of stimulation. MRI series collected with/without concurrent stimulation are compared. Maps indicate responses to stimulation. This technique is later referred to as the “difference of changes in slope” technique.
Results
The mean parotid volume was 19.9 ± 4.4 cm3 (mean ± σ of the mean, median: 18.2 cm3). Left, right volumes correlate strongly (mean for left: 19.6 cm3, right: 20.2 cm3).
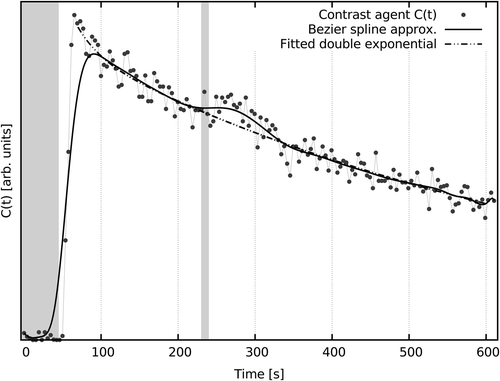
A typical, spatially averaged per-voxel C(t) from parotid is shown in . Key features are visible, including contrast agent injection and stimulatory response. Examples of other C(t) are shown in Supplementary Figure 1 (available online at: http://informahealthcare.com/doi/abs/10.3109/0284186X.2015.1067718).
Figure 1. A typical spatially averaged voxel C(t) demonstrating temporal stages of the protocol. From left: pre-contrast agent injection window (left-most gray box); rapid uptake period, where high concentrations of contrast rapidly perfuse into parotid tissues, peak, and begin to drain; stimulatory period running from 230 to 240 s from scan commencement, and a stimulatory response manifest as a modest contrast agent concentration increase; and continued slow washout. An empirical fit omitting the stimulatory period and Bezier spline interpolation are shown as visual guides.
For 3/4 volunteers (6/8 parotids), variance analysis demonstrated a clear distinction in apparent parotid stimulatory response (see Supplementary Figure 2, available online at: http://informahealthcare.com/doi/abs/10.3109/0284186X.2015.1067718). The fourth volunteer's variance was uniformly high and consequently no response was detected. The mean difference before/after stimulation in Supplementary Figure 2 (available online at: http://informahealthcare.com/doi/abs/10.3109/0284186X.2015.1067718) were significantly different (two-tailed t-test: 0.0 ± 1.1E-4 pre- vs. 1.9 ± 0.1E-3 (arb. units) post-stimulation mean ± σ of the mean; p < 0.0001). It is visually apparent that the paired Wilcoxon sign-rank test was also significant as the curves are almost entirely separated by a large gap post-stimulation (p < 0.0001). In 4/6 parotids (2/3 volunteers) where both stimulated and unstimulated time courses were collected, the Wilcoxon test indicated a significant difference in pre-/post-stimulation variances (p < 0.05). The other two were near significance (p = 0.05, 0.08). Two-tailed t-tests could be applied to examine mean shift (i.e. mean variance pre- vs. post-stimulation) in all cases; examination of the stimulated time course showed that 6/8 parotids had p < 0.02 (1.88 ± 0.17E-2 pre- vs. 1.68 ± 0.33E-2 post-stimulation or greater separation). For unstimulated time courses, 3/6 had p < 0.05.
For each individual volunteer, parotid (left, right) was significantly distinct from masseter (left, right) after stimulation in 13/16 cases: using a paired Wilcoxon sign-rank test, p < 0.0001 for 12/13 and p = 0.04 in the remaining case. In 12/16 cases mean differences were significantly different before/after stimulation using a two-tailed t-test (p < 0.02). Comparison of left, right masseter for each patient showed that in 3/4 cases, masseters did not respond differently to stimulation (two-tailed t-test p > 0.07; similar Wilcoxon p-values). Comparison of masseter to a variety of nearby, non-specific pharyngeal tissues in a single volunteer indicated they were, on average, not significantly different (Wilcoxon p = 0.07; two-tailed t-test p = 0.72). However, comparison of left and right parotid show that they responded differently to stimulation: p < 0.0001 for all Wilcoxon tests, p < 0.005 (0.9 ± 4.2E-4 left vs. 4.2 ± 0.6E-3 right or greater separation) for all t-tests.
A variance analysis was run on posterior and anterior parotid portions. Similar to whole parotids, two-tailed t-tests quantified mean shifts. For anterior parotid, stimulated time courses in 6/8 parotids had p < 0.05 (1.0 ± 0.3E-2 pre- vs. 9.7 ± 0.7E post-stimulation), whereas for unstimulated only 2/6 had p < 0.05. For posterior parotid, stimulated time courses in 4/8 parotids had p < 0.05; 4/6 had p < 0.05 for unstimulated courses. Comparison of the anterior and posterior portions directly showed a significant discrepancy in stimulatory response in right parotid (Wilcoxon p < 0.001) in 3/4 cases. The same discrepancy was seen in the left parotid in all cases.
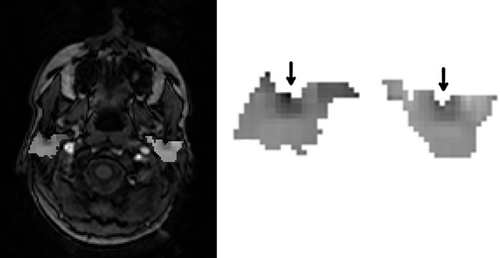
Image maps were generated using the difference of changes in slope technique. An example slice is shown in .
Discussion
The aim of this pre-clinical study was to develop a DCE-MRI imaging protocol capable of identifying parotid gland parenchyma in healthy volunteers. No existing literature on concurrent DCE-MRI and salivary stimulation was found. DCE-MRI was chosen for its temporal resolution and ability to assess functional alterations via blood perfusion to parenchyma [Citation11]. Scintigraphy is a well known and historically well used technique for quantifying parotid function but produces two-dimensional (2D) images and requires the use of costly radioisotopes (see [Citation1] and references therein). A novel technique making use of dynamic 11C-methionine positron emission tomography analogous to DCE-MRI has been described by Buus et al. [Citation14,Citation15] which improves on earlier single photon emission computed tomography (CT) methods in spatial resolution. PET produces high quality volumetric images but requires injection of a positron-emitting tracer and may require an additional imaging modality for (co-)registration [Citation16]. Both potentially increase patient dose. Perfusion CT is generally considered a low-cost, viable alternative to DCE-MRI [Citation17,Citation18], but DCE-MRI generally has superior spatial and temporal resolution, and requires no ionizing radiation [Citation19].
Perfusive changes were observed following stimulation, but response varied. shows a typical spatially averaged C(t) from a parotid voxel. Examples of other C(t) are shown in Supplementary Figure 1 (available online at: http://informahealthcare.com/doi/abs/10.3109/0284186X.2015.1067718). Response, if any, was generally delayed 10–30 seconds after stimulation commencement.
For 3/4 volunteers (6/8 parotids), variance analysis demonstrated a clear distinction in parotid stimulatory response. This result, combined with observed differences before/after stimulation and differences in pre-/post-stimulation variances, suggests variation in parotid response depending on the presence of a salivary stimulus.
Image maps () were generated using the difference of changes in slope technique to assess intra-parotid variations. Such variation was observed. The portion of parotid nearest to the posterior edge of the mandible (as indicated) was most dissimilar from surrounding parotid tissues. This region was recently found by van Luijk et al. to house stem/progenitor cells in rat parotid, and was reported as being strongly correlated with post-radiotherapy salivary output in humans (pers. comm. 2014). The alignment of regions found using different techniques suggests the proposed techniques may be suitable for locating critical regions. Maps were slowly varying and qualitatively regular across patients, suggesting a possible heterogeneous functional burden distribution.
Similar to the technique described by Buus et al. [Citation14,Citation15], our variance analysis and difference of changes in slope techniques could be used to assess radiotherapy-induced functional alterations. Unlike Buus et al.'s technique, through the use of MRI, our technique could be used to directly observe regional salivary compensation in nearly real-time throughout the entire 3D region of interest (ROI).
For each individual volunteer, parotid (left and right) was generally significantly distinct from masseter (left and right) after stimulation. Masseter was not distinct from nearby non-specific pharyngeal tissues. Left and right masseters did not respond differently to stimulation, but left and right parotid did. This indicates parotids are more strongly responding to stimulation than masseter. Distinction in parotid response was apparent. Variance analysis showed that after stimulation, parotid was significantly distinct from masseter, pharyngeal tissues, and other parotids. Compared with parotids, the response of nearby tissue to stimulation occurred later and with reduced amplitude. (An example is shown in Supplementary Figure 3, available online at: http://informahealthcare.com/doi/abs/10.3109/0284186X.2015.1067718). This finding is logical: salivation involves the transport of water which is rapidly replenished from the blood plasma during continued flow [Citation20].
A variance analysis performed on posterior and anterior portions of the parotid showed that, on average, there was a significant discrepancy in left and right parotid stimulatory response, indicating anterior and posterior parotid aspects show distinct responses to stimulation.
There are a number of limitations that remain to be addressed. It is not clear whether the proposed techniques can handle the so-called bath and shower effect observed in rat parotid [Citation7], which complicates tissue sparing. An explanation for this effect proposed in [Citation7] and observed by Konings et al. [Citation21,Citation22] – that portions of the parotid can be regenerated by progenitor cells in distant portions – would require a more sophisticated analysis if correct. However, parenchyma localization and sparing would likely remain valuable for reducing early functional loss.
One limitation of the signal difference method is that it ignores alterations to T1 due to the presence of contrast agent [Citation23]. The rationale for this choice is described in detail in the Supplementary document. A limitation of the difference of changes in slope technique is that slope changes represent a complicated admixture of pharmacokinetic parameters which cannot be easily interpreted as a specific change in tissues. Given that function alteration can be quantified via blood perfusion [Citation11], perfusive changes are likely to play a strong role. Further investigation is needed.
Functional tissue localization could potentially be improved using more advanced, faster imaging techniques or supplementary imaging. Candidates include relaxometry [Citation24], blood oxygenation level dependent MRI [Citation25], and intravoxel incoherent echo-planar motion imaging [Citation26,Citation27]. De Langen et al. [Citation16] suggests that dynamic PET and DCE-MRI are largely complementary techniques – we believe simultaneous use of Buus et al.'s [Citation14,Citation15] PET technique with DCE-MRI would result in a powerful means of characterizing parotid tissues. These additional techniques were not investigated as a protocol relying only on DCE-MRI was desired.
In conclusion, the imaging protocol developed, based on DCE imaging and concurrent salivary stimulation of the parotid glands, appears suitable for spatially localizing parenchyma.
Supplementary materials available online
Supplementary document, Supplementary Figures 1–3 available online at: http://informahealthcare.com/doi/abs/10.3109/0284186X.2015.1067718
ionc_a_1067718_sm3934.zip
Download Zip (9.7 MB)Declaration of interest: Dr. Moiseenko reports personal fees and non-financial support from Varian Medical Systems, outside the submitted work. Mr. Clark and Drs. Thomas, Wu, and Reinsberg have nothing to disclose.
References
- Jensen SB, Pedersen AL, Vissink A, Andersen E, Brown CG, Davies A, et al. A systematic review of salivary gland hypofunction and xerostomia induced by cancer therapies: Management strategies and economic impact. Support Care Cancer 2010;18:1061–79.
- Vissink A, Luijk P, Langendijk JA, Coppes RP. Current ideas to reduce or salvage radiation damage to salivary glands. Oral Dis 2015;21:e1–10.
- Deasy JO, Moiseenko V, Marks L, Chao KC, Nam J, Eisbruch A. Radiotherapy dose-volume effects on salivary gland function. Int J Radiat Oncol Biol Phys 2010;76:S58–63.
- Partridge M, Yamamoto T, Grau C, Høyer M, Muren LP. Imaging of normal lung, liver and parotid gland function for radiotherapy. Acta Oncol 2010;49:997–1011.
- van der Laan HP, van de Water TA, van Herpt HE, Christianen ME, Bijl HP, Korevaar EW, et al. The potential of intensity-modulated proton radiotherapy to reduce swallowing dysfunction in the treatment of head and neck cancer: A planning comparative study. Acta Oncol 2013; 52:561–9.
- Beetz I, Steenbakkers RJ, Chouvalova O, Leemans CR, Doornaert P, van der Laan BF, et al. The QUANTEC criteria for parotid gland dose and their efficacy to prevent moderate to severe patient-rated xerostomia. Acta Oncol 2014;53:597–604.
- van Luijk P, Faber H, Schippers JM, Brandenburg S, Langendijk JA, Meertens H, et al. Bath and shower effects in the rat parotid gland explain increased relative risk of parotid gland dysfunction after intensity-modulated radiotherapy. Int J Radiat Oncol Biol Phys 2009;74:1002–5.
- Buettner F, Miah AB, Gulliford SL, Hall E, Harrington KJ, Webb S, et al. Novel approaches to improve the therapeutic index of head and neck radiotherapy: An analysis of data from the PARSPORT randomised phase III trial. Radiother Oncol 2012;103:82–7.
- Clark HD, Hovan A, Moiseenko VV, Thomas SD, Wu JS, Reinsberg SA. Regional radiation dose susceptibility within the parotid gland: Effects on salivary loss and recovery. Med Phys 2015;42:2064–71.
- Juan CJ, Chen CY, Jen YM, Liu HS, Liu YJ, Hsueh CJ, et al. Perfusion characteristics of late radiation injury of parotid glands: Quantitative evaluation with dynamic contrast-enhanced MRI. Eur Radiol 2009;19:94–102.
- Naish JH, Kershaw LE, Buckley DL, Jackson A, Waterton JC, Parker GJ. Modeling of contrast agent kinetics in the lung using T1-weighted dynamic contrast-enhanced MRI. Magn Reson Med 2009;61:1507–14.
- Ashton E, Durkin E, Kwok E, Evelhoch J. Conversion from signal intensity to Gd concentration may be unnecessary for perfusion assessment of tumours using DCE-MRI. Proc Int Soc Magn Reson Med Sci Meet Exhib Int Soc Magn Reson Med Sci Meet Exhib 2007;2813.
- Clark HD, Thomas SD, Moiseenko VV, Lee R, Gill B, Duzenli C, et al. Automated segmentation and dose-volume analysis with DICOMautomaton. J Phys Conf Ser 2014;489:12009.
- Buus S, Grau C, Munk OL, Bender D, Jensen K, Keiding S. 11C-methionine PET, a novel method for measuring regional salivary gland function after radiotherapy of head and neck cancer. Radiother Oncol 2004;73:289–96.
- Buus S, Grau C, Munk OL, Rodell A, Jensen K, Mouridsen K, et al. Individual radiation response of parotid glands investigated by dynamic 11C-methionine PET. Radiother Oncol 2006;78:262–9.
- De Langen AJ, Van Den Boogaart VE, Marcus JT, Lubberink M. Use of H215O-PET and DCE-MRI to measure tumor blood flow. Oncologist 2008;13:631–44.
- Kierkels RG, Backes WH, Janssen MH, Buijsen J, Beets-Tan RG, Lambin P, et al. Comparison between perfusion computed tomography and dynamic contrast-enhanced magnetic resonance imaging in rectal cancer. Int J Radiat Oncol Biol Phys 2010;77:400–8.
- Ward J, Chalmers AG, Guthrie AJ, Larvin M, Robinson PJ. T2-weighted and dynamic enhanced MRI in acute pancreatitis: Comparison with contrast enhanced CT. Clin Radiol 1997;52:109–14.
- Padhani AR. Dynamic contrast‐enhanced MRI in clinical oncology: Current status and future directions. J Magn Reson Imaging 2002;16:407–22.
- Dawes C. Circadian rhythms in human salivary flow rate and composition. J Physiol 1972;220:529–45.
- Konings AWT, Cotteleer F, Faber H, van Lujik P, Meertens H, Coppes RP. Volume effects and region-dependent radiosensitivity of the parotid gland. Int J Radiat Oncol Biol Phys 2005;62:1090–95.
- Konings AWT, Faber H, Cotteleer F, Vissink A, Coppes RP. Secondary radiation damage as the main cause for unexpected volume effects: A histopathologic study of the parotid gland. Int J Radiat Oncol Biol Phys 2006;64: 98–105.
- Wang P, Xue Y, Zhao X, Yu J, Rosen M, Song HK. Effects of flip angle uncertainty and noise on the accuracy of DCE-MRI metrics: Comparison between standard concentration-based and signal difference methods. Magn Reson Imaging 2015;33:166–73.
- Haimerl M, Verloh N, Fellner C, Zeman F, Teufel A, Fichtner-Feigl S, et al. MRI-based estimation of liver function: Gd-EOB-DTPA-enhanced T1 relaxometry of 3T vs. the MELD score. Sci Rep 2014;5621:1–7.
- Simon-Zoula SC, Boesch C, De Keyzer F, Thoeny HC. Functional imaging of the parotid glands using blood oxygenation level dependent (BOLD)-MRI at 1.5T and 3T. J Magn Reson Imaging 2008;27:43–8.
- Le Bihan D. Apparent diffusion coefficient and beyond: What diffusion MR imaging can tell us about tissue structure. Radiology 2013;268:318–22.
- Haberman CR, Cramer MC, Graessner J, Gossrau P, Reitmeier F, Fiehler J, et al. Functional imaging of parotid glands: Diffusion-weighted echo-planar MRI before and after stimulation. Fortschr Geb Rontgenstrahlen Neuen Bildgeb Verfahr Erganzungsbd 2004;176:1385–9.