
Abstract
Background and Purpose: Prediction models for radiation-induced lung damage (RILD) are still unsatisfactory, with clinical toxicity endpoints that are difficult to quantify objectively. We therefore evaluated RILD more objectively, quantitatively and on a continuous scale measuring the lung tissue density changes per voxel.
Material and methods: Patients treated with radiotherapy (RT) alone, sequential and concurrent chemo-RT with and without the addition of cetuximab were studied. Follow-up computed tomography (CT) scans were co-registered using deformable registration to baseline CT scans. CT density changes were correlated to the RT dose delivered in every part of the lungs.
Results: One hundred and seventeen lung cancer patients were included. Mean dose to tumor was 60 Gy (range 45–79.2 Gy). Dose response curves showed a linear increase in the dose region between 0 and 65 Gy having a slope (based on coefficients of the multilevel model) expressed as a lung density increase per dose of 0.86 (95% CI 0.73–0.99), 1.31 (95% CI 1.19–1.43), 1.39 (95% CI 1.28–1.50) and 2.07 (95% CI 1.93–2.21) for patients treated only with RT (N=19), sequential chemo-RT (N=30), concurrent chemo-RT (N=49), and concurrent chemo-RT with cetuximab (N=19), respectively.
Conclusions: CT density changes allow quantitative assessment of lung damage after fractionated RT, giving complementary information to standard used clinical endpoints. Patients receiving cetuximab showed a significantly larger dose response compared with other treatments.
Radiotherapy (RT) is a standard treatment in patients with stage I, II, III, and IV lung cancer [Citation1]. Radiation-induced lung damage (RILD), i.e. pneumonitis and fibrosis is common in these patients after RT [Citation2,Citation3]. Radiological findings usually appear within three months after RT and are progressive thereafter [Citation4]. Most patients have asymptomatic RILD. However, RILD has traditionally been scored on clinical grounds, such as dyspnea or the use of corticoids as reflected in some scoring systems as CTCAE-RTOG. The drawback of these clinically relevant scoring systems is their subjectivity, the fact that these are ordinal scales, the implicit assumption that each step represents the same functional impairment and importantly that these endpoints are not specific for radiation damage. As an example, dyspnea may be related to heart failure or exacerbation of chronic obstructive lung disease (COPD) [Citation5,Citation6]. An objective scoring system of RILD on a continuous scale would be of great value for more reliable dose-effect relationships could be derived, including genetic features of the patient [Citation7–9].
It has been shown that radiation-induced local lung density changes are often detected on follow-up computed tomography (CT) scans and can be more objectively quantified. This approach has been investigated in several studies [Citation2,Citation3,Citation10,Citation11]. Additionally a local dose response curve (DRC) of different parts of the lungs might be extracted, based on visual semi-quantitative assessment [Citation12]. However, a CT-based practical objective quantitative system would greatly be acknowledged.
Moreover, as locally advanced lung cancer is preferably treated in a multi-modal (combining chemotherapy with RT or both chemo-RT and surgery) way, there is a need for methods that can quantify additional or incremental damage from combining treatment options including chemotherapy plus RT and more recently in trials also in combination with the monoclonal antibody against the epidermal growth factor receptor (EGFR) cetuximab [Citation13–15]. Cetuximab, a monoclonal antibody against the EGFR has shown activity in non-small cell lung cancer (NSCLC) and in addition it has been found to potentiate the effects of chemotherapy and RT in experimental systems [Citation16].
The aim of this study was to use the regional lung tissue density changes per voxel to evaluate RILD objectively. Therefore, we compared changes in density measured by CT imaging over time from four different treatment schedules for NSCLC and small cell lung cancer (SCLC): RT alone, sequential chemo-RT, concurrent chemo-RT, and concurrent chemo-RT with the addition of cetuximab.
Material and methods
Patient characterization and treatment
CT scans of lung cancer patients (both NSCLC and SCLC) were retrieved for patients receiving radical RT between 2004 and 2010 at MAASTRO clinic. Patients surviving up to six months from the end of RT that had post-treatment CT scans available (range 2.5–6 months), were considered in the study. Multiple treatment regimens of lung cancer were analyzed: RT alone, sequential and concurrent chemo-RT, concurrent chemo-RT with the addition of the targeted agent cetuximab, the latter in a phase I trial NCT00522886 [Citation17]. The follow-up CT scans were collected from the three referring medical centers in the region.
The patients were treated with three-dimensional conformal RT (3DCRT) with an individualized schedule as previously described [Citation18–20]. Treatment planning was done according to European Organization for Research and Treatment of Cancer (EORTC) guidelines [Citation21]. Treatments were planned using XiO RT planning system (Elekta, Crawley, UK) using a superposition algorithm with density inhomogeneity corrections. Various fractionation schedules were used according to clinical protocol and cancer type (SCLC or NSCLC). Fractionation for the SCLC and NSCLC was 1.5 Gy/fraction (twice daily), for the first 45 Gy. The NSCLC were then further escalated up to normal tissue constraints in daily fractions of 2 Gy up to a maximum of 69 Gy for the concurrent chemo-RT group. For the sequential chemo RT of NSCLC a 1.8 Gy/fraction (twice daily) was delivered up to normal tissue constraints to a maximum of 79.2 Gy. Stereotactic body RT patients with high fraction doses were excluded from the analysis. A radiation oncologist verified the patients with recurrence as well as patients that had undergone surgery and these patients were excluded from the study.
For sequential chemo-RT in NSCLC, three cycles of cisplatin and gemcitabine were given, followed after 3–4 weeks by RT. For concurrent chemo-RT in NSCLC, three cycles of cisplatin and vinorelbine followed by two courses of gemcitabine/carboplatin were administered. In the framework of a phase I trial (NCT00522886) in patients with stage III NSCLC, the same concurrent chemo-RT regimen was combined with concurrent cetuximab. In SCLC, concurrent chemo-RT was given with cisplatin and etoposide. SCLC patients received a mean tumor dose [planning tumor volume (PTV)] of 49.5 Gy (range 45–54 Gy). The NSCLC patients received a mean PTV of 62.9 Gy (range 45–79.2 Gy).
Imaging and follow-up scans
The radiation treatment planning CT scans prior to RT treatment (pre-RT scans) were used as baseline scans. The scanner used was a Siemens Biograph 40 PET-CT. CT images were acquired at 120 kV with a 512 × 512 image matrix; voxel size of 0.98 mm × 0.98 mm × 3 mm and reconstructed using filtered back projection (FBP). These pre-RT scans used for treatment planning purposes were mainly non-contrast enhanced respiratory gated CT scans, whereas the follow-up CT scans were with contrast typically acquired in breath-hold. In the contrast enhanced CT scans, the effect of contrast agent uniformly increases the CT density. In order to account for the influence of contrast agent on the CT, the offset of these measurements was normalized to the first dose bin (see next paragraph). This eliminates the influence of contrast agent on the measurements [Citation2].
The delineations of the organs at risk and target volumes were made based on a mid-expiration CT phase of a respiratory gated CT scan acquired in RT treatment position on a flat table top of the scanner [Citation22]. Follow-up scans were acquired in the referring hospital in breath-hold on a diagnostic CT scanner typically with a curved table top. As the baseline scan and the follow-up scans were acquired at different breathing phases, the influence on the lung density was investigated. Mid-ventilation phase of the 4D-CT scans of four patients were compared to the breath-hold CT scans acquired post-treatment in order to quantify possible differences. Post-irradiation (3–6 months) pulmonary fibrosis (radiographic changes) (CTCAE 3.0) was available for a sub-group of patients that made it possible to correlate the CT density changes with physician-graded radiological fibrosis scores.
Image registration and data analysis
To compensate for different patient set-up inside the CT scanner, breathing state, and small deformations we used non-rigid image registration to register follow-up scans to baseline scans. Image registration and deformation was performed using an in-house Matlab-based tool validated for image registration inside the thorax [Citation23]. After a rigid registration step, non-rigid registration was applied to align two images from the same patient at the two time points. Non-rigid registration was based on the Morphons algorithm using eight resolution steps of 10 iterations with a Gaussian smoothing filters of 1.5 times the voxel dimensions [Citation23]. The algorithm has been investigated for accuracy of tumor residue by Spijkerman et al. [Citation24]. For lung tissue registration this method had accuracy well below 5 mm resampling in which we have used in this study. Delineations of the lung and the PTV together with the 3D dose distribution were exported from the treatment planning system. Small errors in registrations at the borders between the lungs and the ribs could influence the density measurements; therefore we eroded the lung contours by 5 mm.
A volume of interest (e.g. mask) was based on the lung contours. The dose distribution was split into bins of 1 Gy ranging from 0 to 70 Gy, the mask was overlaid on the CT images and the difference in CT density [Hounsfield Units (HU)] between the pre-RT and follow-up scan was calculated. The density changes on the lung were considered without the PTV. In order to account for possible differences in the lung volume, scanner model and type, and intra-venous contrast media administration, we normalized (by subtracting) the change in density in the entire curve to the first dose bin, in accordance with the study of Boersma et al. [Citation25]. A DRC was generated for each patient, showing the density change as a function of dose for these bins. The DRCs of the patients for each treatment group were combined (i.e. mean) to create population DRCs.
Statistical analysis
We used R (R Core Team, 2012) and lme4 (Bates, Maechler & Bolker, 2012) to perform a linear mixed effects analysis of the relationship between density changes and treatment. By using this type of regression model it is possible to account for the association that exists between multiple measurements from the same patient. Likelihood ratio tests were applied to compare models and a p-value of <0.05 was considered statistically significant. Radiation dose, systemic treatment and an interaction term were entered into the model. In addition, a random intercept was used to obtain a regression line for each patient, which resulted in a group of parallel regression lines. Instead of estimating an intercept for each patient, a single variance parameter was estimated, representing how spread out the random intercepts were around the common intercept of each treatment group.
Results
CT scans from 117 lung cancer patients were evaluated; 88% of the patients had their follow-up scans between 3 and 6 months after RT, and 12% had their follow-up scans between 2.5 and 3 months after RT.
Multiple treatment regimens of lung cancer were retrospectively analyzed: RT alone (N=19), sequential (N=30) and concurrent chemo-RT (N=49), concurrent chemo-RT with the addition of the cetuximab (N=19) ().
Table I. Patient characteristics.
For 58 patients, post-irradiation (3–6 months) CTCAE radiographic fibrosis scoring was available. There was a significant correlation between the mean CT density changes and physician-graded radiological fibrosis scores ≥1 (χ2-test p=0.01). Twenty-seven patients showed a fibrosis score of 0, and 31 of the patients had a fibrosis score ≥1. For the latter group of patients, density increase in the lungs was also visible in the radiological scans, indicating pneumonitis and/or fibrosis. The difference between different breathing phases was estimated to be around a mean value of 10 ± 7 HU, mainly around the edges of the lung contours. This minor difference was minimized by eroding the lung contour by 5mm after registration. Density increase in the lung was visually apparent from the follow-up scans and also resulted in density increase depending on the dose (). The density changes for low dose regions (regions below 10 Gy) were small (<5 HU). CT density changes for all patient population groups followed an increasing trend for all doses up to 70 Gy () Scatter-plots of density changes vs. dose for all treatment groups are found in Figure 1 of the Supplementary material. The mean increase in HU and the standard error was 34 ± 11, 39 ± 11, 41 ± 10, and 50 ± 11 for RT, sequential chemo-RT, concurrent chemo-RT, and concurrent chemo-RT with cetuximab, respectively.
Figure 1. Example of a patient showing increased lung density in the post-treatment scans inside the irradiated area. The pre-treatment scan and follow-up scan are shown. The yellow contours represent the planning target volume (PTV). Patient shows a severe change in density. The mean density change is 108 HU. The bottom plot shows the average increase for the various dose bins for this patient, error-bars represent standard error of the mean (SEM). For illustration purposes, the results are binned into 10 Gy bins.
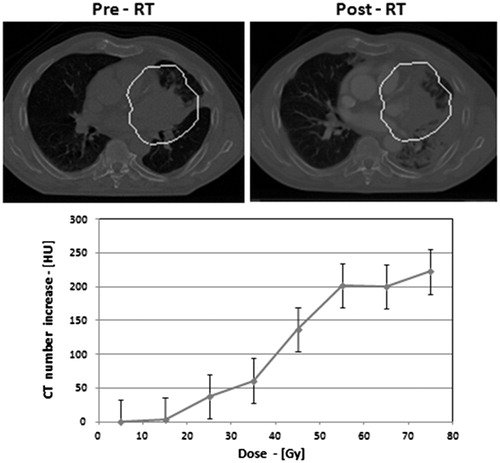
Figure 2. The linear mixed model showed a linear increase of density changes as a function of dose for all treatment groups. The higher increase in density changes was observed in the group treated with cetuximab.
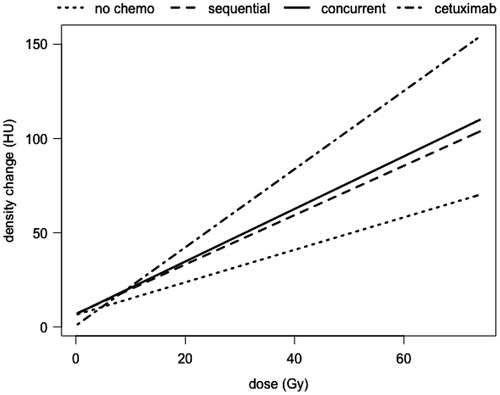
DRCs were approximately linear in the dose region between 0 and 70 Gy. Using the coefficients of the multilevel model we estimate a slope expressed as a lung density increase per dose (HU/Gy), of 0.86 (95% CI 0.73–0.99), 1.31 (95% CI 1.19–1.43), 1.39 (95% CI 1.28–1.50) and 2.07 (95% CI 1.93–2.21) for patients treated only with RT, sequential chemo-RT, concurrent chemo-RT, and concurrent chemo-RT with cetuximab, respectively. The method of Shinichi Nakagawa and Holger Schielzeth [Citation26] was used to calculate the R2. This method derives two R2 values which are suitable for using in mixed models. The first is called the marginal R2 which describes the proportion of variance explained by the fixed factor(s) alone. The second is the conditional R2, which describes the proportion of variance explained by both the fixed and random factors. In this study, the marginal R2 was 0.22 while the conditional R2 was 0.56.
Results of the linear mixed model showed a linear increase of density changes as a function of dose for all treatment groups () Liner mixed model coefficients are shown in Table 1 of supplementary material. A linear model (with the variable dose and treatment modality) compared to an intercept only model resulted in a p-value of <2.2 × 10⁻¹⁴. Moreover, entering the interaction term of radiation dose and systemic treatment resulted in a statistically significant improvement of the model (LR test, p<0.001), indicating that the radiation dose effect on the density changes depended on the systemic treatment. The DRC was steepest for the group treated with concurrent chemo-RT with cetuximab as seen in .
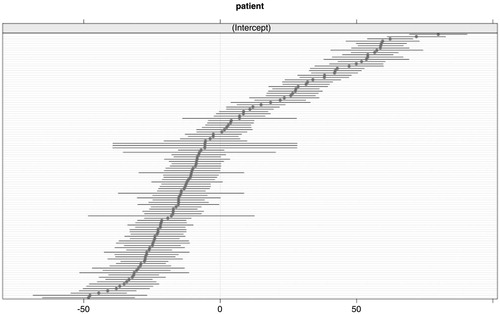
The density change of every individual patient, irrespective of the dose and treatment, is plotted in , showing the patient-specific random intercepts and the 95% confidence intervals around the patient random intercept. If these intercets are around zero, it means that there is no variance around the fixed effect intercept. So in other words, the patient-specific effect is negligible. The plot shows that there are considerable differences between patients. The random intercept explains a large part of the variance in the density. It can be concluded that individual radiosensitivity differs greatly among patients. A likelihood ratio for the patient effect (random intercept) was performed which resulted in an p<0.001, indicating that the variance in the density change explained by the patient variable is statistically significant. However, although the plot gives an indication of the differences between patients and the uncertainty surrounding the point estimate, we can not really quantify this. The random intercept in the model is expressed as the amount of variance, there is no coefficient estimated for each individual patient. Moreover, the distribution in is comparable to standard errors of fixed effects. As the number of measurements varies between patients, we can not perform a formal test for this effect.
Figure 3. The plot shows the patient-specific random intercepts and the 95% confidence intervals around the patient random intercept. If these intercepts are around zero, it means that the density change could be modeled by just using fixed effects. So, in other words, the patient-specific effect is negligible.
Discussion
A majority of patients receiving RT have asymptomatic RILD. RILD is of importance since it is an important dose limiting toxicity. Traditional RILD scoring is only based on subjective clinical scoring systems. This study demonstrates that CT density measurements allows a quantitative evaluation of RILD that correlates with physician assigned fibrosis. This method may be used to identify damage induced by a combination of radiation and drugs, e.g. adding monoclonal antibodies, such as cetuximab. Furthermore, CT imaging gives complementary and more objective information than standard used clinical endpoints. The imaging endpoint considered in this study is the HU density change, assessed in radiation dose bins of 1 Gy. Using the presented multi-level technique used in this study we could detect the individual susceptibility to RILD for each patient and also quantify RILD for four different treatment groups.
The results of our findings were similar to previous studies showing an increase in density up to a dose of 70 Gy [Citation12,Citation27,Citation28]. As indicated also in the study from Phernambucq et al. there is significant density increases in 2.5–6 months post-radiation treatment [Citation29]. A large inter-individual variability was seen in the severity of lung damage, which was an indication that patients were affected differently by high doses and may be due to differences in radiosensitivity [Citation30,Citation31]. This variability was also seen within each treatment group. Previous studies have also reported such patient-to-patient variability in normal lung injury [Citation2,Citation11,Citation32].
A study from van den Heuvel et al. showed that the addition of cetuximab to concurrent cisplatin increased pulmonary toxicity [Citation33]. We speculate that cetuximab interferes with normal tissue repair leading to a more pronounced inflammatory and or fibrotic reaction with unclear clinical consequences. Boersma et al. and Ma et al. also found increases in CT density in the low dose (<5 Gy) region which led to an offset in the DRCs [Citation3,Citation25]. Likewise, in our study such differences in the DRCs were evident. As a result for each patient we normalized our data to average magnitude of the low dose region (dose interval of 0–1). These offsets may have resulted from a number of reasons. It may have been due to differences in scanner types and scan acquisition protocols, the effect of contrast, as well as the difference in the lung volume during the image acquisition of the planning scans (mid-expiration) and the follow-up scans (breath-hold), which is addressed by a difference in the CT density.
Deformable registration was necessary in this study since the scans before and after treatment were not acquired at the same breathing phase, the same scanning table top, and it also accounts for different breathing phases. Rigid registration lacks accuracy for sufficiently comparing the density changes after RT on a local (e.g. voxel) level [Citation10].
By quantitatively assessing lung damage after different RT regimens, the radiological changes can be related to the dose distributions and could serve as an early detection of lung injury. It can also be a predictive measure of cancer recurrence at an early time point after treatment as shown also in a study by Mattonen et al., where CT image texture analysis (ground glass opacity appearance) of follow-up scans within 5 months of treatment, demonstrated the ability to predict recurrence [Citation34]. In their study two of the nine features that were calculated were the mean CT density and the standard deviation of the CT density as is discussed in our study [Citation35].
The limitations of our study were that all scans were not collected throughout a study, therefore some parameters, including scanner types and scan acquisition protocol were not matching for all patients. The planning CT scan was used as the baseline scan because of the availability of all delineated structures and less variation in the acquisition protocol at baseline compared to the diagnostic CT scan. Also comparatively smaller sample size was available for the group treated with cetuximab. Another limitation was that fixed follow-up time points were not available.
This method of analysis paves the way for future studies that allow objective analysis of lung toxicity that take into account patient to patient variability observed in the CT measurements on a local level. Such analysis techniques make optimal use of the current availability of imaging in routine practice. CT density changes are only a surrogate for one aspect of RILD. Although dyspnea is the only relevant symptom for the patient, it is a multi-factorial, subjective and semi-quantitative endpoint. CT density changes may allow dissecting the causes of dyspnea after RT to finally come to clinical interventions.
We implemented a method for generating dose-response relationships for RILD. Our analyses indicate that there is a dose-dependent CT density increase for patients receiving RT. Increase in density changes was to a lesser extent related to the systematic treatment and this increase is enhanced for patients receiving cetuximab in addition to concurrent chemo-RT. The current analysis technique is an objective and quantitive method to determine lung damage.
Declaration of interest
The authors report no conflicts of interest. The authors alone are responsible for the content and writing of the paper.
Supplementary material available online
Supplementary Figure 1 and Table 1
suppl.zip
Download Zip (209.4 KB)References
- Vansteenkiste J, De Ruysscher D, Eberhardt WEE, Lim E, Senan S, Felip E, et al. Early and locally advanced non-small-cell lung cancer (NSCLC): ESMO Clinical Practice Guidelines for diagnosis, treatment and follow-up. Ann Oncol. 2013 October 1, 2013;24(suppl 6):vi89–vi98.
- Jenkins P, Welsh A. Computed tomography appearance of early radiation injury to the lung: Correlation with clinical and dosimetric factors. Int J Radiat Oncol Biol Phys 2011;81:97–103.
- Ma J, Zhang J, Zhou S, Hubbs JL, Foltz RJ, Hollis DR, et al. Regional lung density changes after radiation therapy for tumors in and around thorax. Int J Radiat Oncol Biol Phys 2010;76:116–22.
- Kimura T, Matsuura K, Murakami Y, Hashimoto Y, Kenjo M, Kaneyasu Y, et al. CT appearance of radiation injury of the lung and clinical symptoms after stereotactic body radiation therapy (SBRT) for lung cancers: Are patients with pulmonary emphysema also candidates for SBRT for lung cancers? Int J Radiat Oncol Biol Phys 2006;66:483–91.
- Dehing-Oberije C, De Ruysscher D, van Baardwijk A, Yu S, Rao B, Lambin P. The importance of patient characteristics for the prediction of radiation-induced lung toxicity. Radiother Oncol 2009;91:421–6.
- Yirmibesoglu E, Higginson DS, Fayda M, Rivera MP, Halle J, Rosenman J, et al. Challenges scoring radiation pneumonitis in patients irradiated for lung cancer. Lung Cancer 2012;76:350–3.
- Marks LB, Bentzen SM, Deasy JO, Kong FM, Bradley JD, Vogelius IS, et al. Radiation dose-volume effects in the lung. Int J Radiat Oncol Biol Phys 2010;76(3 Suppl):S70–6.
- Robbins ME, Brunso-Bechtold JK, Peiffer AM, Tsien CI, Bailey JE, Marks LB. Imaging radiation-induced normal tissue injury. Radiat Res 2012;177:449–66.
- Andreassen CN, Barnett GC, Langendijk JA, Alsner J, De Ruysscher D, Krause M, et al. Conducting radiogenomic research – do not forget careful consideration of the clinical data. Radiother Oncol 2012;105:337–40.
- Palma DA, van Sornsen de Koste JR, Verbakel WF, Senan S. A new approach to quantifying lung damage after stereotactic body radiation therapy. Acta Oncol 2011;50:509–17.
- Diot Q, Kavanagh B, Schefter T, Gaspar L, Stuhr K, Miften M. Regional normal lung tissue density changes in patients treated with stereotactic body radiation therapy for lung tumors. Int J Radiat Oncol Biol Phys 2012;84:1024–30.
- Mah K, Van Dyk J, Keane T, Poon PY. Acute radiation-induced pulmonary damage: A clinical study on the response to fractionated radiation therapy. Int J Radiat Oncol Biol Phys 1987;13:179–88.
- Auperin A, Le Pechoux C, Rolland E, Curran WJ, Furuse K, Fournel P, et al. Meta-analysis of concomitant versus sequential radiochemotherapy in locally advanced non-small-cell lung cancer. J Clin Oncol 2010;28:2181–90.
- Govindan R, Bogart J, Stinchcombe T, Wang X, Hodgson L, Kratzke R, et al. Randomized phase II study of pemetrexed, carboplatin, and thoracic radiation with or without cetuximab in patients with locally advanced unresectable non-small-cell lung cancer: Cancer and Leukemia Group B trial 30407. J Clin Oncol 2011;29:3120–5.
- Blumenschein GR, Jr.Paulus R, Curran WJ, Robert F, Fossella F, Werner-Wasik M, et al. Phase II study of cetuximab in combination with chemoradiation in patients with stage IIIA/B non-small-cell lung cancer: RTOG 0324. J Clin Oncol 2011;29:2312–18.
- De Ruysscher D, Belderbos J, Reymen B, van Elmpt W, van Baardwijk A, Wanders R, et al. State of the art radiation therapy for lung cancer 2012: A glimpse of the future. Clin Lung Cancer 2013;14:89–95.
- Dingemans AM, Bootsma G, van Baardwijk A, Reymen B, Wanders R, Brans B, et al. A phase I study of concurrent individualized, isotoxic accelerated radiotherapy and cisplatin-vinorelbine-cetuximab in patients with stage III non-small-cell lung cancer. J Thorac Oncol 2014;9:710–16.
- van Baardwijk A, Wanders S, Boersma L, Borger J, Ollers M, Dingemans AM, et al. Mature results of an individualized radiation dose prescription study based on normal tissue constraints in stages I to III non-small-cell lung cancer. J Clin Oncol 2010;28:1380–6.
- De Ruysscher D, van Baardwijk A, Steevens J, Botterweck A, Bosmans G, Reymen B, et al. Individualised isotoxic accelerated radiotherapy and chemotherapy are associated with improved long-term survival of patients with stage III NSCLC: A prospective population-based study. Radiother Oncol 2012;102:228–33.
- Reymen B, Van Loon J, van Baardwijk A, Wanders R, Borger J, Dingemans AM, et al. Total gross tumor volume is an independent prognostic factor in patients treated with selective nodal irradiation for stage I to III small cell lung cancer. Int J Radiat Oncol Biol Phys 2013;85:1319–24.
- De Ruysscher D, Faivre-Finn C, Nestle U, Hurkmans CW, Le Pechoux C, Price A, et al. European Organisation for Research and Treatment of Cancer recommendations for planning and delivery of high-dose, high-precision radiotherapy for lung cancer. J Clin Oncol 2010;28:5301–10.
- Bosmans G, Buijsen J, Dekker A, Velders M, Boersma L, De Ruysscher D, et al. An “in silico” clinical trial comparing free breathing, slow and respiration correlated computed tomography in lung cancer patients. Radiother Oncol 2006;81:73–80.
- Janssens G, Jacques L, Orban de Xivry J, Geets X, Macq B. Diffeomorphic registration of images with variable contrast enhancement. Int J Biomed Imaging 2011;2011:891585.
- Spijkerman J, Fontanarosa D, Das M, van Elmpt W. Validation of nonrigid registration in pretreatment and follow-up PET/CT scans for quantification of tumor residue in lung cancer patients. J Appl Clin Med Phys 2014;15:4847.
- Boersma LJ, Damen EM, de Boer RW, Muller SH, Roos CM, Valdes Olmos RA, et al. Dose-effect relations for local functional and structural changes of the lung after irradiation for malignant lymphoma. Radiother Oncol 1994;32:201–9.
- Nakagawa S, Schielzeth H. A general and simple method for obtaining R2 from generalized linear mixed-effects models. Method Ecol Evol 2013;4:133–42.
- Ma J, Zhang J, Zhou S, Hubbs JL, Foltz RJ, Hollis DR, et al. Association between RT-induced changes in lung tissue density and global lung function. Int J Radiat Oncol Biol Phys 2009;74:781–9.
- De Ruysscher D, Sharifi H, Defraene G, Kerns SL, Christiaens M, De Ruyck K, et al. Quantification of radiation-induced lung damage with CT scans: The possible benefit for radiogenomics. Acta Oncol 2013;52:1405–10.
- Phernambucq EC, Palma DA, Vincent A, Smit EF, Senan S. Time and dose-related changes in radiological lung density after concurrent chemoradiotherapy for lung cancer. Lung Cancer 2011;74:451–6.
- Turesson I. Individual variation and dose dependency in the progression rate of skin telangiectasia. Int J Radiat Oncol Biol Phys 1990;19:1569–74.
- Geara FB, Peters LJ, Ang KK, Wike JL, Brock WA. Radiosensitivity measurement of keratinocytes and fibroblasts from radiotherapy patients. Int J Radiat Oncol Biol Phys 1992;24:287–93.
- Bentzen SM, Overgaard J. Patient-to-patient variability in the expression of radiation-induced normal tissue injury. Semin Radiat Oncol 1994;4:68–80.
- van den Heuvel MM, Uyterlinde W, Vincent AD, de Jong J, Aerts J, Koppe F, et al. Additional weekly cetuximab to concurrent chemoradiotherapy in locally advanced non-small cell lung carcinoma: Efficacy and safety outcomes of a randomized, multi-center phase II study investigating. Radiother Oncol 2014;110:126–31
- Mattonen SA, Palma DA, Haasbeek CJ, Senan S, Ward AD. Early prediction of tumor recurrence based on CT texture changes after stereotactic ablative radiotherapy (SABR) for lung cancer. Med Phys 2014;41:033502.
- Cunliffe A, Armato III SG, Castillo R, Pham N, Guerrero T, Al-Hallaq HA. Lung texture in serial thoracic computed tomography scans: Correlation of radiomics-based features with radiation therapy dose and radiation pneumonitis development. Int J Radiat Oncol Biol Phys 2015;91:1048–56.