Abstract
Aim. The purpose was to assess the direct costs of screening for high blood pressure and blood glucose in dental care and of follow-up in primary health care and, based on these data, arrive at a prediction function.
Study population. All subjects coming for routine check-ups at three dental health clinics were invited to have blood pressure or blood glucose measurements; 1,623 agreed to participate. Subjects screening positive were referred to their primary health care centres for follow-up.
Methods. Information on individual screening time was registered during the screening process, and information on accountable time, costs for the screening staff, overhead costs, and analysis costs for the screening was obtained from the participating dental clinics. The corresponding items in primary care, i.e. consultation time, number of follow-up appointments, accountable time, costs for the follow-up staff, overhead costs, and analysis costs during follow-up were obtained from the primary health care centres.
Results. The total screening costs per screened subject ranged from €7.4 to €9.2 depending on subgroups, corresponding to 16.7–42.7 staff minutes. The corresponding follow-up costs were €57–€91. The total resource used for screening and follow-up per diagnosis was 563–3,137 staff minutes. There was a strong relationship between resource use and numbers needed to screen (NNS) to find one diagnosis (P < 0.0001, degree of explanation 99%).
Conclusions. Screening and follow-up costs were moderate and appear to be lower for combined screening of blood pressure and blood glucose than for separate screening. There was a strong relationship between resource use and NNS.
Introduction
Because of the asymptomatic nature, most subjects are unaware of hypertension and diabetes in the early course but have nevertheless an increased risk of developing cardiovascular and other complications (Citation1,2). It is also well known that treatment reduces the risk of complications (Citation3). It has been assumed that early detection and treatment reduce or postpone the risk of complications, even though no firm evidence has been forwarded so far.
Prevention of complications not only benefits patients, but also potentially reduces overall health care expenditure (Citation4,5). Blood pressure and blood glucose screening is one possible means of finding subjects unaware of their disease. The question is how best to screen subjects who consider themselves healthy and therefore have no reason to see a physician.
In industrialized countries, the dental care (DC) service is usually the only health care organization to which healthy people systematically come for regular check-ups (Citation6). It has been estimated that during a 2-year period approximately 80% of the adult population in Sweden see a dentist for routine dental check-up, whereas regular check-ups in primary health care of healthy people hardly exist (Citation6). DC may therefore be a suitable venue for screening large segments of the general population. In previous publications from this project the possibilities of using DC for screening of blood pressure and blood glucose, with follow-up at primary health care (PHC) centres participating in the project, were tested (Citation7-9). The results showed that this way of combining the work done by DC and PHC was highly feasible. In blood pressure screening a new incident hypertension diagnosis was found on average for every 18 subjects screened (number needed to screen (NNS) = 18), and a new incident diabetes diagnosis for every 196 subjects screened (NNS = 196).
The aim of this study was to analyse the direct costs of screening for hypertension and diabetes in DC, and for follow-up in PHC, and to arrive at a resource (staff time needed) prediction instrument by which screening and follow-up costs may be predicted.
Methods
Setting
In Sweden, the vast majority of medical care is operated by the county councils, which are responsible for health care in their geographical areas, either as county council-operated health care units or as private subcontractors, at the time of the study a minority. For DC the situation is similar, except that approximately half of the units are county council-operated and the remaining ones are private subcontractors. All units, whether operated by county councils or by private subcontractors, follow the same regulations.
This study was performed at two county council-operated DC clinics located in the municipality of Ovanåker (population 12,000) and one country council operated DC in the Strömsbro area of the city of Gävle (population 92,000), located in Gävleborg County, central Sweden. The three PHC centres in the municipalities, all county council-operated, were partners in the project and were responsible for calibration and quality of the blood pressure and blood glucose meters and for the blood pressure and blood glucose follow-up in subjects screening positive.
Study population
A detailed description of the study population has been given elsewhere (Citation8,9). Briefly, all consecutive patients scheduled for an annual examination at any of the clinics in Ovanåker and Strömsbro 2003–2005, and living in the area, were invited by letter to participate in the study.
The screening measurements were performed before the scheduled dental examination. Participants were asked for their height, weight, and whether they had a hypertension or a diabetes diagnosis. Those who did not know their height or weight had it measured, without shoes, on a fixed wall measure to the nearest centimetre or on a lever balance, wearing indoor clothing, to the nearest tenth of a kilogramme, respectively. Body mass index (BMI) was calculated as weight in kilogrammes/(height in metres)2, used to delineate the screening population and motivate screening in the younger ages.
Subjects with no known hypertension or diabetes and who were in the age range 20–39 with a BMI >25 kg/m2, or in the age range 40–65 (Ovanåker) or 40–75 (Strömsbro) regardless of BMI, were eligible for screening (). The study design was influenced by the fact that the PHC centre in Strömsbro agreed screening only for blood glucose and that blood pressure measurements could not be performed.
Figure 1. Flow chart displaying the number of participants in the screening process from dental care (DC) to the follow-up in primary health care (PHC).
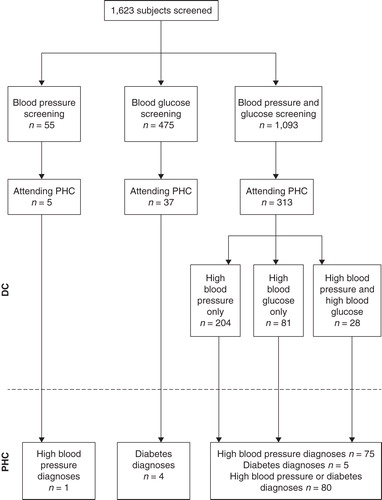
Of the 1,623 subjects who participated, 55 were screened for blood pressure only, 475 for blood glucose only, and 1,093 for blood pressure and blood glucose. Altogether, 1,149 were screened for blood pressure regardless of blood glucose screening, and 1,568 were screened for blood glucose regardless of blood pressure screening. Moreover, as shown previously, more restricted screening criteria (age ≥30 and body mass index (BMI) ≥30 or age ≥40 and BMI ≥25) resulted in lower NNS, and therefore this subpopulation was analysed as well. Thus six possible subgroups were analysed.
Data collection
Blood pressure was measured in a sitting position, in the left arm, after resting for 5 minutes, with an automatic blood pressure reading device Omron M4® (Omron Co, Kyoto, Japan). If systolic blood pressure was >160 mmHg or diastolic blood pressure was >90 mmHg, a second reading was taken after the dental examination and the lowest recorded value was used as the screening blood pressure.
Samples for non-fasting blood glucose analysis were obtained as capillary blood from the patient's third fingertip and analysed immediately with an Accu-chek Compact device (Roche Diagnostics Scandinavia AB, Stockholm, Sweden) or with a Hemocue B-glucose analyser (Hemocue AB, Ängelholm, Sweden).
Data measured at the DC clinics were registered in pre-prepared protocols and entered into the study database. Subjects with screening systolic blood pressure >160 mmHg, diastolic blood pressure >90 mmHg, or a screening blood glucose concentration of ≥6.7 mmol/l, were asked for permission to be referred to their PHC centre (all accepted). A copy of the dental service protocol served as referral document for follow-up at the subject's PHC centre, where an appointment was arranged. PHC follow-ups were standardized to three nurse appointments and one general practitioner (GP) appointment for blood pressure follow-up and two nurse appointments and one GP appointment for blood glucose follow-up.
Information on whether the referral resulted in a hypertension or diabetes diagnosis was obtained by scrutiny of patient records from all appointments at the three PHC centres for the complete study population, regardless of screening result, for the 3 years following the screening appointment. A 3-year follow-up time was estimated to be long enough to catch late-comers, and short enough to minimize the risk of hypertension or diabetes development among those not referred. To check for completeness, appointment log-books were also scrutinized. Data included date of appointment and GP and hypertension or diabetes nurse appointments diagnoses. Moreover, discharge diagnoses after hospital admissions within the 3 years following screening, obtained from the National Hospital Discharge register covering all hospital admissions in Sweden, were scrutinized for hypertension and diabetes diagnoses. Mortality data for those who died (date of death and underlying diagnoses) were obtained from the National Cause of Death Register.
PHC diagnoses, hospital discharge diagnoses, and mortality diagnoses were coded according to the International Classification of Diseases (ICD) (Citation10). The main outcome used was whether a hypertension or diabetes diagnosis was established during the first 3 years of follow-up from the date of screening.
The time per subject spent on the screening procedure (screening time) was measured in minutes and entered into the study database. It included history-taking regarding inclusion criteria (known hypertension or diabetes, age, height, weight, and in some instances measurements of height and weight), blood pressure or blood glucose measurements, and data registration, but not time for writing and sending invitation letters or other administrative procedures.
Cost calculations
Only direct costs were measured. Information on wages, employer's fees, institutional overheads, accountable time, and measurements costs were obtained from the Swedish Association of Local Authorities and Regions (Citation11), and from the Gävleborg County Council central administration. All Swedish employers pay employer's fees to the central government, calculated as a percentage of the gross wages of each employee and used to cover national health insurance fees, pensions, etc. Institutional overheads are charged on all financial transactions in health care units, to cover administration costs. Accountable time is the fraction of working time that can be charged for, in this case direct health care activities, and was estimated to be 65%. The remaining working time, used for administration, preparations for new work tasks, etc., is the unaccountable time which, although not chargeable, has to be covered.
The following cost analysis models were used:
DC costs: number of screened subjects, multiplied by screening time adjusted for unaccountable time, multiplied by wages adjusted for employer's fee and overhead costs, plus analysis costs.
PHC costs: number of follow-up appointments, multiplied by consultation time adjusted for unaccountable time, multiplied by wages adjusted for employer's fees and overhead costs, plus analysis costs.
All costs are given in euros (€), €1 approximately corresponding to 9 SEK and US$1.4. In DC dental hygienists performed the screening. The crude price per screening minute was €0.29 (). At the PHC centres, hypertension, diabetes, or district nurses performed the initial follow-up (including history-taking and repeated blood pressure and blood glucose measurements), and a GP made the final decision as to whether the subject had a hypertension or a diabetes diagnosis. The crude minute costs for a nurse was €0.29, and for a GP €0.67. The employer's fee was 43% for all three staff types, and the overhead costs were 36% in PHC and 50% in DC. The total minute price was then €0.62 in DC, €0.56 for nurses, and €1.30 for GPs. The cost per blood glucose analysis was €0.64 at all units. For blood pressure measurements there were no specific costs other than time for measurements.
Table I. Financial characteristics. All costs are given in euros.
Blood pressure screening only, blood glucose screening only, or both types of screening on the same occasion formed the three screening groups. Cost per diagnosis in DC was obtained by multiplying price per screened subject by the numbers needed to screen (NNS) to identify a person with undiagnosed diabetes. NNS was computed as the reciprocal of the proportion of new cases found by screening minus the number of subjects who would have been detected anyway (Citation1,12).
In PHC, the standard follow-up was three appointments with blood pressure measurements performed by a nurse or two appointments with fasting blood glucose measurements performed by a nurse, in both cases followed by a single appointment with the GP for diagnosis assessment. The total time used for follow-up was the number of subjects multiplied by number of appointments per person, and the total wages cost was total time used multiplied by price per minute. Total price per subject for follow-up was total wages cost for nurses and GPs plus analysis costs divided by number of subjects followed up, and total price per diagnosis was total price divided by number of diagnoses.
Data were analysed with the SAS software, version 9.3 (Citation13). The relationship between resource use and NNS was analysed with linear regression, using crude data as well as data weighted by subpopulation size. Both types of analyses gave similar results. Therefore, only crude data analysis results are shown. R2 was used as measure of degree of explanation. P < 0.05 indicated statistical significance.
Ethics
All participants gave their written informed consent. The study was performed in accordance with the Helsinki Declaration and was approved several times during the data collection process by the Research Ethics Committee at Uppsala University and later by the Regional Research Ethics Board.
Results
Characteristics of the study population
Approximately half (50.5%) were women. Mean age was 48.0 years (standard deviation (SD) 10.5), and mean BMI was 26.4 (SD 4.0). Mean screening systolic blood pressure was 135.1 (SD 20.0) mmHg, mean diastolic blood pressure 82.1 (SD 11.2) mmHg, and mean blood glucose 5.4 (SD 1.1) mmol/l.
After adjustment for unaccountable time in DC, the time used for screening of high blood pressure or high blood glucose was 12.0 minutes, and time used for screening of both conditions was 13.8 minutes. After adjustment for unaccountable time in PHC, the time for a follow-up consultation was 30.8 minutes for subjects screening positive for high blood pressure only, 15.4 for a follow-up consultation for high blood glucose only, and 30.8 minutes for a follow-up appointment for both conditions. The GP consultation time was estimated to be 30 minutes.
Screening and follow-up costs
The cost calculations were based on the six subgroups mentioned previously (). The NNS levels found covered a broad range, 15–196. The analysis costs were marginal as compared with salary costs. Total screening costs per screened subject were similar in all subgroups (range €7.44–9.20). The costs for the PHC follow-up were higher, but fairly similar in the subgroups (range €57–91). The total resources used for screening and follow-up per screened subject were 16.7–42.7 staff minutes, and the analysis cost range was €0–0.80 depending on subgroup. The corresponding resource use per diagnosed subject was 563–3,137 staff minutes.
Table II. Resource use in terms of time (minutes) and costs (€) in blood pressure and blood glucose screening.
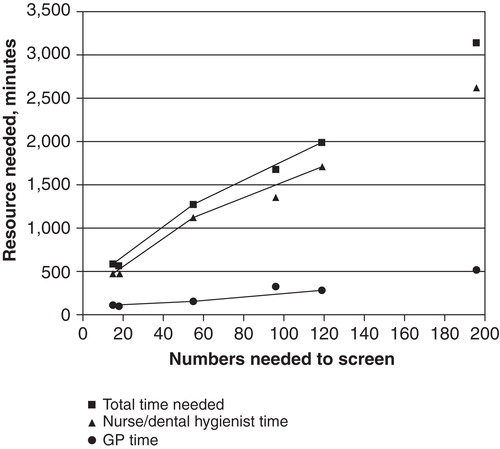
The resource use range was thus rather narrow per screened subject but considerably wider per diagnosed subject. To analyse whether the latter condition was due to the variable NNS levels the resource use measured as staff minutes was plotted against NNS (). There was an obvious linear relationship, irrespective of subgroup, between nurse/dental hygienist time per diagnosed subject and NNS (P < 0.0001), GP time and NNS (P < 0.001), and total time used per diagnosed subject and NNS (P < 0.0001). The functional form for the last-mentioned relationship was time used = 371 + 14.0 × NNS. The degree of explanation was 99%.
Figure 2. Relationship between numbers needed to screen (NNS) to find one case ending up with a diagnosis, and resources needed in the form of nurse/dental hygienist time, GP time, and total nurse-dental hygienist-GP time. Solid lines indicate results based on screening for blood pressure only, blood glucose only, or combined screening. Symbols with no line indicate results based on other subgroups (cf. ).
Discussion
The screening cost per screened subject was thus moderate, as compared with the follow-up costs for those screening positive. The costs for high blood pressure screening were lower than the corresponding costs for blood glucose screening and the combined screening because of lower analysis costs. However, the cost for follow-up was lower for those screening positive for blood glucose than for those screening positive for blood pressure, owing to the need of more follow-up visits among the latter. The total cost per diagnosis found was lowest for combined blood pressure and blood glucose screening, since two possible diagnoses were being sought.
The strengths of this study include that the screened cohort was fairly large, the measurement procedures were standardized, and the equipment was provided and calibrated by the participating PHC. The follow-up procedures were standardized, and follow-up was complete in the sense that the screened subjects who did or did not appear for follow-up were included and very few were lost to follow-up.
The limitations include the scanty clinical information from PHC. However, we have reason to believe that the PHC centres were following the national guidelines for hypertension and diabetes diagnosis assessment, or local practice recommendations based on established guidelines. Furthermore, the time required for the diagnosis assessment by the GP had to be estimated (Citation14), and the time spent for checking inclusion criteria for those not fulfilling the criteria had to be neglected. The assumption that all referred subjects had a final follow-up consultation with the GP may be an over-estimate. The nurse may have forwarded the GP's decision to the subjects. However, even in this situation the GP had to spend time making the assessment, and in any case this circumstance probably affected all groups equally.
The stakeholders potentially considering the results of this study include DC or PHC centres planning screening activities, since either the patient or his or her insurance company, or as in the Swedish setting the National Social Insurance, a government agency, pays for the screening activity. A third party, at least in countries with a national social insurance system, may be the body responsible for primary prevention, in Sweden the County Councils, for which the costs per diagnosis found are important, since this cost is a measure of screening effectiveness.
The time spent by the dental staff per subject screened, 8–9 minutes, is similar to time reported from other studies (Citation15). The total screening cost per screened subject in DC was €7.4 for blood pressure screening only, €8.1 for blood glucose only, and €9.2 for combined blood pressure and blood glucose screening. It is obvious that history-taking, information, and creating a calm screening atmosphere all influence the total screening time more than the time for the actual screening procedure at the DC. This appears to be the reason why screening for blood pressure and blood glucose took only marginally more time than screening for a single abnormality. The screening costs were low compared to the corresponding follow-up costs in PHC.
The NNS for blood glucose screening only is high as compared with those reported from other studies (Citation16,17). In the previous blood glucose screening study from this project it was shown that by narrowing the screening population a NNS level of 96 could be achieved (Citation9). A more targeted study population of this kind might have decreased DC costs by about 50%, and total costs, including all follow-up costs, might have been substantially lower.
The cost for finding undiagnosed subjects with diabetes varies with study population, cut-off level, and general health care cost level. A study performed in the USA in subjects aged 45–74 years showed that the most efficient cut-off level was approximately 6.7 mmol/l, the same as in this study, resulting in a total screening and follow-up cost ranging from $392 to $671 (€280 to €479) per case. If indirect costs, such as patient travel costs and patient wage loss, were included, the costs ranged from $504 to $990 (€360 to €707) (Citation18). Opportunistic screening, as used in this study, carries no extra costs for patient time spent on travelling for the screening procedure at the dental care appointment.
The relationship between resource use, measured as staff time used, and NNS proved to be very strong and almost linear. Based on this finding it may be possible to calculate resource need for screening in advance, based on measured or assumed NNS. This is a novel finding, not presented earlier.
Conclusions
Using DC for opportunistic screening is a new avenue for early detection of diabetes and high blood pressure. The total resource need for screening and follow-up per diagnosis seems to be lower when blood pressure screening is combined with blood glucose screening as compared to separate screening for the two disease entities. Resource need may be calculated based on known or assumed NNS.
Acknowledgements
This study was supported by grants from the Centre for Clinical Research at Uppsala University/Gävleborg county council, the Public Dental Service, Gävleborg county council, and Uppsala University. Special thanks go to the staff at the dental and primary health care centres where the study was performed.
Declaration of interest: The authors report no conflicts of interest. The authors alone are responsible for the content and writing of the paper.
References
- Waugh N, Scotland G, McNamee P, Gillett M, Brennan A, Goyder E, et al. Screening for type 2 diabetes: literature review and economic modelling. Health Technol Assess. 2007;11:iii–v; ix–xi, 1–125.
- SBU. Moderately elevated blood pressure. A report from SBU, The Swedish Council of Technology Assessment in Health Care. J Intern Med 1995; 238 Suppl 737: 1–225.
- Clarke P, Gray A, Adler A, Stevens R, Raikou M, Cull C, et al. Cost-effectiveness analysis of intensive blood-glucose control with metformin in overweight patients with type II diabetes (UKPDS No. 51). Diabetologia. 2001;44:298–304.
- Williams R, Van Gaal L, Lucioni C. Assessing the impact of complications on the costs of Type II diabetes. Diabetologia. 2002;45:13–17.
- Herman WH. The economics of diabetes prevention. Med Clin North Am. 2011;95:373–84; viii.
- Hugoson A, Koch G, Gothberg C, Helkimo AN, Lundin SA, Norderyd O, et al. Oral health of individuals aged 3–80 years in Jonkoping, Sweden during 30 years (1973–2003). I. Review of findings on dental care habits and knowledge of oral health. Swed Dent J. 2005;29:125–38.
- Engström S, Gahnberg L, Högberg H, Svärdsudd K. Association between high blood pressure and deep periodontal pockets. A nested case-referent study. Upsala J Med Sci. 2007;112:95–103.
- Engstrom S, Berne C, Gahnberg L, Svardsudd K. Efficacy of screening for high blood pressure in dental health care. BMC Public Health. 2011;11:194.
- Engstrom S, Berne C, Gahnberg L, Svardsudd K. Effectiveness of screening for diabetes mellitus in dental health care. Diabet Med. 2013;30:239–45.
- ICD. Available at http://www.who.int/classifications/icd/en/index.html.(accessed 2 February, 2013)
- Socialstyrelsen. Hälsoekonomiskt vetenskapligt underlag. Nationella riktlinjer för vuxentandvården [Health Economic Consensus Report. National guidelines for adult dental care in 2011. Available at http://www.socialstyrelsen.se/publikationer 2011//Documents/halsoekonomiskt-veten-skapligt-underlag-vuxentandvardpdf 2011. (accessed 2 February, 2013)
- Bandolier. Available at www.medicine.ox.ac.uk/bandolier/band59/NNT.1.html#Heading5. (accessed 15 February 2010).
- SAS. Statistical Analysis System. Available at http://www.sas.com/technologies/analytics/statistics/stat/factsheet.pdf. (accessed 20 February 2012).
- Hoerger TJ, Harris R, Hicks KA, Donahue K, Sorensen S, Engelgau M. Screening for type 2 diabetes mellitus: a cost-effectiveness analysis. Ann Intern Med. 2004;140:689–99.
- Chatterjee R, Narayan KM, Lipscomb J, Phillips LS. Screening adults for pre-diabetes and diabetes may be cost-saving. Diabetes Care. 2010;33:1484–90.
- O’Connor PJ, Rush WA, Cherney LM, Pronk NP. Screening for diabetes mellitus in high-risk patients: cost, yield, and acceptability. Eff Clin Pract. 2001;4:271–7.
- Toscano CM, Duncan BB, Mengue SS, Polanczyk CA, Nucci LB, Costa e Forti A, et al. Initial impact and cost of a nationwide population screening campaign for diabetes in Brazil: a follow up study. BMC Health Serv Res. 2008;8:189.
- Zhang P, Engelgau MM, Valdez R, Cadwell B, Benjamin SM, Narayan KM. Efficient cutoff points for three screening tests for detecting undiagnosed diabetes and pre-diabetes: an economic analysis. Diabetes Care. 2005;28:1321–5.