Abstract
Introduction. Morphological evidence for reinnervation of pancreatic islet grafts is plentiful. However, to what extent intra-graft nerves influence the endocrine functions of the islet transplant is largely unknown. We therefore aimed to directly stimulate nerves leading to islet grafts with electrodes and measure insulin secretion in response to this.
Methods. We implanted syngeneic islets under the renal capsule of rats, and examined them 1 or 7–9 months later. In anesthetized rats blood samples were collected from the renal vein and femoral artery, respectively, during electrode stimulation of the nerves leading to the islet grafts.
Results. As expected, nerve stimulation decreased renal blood flow. However, serum insulin concentrations in samples derived from the renal vein or femoral artery changed in concert with one another, both during normoglycemia and acute hyperglycemia.
Conclusion. Reinnervation which occurs after islet transplantation under the renal capsule has minor effects on graft endocrine function.
Introduction
The endocrine pancreas contains a rich and complex innervation, encompassing sympathetic, parasympathetic, sensory, peptidergic, entero-pancreatic, and nitric oxide synthase-containing neurons (Citation1-3), all of which have important modulating effects on the secretion of islet hormones. In general, insulin secretion is stimulated by parasympathetic and inhibited by sympathetic nerves or their neurotransmitters (Citation1,2,4,5). In addition to nerve fibers, some islets also contain nerve cell bodies, so called neuro-insular complexes (Citation6), and most islets seem to be surrounded by Schwann cells (Citation7,8).
To what extent reinnervation occurs after transplantation of pancreatic islets has been studied extensively from a morphological point of view (Citation9). During the first week after implantation some nerve cells survive, but they disappear soon thereafter (Citation10). Reinnervation predominantly from sympathetic nerves occurs during the next 3–4 months, mainly by axonal ingrowths along the blood vessels (Citation11-13). Nerve-mediated effects on graft blood perfusion appear with time, as demonstrated after implantation of fetal islets (Citation14). Effects of intra-graft nerves on endocrine transplant function have, however, not been demonstrated other than by indirect means (Citation9). However, in a recent series of experiments it has been demonstrated that islets implanted into the anterior chamber of the eye become reinnervated and functionally affected by mainly parasympathetic nerves, even though mouse strain differences were noted (Citation15). The aim of the present study was to evaluate functionally if intra-graft nerves affect insulin secretion from the grafts by directly stimulating these nerves with electrodes. To achieve this we implanted syngeneic islets under the renal capsule of rats, i.e. at a site where mainly sympathetic reinnervation occurs, and examined them 1 or 7–9 months later.
Materials and methods
Animals
Male, inbred Wistar-Furth rats weighing 300–350g were purchased from Scanbur (Sollentuna, Sweden). All animals had free access to tap water and pelleted rat food throughout the experiments. All experiments were approved by the local animal ethics committee at Uppsala University.
Islet isolation and transplantation
Pancreatic islets were isolated by a collagenase digestion method, as previously described (Citation16). The islets were cultured free-floating, with 150 islets in each culture dish, in 5 ml culture medium, RPMI 1640 (Sigma-Aldrich; Stockholm, Sweden) supplemented with L-glutamine (Sigma-Aldrich), 11.1 mmol/l D-glucose, benzyl penicillin (100 U/ml; Roche Diagnostics Scandinavia, Bromma, Sweden), streptomycin (0.1 mg/ml; Sigma-Aldrich), and 10% (vol/vol) fetal calf serum (Sigma-Aldrich). The medium was changed every second day.
A total of 17 syngeneic male, Wistar-Furth rats were used as recipients. These animals were anesthetized with an intraperitoneal injection of ekvicitine (a mixture of pentobarbital and chloral hydrate). The left kidney was exposed through a flank incision, and 250 islets were implanted under the renal capsule. An additional 12 rats served as untreated, age-matched control animals.
Surgical preparation of the animals for nerve stimulation
The transplanted or age-matched control rats were anesthetized with an intraperitoneal injection of thiobutabarbital (Inactin™; Research Biochemicals, Natick, MA, USA; 120 mg/kg) 1 or 7–9 months after transplantation. The animals were placed on a servo-controlled heated operating table to maintain body temperature and breathed spontaneously through a tracheostomy. Polyethylene catheters were inserted into the femoral artery and vein. The arterial catheter was connected to a pressure transducer (PDCR 75/1; Druck Ltd, Groby, UK), thereby allowing constant monitoring of the mean arterial blood pressure, whereas the venous catheter was used to infuse Ringer solution continuously (6 ml/kg body weight/h).
A subcostal left flank incision was made to visualize the graft-bearing left kidney. The kidney and its vascular stalk was gently dissected free from surrounding tissues and immobilized in a lucite cup. Through the suprarenal vein a catheter was inserted with its tip in the lumen of the renal vein to allow for blood sampling. The nerve plexus of the renal artery was then located. Between this plexus and the kidney one or several fairly large (diameter approximately 0.2–0.3 mm) discrete nerves, usually accompanied by a small blood vessel, could be seen with the aid of the operating microscope (Citation17), and this was used for the subsequent stimulations. Some of the nerve fibers were embedded in the adventitia of the renal artery and vein. The nerves were carefully dissected free from surrounding tissues as atraumatically as possible. After this, the nerves were hooked on to a bipolar 100 µm thick platinum-iridium electrode. Stimulation was made with a custom-made pulse generator and isolated stimulator with square-wave signals. The width of these signals was 1 ms and the intensity 5 V, with a frequency of 5–10 Hz.
To control that the nerve stimulation induced a physiological response we continuously recorded renal blood perfusion. To achieve this we used an ultrasound flow probe (IRB/206; Transonic Systems Inc., Ithaca, NY, USA). The probe was, after careful dissection, placed around the central parts of the renal artery. An ultrasound gel was applied around the probe, and the kidney was then embedded in pieces of cotton wool soaked in Ringer solution and covered with mineral oil (Apoteksbolaget; Uppsala, Sweden) heated to body temperature to prevent evaporation and thereby keeping the kidney moist and at body temperature.
Experimental protocol
After an initial equilibration period of approximately 30 min, blood samples (50 µl each) were obtained from the femoral artery and the renal vein and stored in heparinized microcapillary tubes (110.690; Kebo Grave, Stockholm, Sweden). Nerve stimulation was then initiated (1 ms, 5 V, 10 Hz) and maintained for 60–90 s. During this time period blood samples were again secured. A 10-min resting period followed, and at the end of this period new blood samples were obtained. A second nerve stimulation, similar to the first one, with simultaneous blood sampling was then performed, once again followed by a 10-min long resting period.
After this 1 ml of a 30% (w/v) D-glucose solution was given intravenously. Three minutes later blood samples were secured. An additional 2 min later a third nerve stimulation with simultaneous blood sampling was performed. This means that a total of 14 blood samples, amounting to a volume of approximately 700 µl, were taken from each animal. The graft-bearing kidney was removed and fixed in 4% formaldehyde, after which the animal was killed by an intravenous injection of saturated KCl.
Throughout the experiment renal blood flow was monitored, and the effectiveness of the nerve stimulation was assessed by the induced decrease in renal blood perfusion, which amounted to a 30–70% decrease from the basal value.
Whenever blood samples from the renal vein and femoral artery were obtained, blood glucose concentrations were measured with test reagent strips (MediSense Svenska AB, Stockholm, Sweden) on blood secured from the femoral artery.
Analysis of blood samples
The microcapillary tubes were centrifuged and the hematocrit was recorded. Serum was then removed and stored at –20°C. These samples were later analyzed for insulin content with an ELISA technique (Supersensitive Rat ELISA®; Mercodia AB, Uppsala, Sweden).
Morphological examination
The formaldehyde-fixed kidneys were dehydrated, embedded in paraffin, and sectioned to a thickness of 4 µm. The sections were placed onto Superfrost/plus® slides (Braunschweig, Mentzel, Germany), deparaffinized in xylene, and rehydrated in graded alcohols. Incubation with Peroxidase blocking reagent® (DAKO, Stockholm, Sweden) for 10 min, to block endogenous peroxidase, was followed by washing in Wash buffer® (DAKO). The PGP 9.5 antibody (Dakopatts, Glostrup, Denmark) diluted 1:100 in Antibody diluent with background reducing components® (DAKO) was incubated for 30 min at room temperature followed by washing in Wash buffer®. The ChemMate EnVision detection kit® (DAKO, Stockholm, Sweden) was used according to the manufacturer's instructions. The EnVision kit® was developed with diaminobenzidine before being counterstained with hematoxylin. The sections were dehydrated and mounted in Pertex® mounting medium (HistoLab, Göteborg, Sweden). Negative control slides were processed identically except that the primary antibody was omitted. The immunohistochemical staining was done at room temperature using an automated immunostaining instrument (Autostainer plus®; DAKO).
Statistical method
All values are given as means ± SEM. Probabilities (P) of chance differences between the groups were calculated with Student's paired or unpaired t test or ANOVA. All calculations were made with SigmaStat® (SSSP; Erfart, Germany).
Results
All rats tolerated the transplantation without any complications, and no signs of infirmity were noted. A total of two transplanted animals were excluded from the study since the surgical preparation and identification of nerves failed.
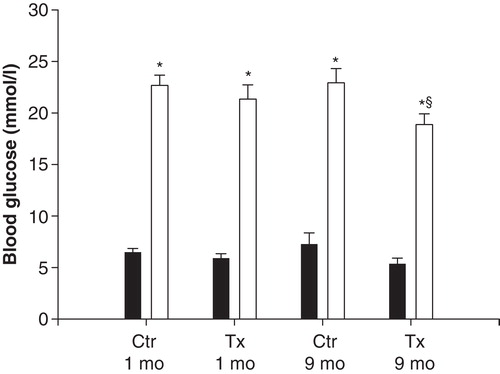
The body weight of the animals was similar in transplanted and non-transplanted rats of the same age (data not shown). Blood glucose concentrations were similar at the beginning of the experiment in all animals, and they all responded with a prompt increase after glucose administration (). The glucose response 3 min after injection of exogenous glucose in 9-month-old control rats was slightly lower than in the other groups (). Mean arterial blood pressure varied between 100 and 120 mmHg in all animals, and did not differ between the groups (detailed data not shown). Likewise hematocrit, which remained at 44%–46%, was similar in all animals.
Figure 1. Blood glucose concentrations in anesthetized, islet-transplanted (Tx) Wistar-Furth rats, 1 or 9 months after transplantation. Ctr represents age-matched, non-transplanted rats. Samples were taken after surgical preparation (black bars) or 3 min after an intravenous injection of 1 ml 30% D-glucose (grey bars). Values are means ± SEM for 5–9 experiments. *P < 0.001 when compared to the corresponding basal value (Student's unpaired t test); § P < 0.05 versus other glucose-stimulated groups as calculated with ANOVA.
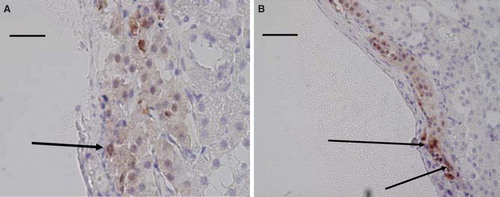
Occasional nerve cells () as well as nerve fibers within the grafts, and especially so around blood vessels, were seen in all studied specimens (), and more extensively in the older age group. Due to the scarcity of the nerves no attempts at quantification were made.
Figure 2. Light micrographs of islet transplants under the renal capsule 1 month (A) and 8 months (B) after transplantation. The sections were immunohistochemically stained for the presence of PGP 9.5 and counterstained with hematoxylin. A neuron (arrow) can be seen in A, and a blood vessel with positive nerves in the adventitia in B. Scale bar 100 µm in A and 200 µm in B.
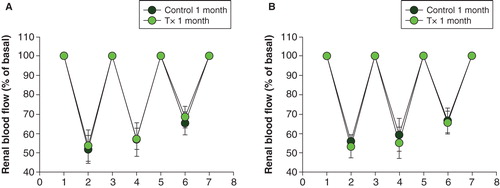
Renal blood flow was higher in transplanted rats implanted 9 months earlier than in the other groups (). When renal nerves were stimulated with an electrode, renal blood flow decreased to the same extent in transplanted and non-transplanted animals in both age groups. However, the third stimulation was less pronounced in all groups (; P < 0.01 when compared to the basal values for all comparisons with ANOVA on ranks).
Figure 3. Left kidney blood flow measured, after surgical preparation, with an ultrasound flow probe in anesthetized, islet-transplanted (Tx) Wistar-Furth rats, 1 or 9 months after transplantation. Ctr represents age-matched, non-transplanted rats. Values are means ± SEM for 5–9 experiments. *P < 0.05 when compared to the other groups as calculated with ANOVA.
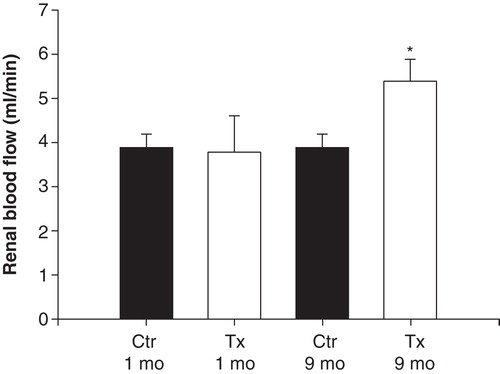
Figure 4. Renal blood flow as a fraction of renal basal blood flow (given as 100% at 1, 3, 5, and 7; for absolute values, see ) during the three nerve stimulations (at 2, 4, and 6) in islet-transplanted rats (grey dots) and non-transplanted control rats (black dots), 1 month (A) or 9 months (B) after transplantation. Values are means ± SEM for 5–9 experiments. See ‘Materials and methods' for further details.
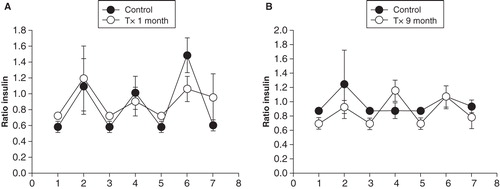
In all test groups the ratio between insulin concentrations in samples from the renal vein and femoral artery varied between 0.6 and 0.8 during basal conditions (). After glucose administration the ratio increased in both control and transplanted rats except in the 9-month-old control rats (). The most pronounced increase (P < 0.05 compared to the other groups; ANOVA on ranks) was seen in the 1-month control rats. There were no differences in the ratio between serum insulin concentrations in the renal vein and femoral artery during any of the nerve stimulations ().
Figure 5. Ratio between serum insulin concentrations in samples from the left renal vein and femoral artery during basal conditions (black bars) and 3 min after an intravenous injection of 1 ml 30% D-glucose (grey bars) in transplanted (Tx) and non-transplanted control (Ctr) rats, 1 or 9 months after transplantation. Values are means ± SEM for 5–9 experiments. *P < 0.05; **P < 0.01 when compared to the corresponding basal value (Student's unpaired t test).
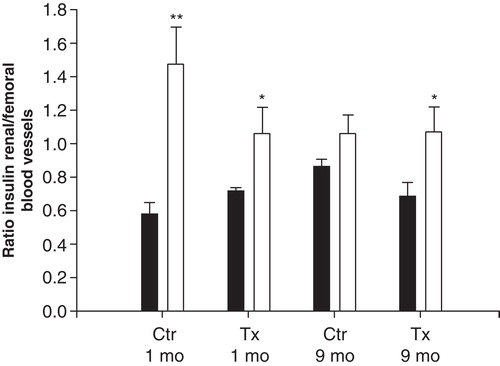
Figure 6. Ratio of serum insulin concentrations in samples from the renal vein and femoral artery during the three nerve stimulations (at 2, 4, and 6) in transplanted (grey dots) and non-transplanted control (black dots) rats, 1 (A) or 9 months (B) after transplantation. The value at basal conditions (1, 3, 5, and 7) is normalized to 1 (for absolute values see ). Values are means ± SEM for 5–9 experiments. See ‘Materials and methods' for further details.
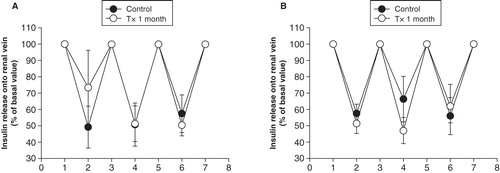
Renal flow values and insulin concentrations in the renal vein were used to calculate the amount of insulin released into the renal vein during basal conditions () and during glucose stimulation (). As expected, the amount of insulin markedly increased after glucose administration (P < 0.001 for all comparisons against normoglycemic control groups with ANOVA). However, there were no differences when values during basal conditions and hyperglycemia, respectively, were compared between transplanted and non-transplanted rats ( and 7B). During nerve stimulation the amount of insulin released into the renal vein decreased to the same extent in transplanted and non-transplanted control rats 1 month () or 7–9 months () after transplantation.
Figure 7. Total amount of insulin released into the left renal vein in transplanted (grey bars) and non-transplanted control (black bars) rats, 1 month or 9 months after transplantation during basal conditions (A) and 3 min after an intravenous injection of 1 ml 30% D-glucose (B). Values are means ± SEM for 5–9 experiments.
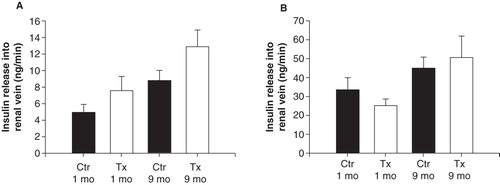
Figure 8. Total amount of insulin released into the left renal vein during the three nerve stimulations in transplanted (grey dots) and non-transplanted control (black dots) rats, 1 month (A) or 9 months (B) after transplantation. The value at basal conditions is normalized to 100% (for absolute values see ). Values are means ± SEM for 5–9 experiments.
Discussion
Previous experimental studies have demonstrated that reinnervation occurs in transplanted pancreatic islets, even though it usually takes several months until any significant number of nerves can be recognized (Citation9,11,15). The types of nerves differ from those seen in endogenous islets (Citation9,11,18), mainly encompassing sympathetic nerves in association with blood vessels, a finding which was confirmed in the present study. This is likely to reflect the choice of implantation organ, since parasympathetic nerves have been demonstrated in islets grafted in the anterior eye chamber (Citation15).
We identified nerves adjacent to the renal artery and vein under a stereo-microscope during surgery, and after careful dissection it was possible visually to ascertain that some branches from the nerves that we stimulated entered the islet graft. The nerves, ramifying into both the renal and islet parenchyma, were then stimulated with electrodes in a way similar to that used in our previous studies on whole kidneys (Citation17). This was the reason for us to choose this implantation site, since it allowed us to confirm in vivo that the nerves we stimulated really entered the graft. It should be noted that we cannot evaluate to what extent we stimulate both efferent and afferent nerves, or if they belonged to the sympathetic or parasympathetic nervous system. There are suggestions that neurotransmitters characteristic of afferent nerves, e.g. calcitonin gene-related peptide (CGRP) and substance P, can be found in islet grafts implanted under the renal capsule (Citation9,18), but their importance for graft function is unknown. There is a marked increase in CGRP-containing nerves after experimental whole-pancreas transplantation (Citation19), but, despite this, graft insulin secretion is unaffected. This argues against an important contribution of these intrapancreatic nerves for metabolic regulation. In the endogenous pancreas CGRP reduces islet blood perfusion (Citation20), but if this is the case also in transplanted islets is at present unknown.
In view of previous studies in islets, suggesting that mainly sympathetic reinnervation occurs, even though this depends somewhat on the implantation site (Citation10,13,21), we believe that stimulation of intra-graft nerves would mainly release sympathetic neurotransmitters such as noradrenaline and neuropeptide Y. These substances preferentially inhibit insulin secretion (Citation1,2). However, there were only minor effects on the release of insulin into the renal vein, which drains also the islet grafts. This would argue against that any functionally meaningful reinnervation occurs, at least at this implantation site. This is in contrast to some previous experiments where physical exercise induced a decrease in serum insulin concentration from islets implanted into the liver in rats, also after adrenalectomy (Citation22,23). Also direct stimulation of hepatic nerves in the perfused liver of rats transplanted intraportally with neonatal islets demonstrated an inhibition of insulin release 9 months post-transplantation (Citation24), presumably through α2-adrenoceptors (Citation25). Islets implanted into the portal vein also exhibit pulsatile insulin secretion, which is likely to be due to reinnervation (Citation26-28). It is also worthy of note that exercise in islet-transplanted rats leads to hypoglycemia, irrespective of whether the grafts are located in the liver, kidney, or the peritoneal cavity (Citation29). The last-mentioned finding was interpreted to reflect an islet dysfunction per se, and since it was seen also in animals carrying microencapsulated islets it is difficult to reconcile the findings with the presence of reinnervation.
Thus, there are several studies suggesting that reinnervation affecting islet graft function may occur. The question is why we did not see this in our study. One possibility is that it varies depending on the implantation organ or animal strain used. Most of the studies referred to above were performed in intraportally transplanted rats, whereas we used intrarenal, subcapsularly grafted islets. Studies on nerve stimulation of islets implanted into the liver showed that such islets stimulate hepatocyte glycogenolysis (Citation30,31). Thus, the local release of glucose and other substances within the liver during nerve stimulation and perfusion may affect the local milieu of the implanted islets. It may also be that there are differences in functional importance of reinnervation between these sites (Citation13).
As a control that the nerve stimulation was sufficient to induce a physiologic response we continuously measured renal blood flow with an ultrasound-Doppler device and found a pronounced decrease in blood perfusion whenever we stimulated the renal nerves. It can of course be argued that possible changes induced by nerve stimulation were masked by the simultaneous reduction in blood flow. However, in view of the results in studies suggesting a role for intra-graft nerves, i.e. a reduction in insulin secretion, such an effect would be even more pronounced if studied during vasoconstriction. In the present study we also mainly observed sympathetic nerves, which are more prone to inhibit insulin secretion (Citation1). Thus, in our opinion the reduced renal blood flow is unlikely to explain our findings.
We chose to collect blood for insulin measurements both from the renal vein, representing insulin preferentially released from the transplanted islets but also from the endogenous islets, as well as from the femoral artery. To what extent the latter contains insulin primarily due to graft or endogenous insulin production is difficult to ascertain. To interpret this, the vascular anatomy of the graft must be taken into consideration. The afferent, arterial blood vessels to grafts under the renal capsule are derived from the interlobular arteries and thereby penetrate the graft from below, i.e. the renal side (Citation32,33). The venous outflow is derived mainly from large vessels on the surface of the graft, which empties into intralobular veins some distance from the grafts (Citation34,35). Thus, the venous outflow contains a mixture of blood from the islet graft and the renal parenchyma. During normal blood glucose concentrations the ratio between insulin in the renal vein and femoral artery was approximately 0.6–0.8 in both transplanted and control rats, that is, the systemic insulin concentrations were higher than those in the renal vein. Besides the liver, the kidney is normally the major site of insulin removal from the systemic circulation with approximately 50% of peripheral insulin removed by this organ (Citation36). The major route is by glomerular filtration, followed by proximal tubular reabsorption and intracellular degradation or transcellular transport (Citation37,38). Insulin is cleared also from the post-glomerular, peritubular circulation by receptor-mediated processes (Citation39). Thus, the ratio we have measured can be accounted for by renal degradation of insulin, especially that from the systemic circulation, namely the endogenous pancreas. As outlined above, the insulin released from the graft is unlikely to be affected by renal degradation for anatomical reasons and can explain that our measured femoral vein insulin constitutes 60%–80% of that of the systemic circulation.
During hyperglycemia, i.e. stimulated insulin secretion, the ratio between insulin concentrations in the renal and femoral vein was approximately 1.2–1.4 in both control and transplanted rats. This is likely to reflect the higher systemic insulin concentrations, allowing more insulin to escape destruction in the kidney. Interestingly, the finding also suggests that the contribution from the graft is minor during hyperglycemia, since the values are similar in transplanted and control rats.
The major finding in the present study was that the reinnervation occurring after islet transplantation seems to be of minor importance for the insulin release from the grafted islets.
Another issue of interest with regard to nerves is the finding that the autoimmune assault in type 1 diabetes is not restricted to the islet β-cells, but also encompasses intra-islet nervous structures (Citation40). It has even been suggested that autoimmunity against such nervous structures might be involved in triggering the attack also on β-cells (Citation41). If, and to what extent, nervous structures in islet grafts can be subjected to or help to trigger an autoimmune assault post-transplantation remains to be established.
Acknowledgements
Financial support was received from the Swedish Medical Research Council (55X-00109), the Swedish Diabetes Association, the Juvenile Diabetes Research Foundation, and the Family Ernfors Fund.
Declaration of interest: The authors report no conflicts of interest. The authors alone are responsible for the content and writing of the paper.
References
- Ahrén B. Autonomic regulation of islet hormone secretion--implications for health and disease. Diabetologia. 2000;43:393–410.
- Ahrén B, Taborsky GJ Jr, Porte D Jr. Neuropeptidergic versus cholinergic and adrenergic regulation of islet hormone secretion. Diabetologia. 1986;29:827–36.
- Rodriguez-Diaz R, Abdulreda MH, Formoso AL, Gans I, Ricordi C, Berggren PO, et al. Innervation patterns of autonomic axons in the human endocrine pancreas. Cell Metab. 2011;14:45–54.
- Dunning BE, Taborsky GJ Jr. Neural control of islet function by norepinephrine and sympathetic neuropeptides. Adv Exp Med Biol. 1991;291:107–27.
- Holst JJ. Neural regulation of pancreatic hormone secretion. Clin Physiol. 1985;5:34–42.
- Persson-Sjögren S. Neuroinsular complex type I: morphology and frequency in lean and genetically obese mice. Pancreas. 2001;23:40–8.
- Teitelman G, Guz Y, Ivkovic S, Ehrlich M. Islet injury induces neurotrophin expression in pancreatic cells and reactive gliosis of peri-islet Schwann cells. J Neurobiol. 1998;34:304–18.
- Sunami E, Kanazawa H, Hashizume H, Takeda M, Hatakeyama K, Ushiki T. Morphological characteristics of Schwann cells in the islets of Langerhans of the murine pancreas. Arch Histol Cytol. 2001;64:191–201.
- Persson-Sjögren S, Forsgren S, Täljedal IB. Peptides and other neuronal markers in transplanted pancreatic islets. Peptides. 2000;21:741–52.
- Persson-Sjögren S, Forsgren S, Rooth P, Täljedal IB. Initial increase and subsequent loss of vasoactive intestinal polypeptide immunoreactivity in acetylcholinesterase-positive neurons of mouse islets transplanted to the kidney. Cell Tissue Res. 1996;284:391–400.
- Korsgren O, Andersson A, Jansson L, Sundler F. Reinnervation of syngeneic mouse pancreatic islets transplanted into renal subcapsular space. Diabetes. 1992;41:130–5.
- Präst I, Carlsson PO, Jansson L, Mattsson G. Nerve cells in transplanted pancreatic islets: no effects of cyclosporin or tacrolimus on immediate neuronal survival. Ups J Med Sci. 2001;106:145–50.
- Korsgren O, Jansson L, Andersson A, Sundler F. Reinnervation of transplanted pancreatic islets. A comparison among islets implanted into the kidney, spleen, and liver. Transplantation. 1993;56:138–43.
- Korsgren O, Jansson L, Sundler F. Reinnervation of transplanted fetal porcine endocrine pancreas. Evidence for initial growth and subsequent degeneration of nerve fibers in the islet grafts. Transplantation. 1996;62:352–7.
- Rodriguez-Diaz R, Speier S, Molano RD, Formoso A, Gans I, Abdulreda MH, et al. Noninvasive in vivo model demonstrating the effects of autonomic innervation on pancreatic islet function. Proc Natl Acad Sci U S A. 2012;109:21456–61.
- Sandler S, Andersson A, Hellerström C. Inhibitory effects of interleukin 1 on insulin secretion, insulin biosynthesis, and oxidative metabolism of isolated rat pancreatic islets. Endocrinology. 1987;121:1424–31.
- Hermansson K, Kallskog O, Wolgast M. Effect of renal nerve stimulation on the activity of the tubuloglomerular feedback mechanism. Acta Physiol Scand. 1984;120:381–5.
- Portis AJ, Rajotte RV, Krukoff TL. Reinnervation of isolated islets of Langerhans transplanted beneath the kidney capsule in the rat. Cell Transplant. 1994;3:163–70.
- Korsgren O, Jansson L, Ekblad E, Sundler F. Reinnervation of syngeneic pancreatico-duodenal grafts in rats. Transplantation. 2001;71:8–13.
- Svensson AM, Sandler S, Jansson L. Pancreatic islet blood flow in the rat after administration of islet amyloid polypeptide or calcitonin gene-related peptide. Diabetes. 1994;43:454–8.
- Griffith RC, Scharp DW, Hartman BK, Ballinger WF, Lacy PE. A morphologic study of intrahepatic portal-vein islet isografts. Diabetes. 1977;26:201–14.
- Houwing H, Frankel KM, Strubbe JH, van Suylichem PT, Steffens AB. Role of the sympathoadrenal system in exercise-induced inhibition of insulin secretion. Effects of islet transplantation. Diabetes. 1995;44:565–71.
- Houwing H, Strubbe JH, Bruggink JE, Steffens AB. Sympathoadrenal activity during exercise in partial diabetic and diabetic rats. Horm Metab Res. 1997;29:25–9.
- Gardemann A, Jungermann K, Grosse V, Cossel L, Wohlrab F, Hahn HJ, et al. Intraportal transplantation of pancreatic islets into livers of diabetic rats. Reinnervation of islets and regulation of insulin secretion by the hepatic sympathetic nerves. Diabetes. 1994;43:1345–52.
- Gardemann A, Jungermann K, Grosse V, Cossel L, Wohlrab F, Hahn HJ, et al. Reinnervation of pancreatic islets and regulation of insulin secretion by hepatic sympathetic nerves after intraportal transplantation of islets into livers of diabetic rats. Exp Clin Endocrinol Diabetes. 1995;103:107–11.
- Porksen N. The in vivo regulation of pulsatile insulin secretion. Diabetologia. 2002;45:3–20.
- Porksen N, Munn S, Ferguson D, O'Brien T, Veldhuis J, Butler P. Coordinate pulsatile insulin secretion by chronic intraportally transplanted islets in the isolated perfused rat liver. J Clin Invest. 1994;94:219–27.
- Meier JJ, Hong-McAtee I, Galasso R, Veldhuis JD, Moran A, Hering BJ, et al. Intrahepatic transplanted islets in humans secrete insulin in a coordinate pulsatile manner directly into the liver. Diabetes. 2006;55:2324–32.
- Omer A, Duvivier-Kali VF, Aschenbach W, Tchipashvili V, Goodyear LJ, Weir GC. Exercise induces hypoglycemia in rats with islet transplantation. Diabetes. 2004;53:360–5.
- Edwards AV. Aspects of autonomic and neuroendocrine function. Equine Vet J Suppl. 1997;24:109–17.
- Niijima A. Nervous regulation of metabolism. Prog Neurobiol. 1989;33:135–47.
- Korsgren O, Christofferson R, Jansson L. Angiogenesis and angioarchitecture of transplanted fetal porcine islet-like cell clusters. Transplantation. 1999;68:1761–6.
- Jansson L, Carlsson PO. Graft vascular function after transplantation of pancreatic islets. Diabetologia. 2002;45:749–63.
- Källskog Ö, Kampf C, Andersson A, Carlsson PO, Hansell P, Johansson M, et al. Lymphatic vessels in pancreatic islets implanted under the renal capsule of rats. Am J Transplant. 2006;6:680–6.
- Jansson L, Tyrberg B, Carlsson PO, Nordin A, Andersson A, Källskog Ö. Microcirculation of human pancreatic islets transplanted under the renal capsule of nude mice. Transplantation. 2001;72:730–2.
- Rabkin R, Kitaji J. Renal metabolism of peptide hormones. Miner Electrolyte Metab. 1983;9:212–26.
- Hammerman MR. Interaction of insulin with the renal proximal tubular cell. Am J Physiol. 1985;249:F1–11.
- Rabkin R, Ryan MP, Duckworth WC. The renal metabolism of insulin. Diabetologia. 1984;27:351–7.
- Sato H, Yoshioka K, Terasaki T, Tsuji A. Receptor-mediated endocytosis of A14-125I-insulin by the nonfiltering perfused rat kidney. Biochim Biophys Acta. 1991;1073:442–50.
- Winer S, Tsui H, Lau A, Song A, Li X, Cheung RK, et al. Autoimmune islet destruction in spontaneous type 1 diabetes is not beta-cell exclusive. Nat Med. 2003;9:198–205.
- Saravia F, Homo-Delarche F. Is innervation an early target in autoimmune diabetes? Trends Immunol. 2003;24:574–9.