
Abstract
Background. The increase of live kidney donation (LKD) demands that we scrutinize its long-term consequences. Socialized medicine in Sweden has allowed us to survey long-term consequences of LKD with a high response rate.
Methods. Between 1974 and 2008, 455 LKDs were performed; 28 donors were deceased and 14 had moved abroad at the time of the survey. Of the remaining 413, 96% agreed to participate in a retrospective study with laboratory testing and answering a questionnaire.
Results. Mean age at donation was 49 ± 10 years, and the mean time since nephrectomy was 11 ± 7 years (range 1–33). No death was of renal cause. S-creatinine at follow-up was 93 ± 18 μmol/L, 28% had treated hypertension, of whom only 52% had BP <140/90. Eleven per cent had spot microalbuminuria, and 1% were diagnosed with diabetes mellitus. Seventy-one per cent had check-ups at least every second year, but 14% had no check-ups. Eighty per cent would be willing to donate again if it were possible, and only 3% regretted the donation.
Conclusion. Renal function is well preserved in the long term after donation, no case of end-stage renal disease was identified, and a large majority of our donors would donate again if it were possible. Although rates of microalbuminuria and hypertension were at expected levels, a significant number of donors demonstrated elevated blood pressure levels and inadequate antihypertensive treatment. A relatively large number of donors did not receive regular check-ups. Both of these issues demonstrate the need for a better-structured lifelong follow-up.
Key words::
Introduction
Live kidney donation (LKD) is a unique surgical procedure where major surgery is performed on healthy individuals with no direct benefit from the operation. The risk–benefit balance thus demands that donor safety is ensured in the short and long term, and that the transplant community has structures that support long-term follow-up and intervention if needed. This obligation has become increasingly important as we are systematically increasing the use of LKD (Citation1). A number of studies have demonstrated that LKD seems to be safe and that kidney function is well preserved in the long term (Citation2–6), and even very long term (Citation7). There are, however, conflicting reports indicating that there may be an increased risk for developing end-stage renal disease (ESRD) (Citation8,9). The findings in many of these studies are somewhat hampered by suboptimal response rates, incomplete follow-up, or poorly defined cohorts. Moreover, there is no information on how many of the donors are actually having regular long-term check-ups. In Sweden, there is a tax-financed universal health care system, and every individual has a social security number, making it possible to perform a long-term follow-up study of LKD with very high response rates. We therefore set out to conduct a retrospective cohort study with a high participation rate to analyse the long-term effects of LKD on renal function, hypertension, the frequency of follow-up, and the overall experience of donation.
Materials and methods
Study population
From November 1974 to September 2008, a total of 455 live donors were nephrectomized at the University Hospital in Uppsala, Sweden. Social security numbers made it possible to identify all donors for whom current addresses were retrieved from the Swedish population register. We identified 28 donors as deceased and 14 donors living abroad, leaving 413 individuals available to participate in the study. An invitation to participate was sent out, followed by a further reminder to those who did not reply. We also tried to reach those who did not respond by phone, retrieving phone numbers from online directories. A total of 395 (95.6%) agreed to participate, of whom 375 underwent follow-up with medical examinations and laboratory tests. The examinations were performed at the donor's local nephrology department and included measurements of weight, height, the mean value of two consecutive seated blood pressure (BP) readings 2 minutes apart, and registration of antihypertensive and antidiabetic medication. Laboratory parameters included s-creatinine, s-cystatin C, and non-morning spot sample of u-albumin creatinine ratio (ACR) or u-albumin. Modification of Diet in Renal Disease (MDRD) was calculated as [186 × (creatinine μmol/L × 0.0113)-1.154 × (age)-0.203 × 0.742 ‘if female' × factor 0.742]. Cockcroft–Gault was calculated as [(140–age) × weight kg × (1.23/creatinine μmol/L) ‘if female' × factor 0.85]. Cystatin C-based estimated glomerular filtration rate (eGFR) was calculated as [79.901 × (cystatin C mg/L)-1.4389]. Pre-donation measured glomerular filtration rate (mGFR) was measured by either iohexol or Cr-EDTA. All participants also received a questionnaire about their overall experience of donation and frequency of follow-up. The cause of death for deceased donors was obtained from the national registry of the Swedish National Board of Health and Welfare. Approval for the study was obtained from the Regional Ethics Committee in Gothenburg, and participants gave written informed consent.
Statistical techniques
Data management and analysis were performed with the IBM Statistical Package for the Social Sciences Software, SPSS, version 22. Data are expressed as mean values or percentages and standard deviation. Student's t test was used to compare normally distributed continuous variables. The Pearson two-tailed test was applied for analysis of correlation. A p value < 0.05 was considered statistically significant.
Results
Demographic data and causes of death
The mean age of the 395 participating donors at donation was 49 ± 10 years (range 21–73), and mean age at follow-up 60 ± 11 years (range 24–97) (). Fifty-eight per cent were women, and the mean time since nephrectomy at the time of follow-up was 11 ± 7 years (range 1–33). Of the total cohort of 455 donors, 28 (6%) were found to be deceased. The median age at death was 76 years for women and 75 years for men. Causes of death were: 12 (43%) cardiovascular, 9 (32%) malignancies, 2 (7%) suicides, 2 (7%) dementia, 1 (4%) accident, 1 (4%) pulmonary, and 1 (4%) infectious. No death was found to be of renal cause.
Table I. Characteristics of participating live kidney donors.
Renal function, albuminuria, hypertension, and diabetes
The results of renal function, mean arterial pressure (MAP), and albuminuria before and after donation have been summarized in . There was a statistically significant decrease in GFR when comparing pre-donation values and values at follow-up. S-creatinine at follow-up was 93 ± 18 μmol/L, corresponding to a MDRD of 67 ± 13 mL/min/1.73 m2, Cockcroft–Gault of 76 ± 21 mL/min/1.73 m2, and s-cystatin C eGFR of 73 ± 18 mL/min/1.73 m2. Twenty-nine (7%) had a pre-donation mGFR of <80 mL/min/1.73 m2, but this subgroup had no significant correlation with lower eGFR at follow-up (). There was no case of ESRD identified in the follow-up cohort, and the lowest reported eGFR was 31 mL/min/1.73 m2 25 years after donation. There was no correlation between mean time after donation and eGFR calculated, either with MDRD or with s-cystatin C (). At follow-up, the mean decrease in MDRD was 19 ± 15 and 15 ± 13, and mean MDRD was 69 ± 13 and 65 ± 12 mL/min/1.73 m2 for male and female donors, respectively. The gender difference was statistically significant (p < 0.01). Pre-donation with lower mGFR (p < 0.0001), higher age (p < 0.0001), and higher BMI (p < 0.0001) correlated with lower eGFR at follow-up, but higher MAP did not (p = 0.08). When divided into age categories, both male and female donors showed better eGFR calculated with the MDRD formula if younger at the time of donation (). There was no correlation between pre-donation mGFR and MAP or ACR at follow-up ().
Figure 1. Estimated glomerular filtration rate (eGFR) at follow-up calculated with cystatin C and years after donation. Groups divided by pre-donation measured glomerular filtration rate (mGFR) ≥80 mL/min/1.73 m2 (○) and <80 mL/min/1.73 m2 (•), respectively.
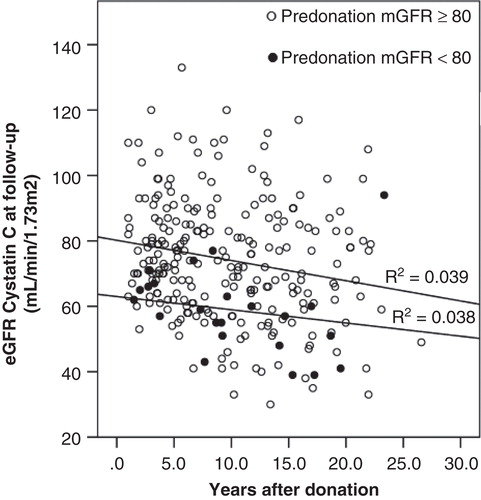
Figure 2. Glomerular filtration rate at follow-up estimated by Modification of Diet in Renal Disease (MDRD) formula mL/min/1.73 m2 (•) and cystatin C mL/min/1.73 m2 (○) according to years after donation. R2 = 0.006 and 0.025, respectively.
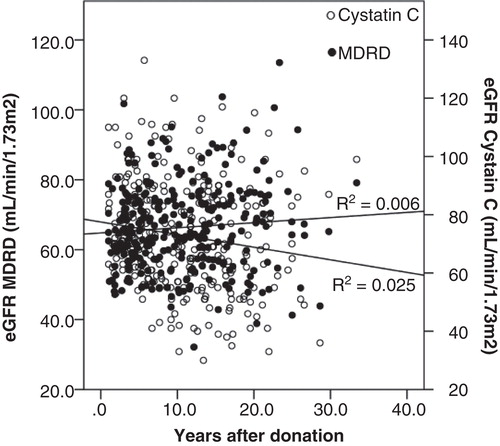
Figure 3. Estimated glomerular filtration rate (eGFR) at follow-up calculated with Modification of Diet in Renal Disease (MDRD) formula (mL/min/1.73 m2) for male and female by age categories at donation. Older age at donation is associated with lower eGFR at follow-up for both male and female donors. *p < 0.05.
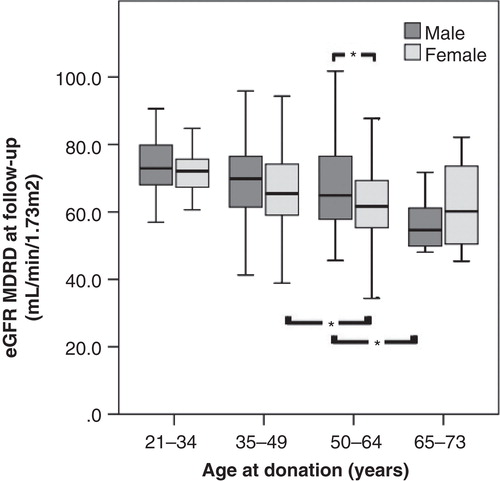
Figure 4. Level of pre-donation measured glomerular filtration rate (mGFR) mL/min/1.73 m2 showed no correlation to urine albumin-creatinine ratio (U-ACR) or mean arterial pressure (MAP) at follow-up.
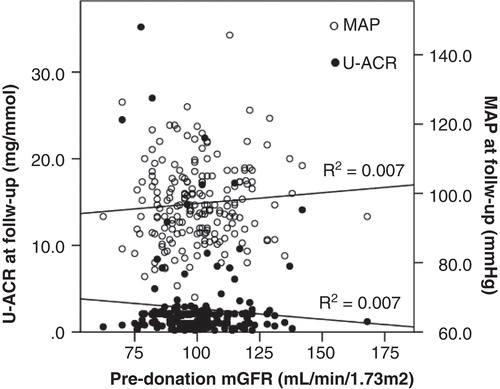
Table II. Renal function parameters (creatinine, Modification of Diet in Renal Disease (MDRD), Cockcroft–Gault and cystatin C-estimated GFR), body mass index (BMI), mean arterial pressure (MAP), and albuminuria before donation and at follow-up.
There were 42 (11%) donors who developed albuminuria (≥30 mg/L albumin or ACR ≥5 mg/mmol). Two of them had urine albumin >300 mg/L. No patient was treated for hypertension before donation (). At follow-up the mean systolic blood pressure (SBP) was 131 ± 17 and diastolic blood pressure (DBP) 79 ± 10 mmHg, but 101 (26%) had a SBP >140 or DBP >90 mmHg. Of concern was also that 111 (28%) of the donors had treated hypertension of whom only 52% had BP <140/90. The antihypertensive treatment included ACE inhibitors or renin-angiotensin blockers in 73%. Only 5 donors (1%) were diagnosed with diabetes mellitus at follow-up.
Overall experience of donation and frequency of follow-up
The questionnaire was answered by 387 (98%) of the participants. When asked if the donors had check-ups after the first post-operative year, 71% answered that they had check-ups at least every second year, 11% less often, and 14% had no check-ups at all. ‘Yes' was the answer given to the questions, ‘If it were possible, would you donate again?' and ‘Do you regret that you were a donor?' by 80% and 3%, respectively.
Discussion
In the present study, we were able to confirm that kidney function is well preserved in the long term after LKD, but we found an unexpectedly high frequency of hypertension in spite of antihypertensive treatment. Furthermore, almost one in four donors did not have frequent regular check-ups. Several other studies have demonstrated that kidney function (GFR) reaches about 70% of pre-donation values (Citation5,10,11), and some studies indicate that kidney function actually even improves somewhat over time (Citation12). The latter is an interesting finding since in the general population GFR generally decreases by about 9 mL/min per decade after the age of 40 (Citation13). In the present study, we saw no decrease in GFR over time, even in the long term. This substantiates the notion that GFR does not deteriorate over time after LKD in the same way as it does in the general population. Originally the requirement for LKD was a GFR >80 mL/min/1.73 m2. Our finding that the subgroup with a pre-donation mGFR <80 mL/min/1.73 m2 did not correlate with lower eGFR at follow-up substantiates the British Transplantation guidelines where the threshold of pre-donation GFR is age-adjusted (Citation14). It was also reassuring that no donor developed ESRD and that the lowest GFR was 31 mL/min. In Sweden, the incidence of ESRD is 125 per million of the population (Swedish Renal Registry http://www.medscinet.net/snr/). In our study, the mean time since donation was 10.7 years, and this would give an expected incidence of 0.5 cases of ESRD. Female gender had lower MDRD eGFR at follow-up but also a lower decrease in eGFR, which could be explained by a lower pre-donation eGFR. Not all studies have shown worse outcome for females (Citation15), but some have (Citation5,16). A Norwegian study showed that men younger than 50 years with a BMI less than 25 had the lowest increase in creatinine at follow-up (Citation17), and our results are consistent with this finding. BMI was significantly higher in the follow-up group (); obesity has been shown to be independently associated with a higher risk of developing ESRD (Citation18), and our donors with higher BMI at follow-up had lower eGFR. Due to the small numbers, no formal comparison of the life expectancy was performed, but the cause of death and mean age at death appear to be similar to those of the general population (Citation19), with none of the deaths in our study being due to renal failure. One of the main pre-donation evaluations is assessment of renal function and the absence of proteinuria, but there is considerable variability between different transplant units in accepting live donors (Citation20). Our institutional policy is to not accept potential donors with proteinuria, and determination of microalbuminuria is part of our pre-donation evaluation. At follow-up, however, we found a prevalence of 11% with microalbuminuria. The clinical significance of this finding in LKD is still unclear, and there is no strong evidence that the proteinuria is progressive, associated with hypertension, or decreased GFR (Citation21).
As for hypertension, our institutional policy was to accept potential live kidney donors only if they were not hypertensive and in more recent years only if any mild to moderate hypertension is well controlled with no more than 1 or 2 antihypertensive agents. Nevertheless, 26% had a seated BP >140/90 mmHg at follow-up even though 28% were on antihypertensive medication. One meta-analysis published in 2006 covering 5,145 donors from 28 countries showed that kidney donors may have a 5 mmHg increase in BP above the level predicted by aging 5 to 10 years after donation (Citation22), while an age-matched study showed a prevalence of 38%, which was not considered different from the general Swedish population (Citation12).
The transplant centre has a responsibility to arrange long-term follow-up that can be provided by the transplant centre or local nephrologist. There is also consensus for comprehensive national registries (Citation23). In our questionnaire, 14% of the donors stated that, after the first postoperative year, they no longer had regular check-ups, and 11% that they only had occasional check-ups, although all Swedish live donors are fully reimbursed and offered a lifetime of free medical follow-up at their local nephrology department. This finding is of concern especially since a majority of the patients who were treated for hypertension did not reach normotensive levels. A large UNOS survey has demonstrated that the most common causes of renal failure among live kidney donors were hypertensive nephrosclerosis or malignant hypertension (Citation8). The response rate in our study was very high (98%) and demonstrates that donors are willing to participate in long-term follow-up. The causes for not having regular check-ups thus need to be scrutinized, and the health care system needs to improve the organization for a structured follow-up. At least 80% of those surveyed stated that they would be willing to donate again if it were possible, and only 3% regretted being a donor. These numbers are reassuring for continued utilization of live donors. A limitation of the study is that the number of donors is relatively small and that most parameters were from a single visit. On the other hand, we were able to follow up a very high proportion of the donors, and the number of donors is significantly larger than other studies that have achieved similarly high retrieval rates (Citation21).
In conclusion, long-term renal function after LKD is well preserved, no case of end-stage renal disease or renal cause of death was identified, and a large majority of our donors would donate again if it were possible. Although the rate of microalbuminuria and hypertension was at expected levels (Citation5,24), a significant number of donors demonstrated elevated blood pressure levels and inadequate antihypertensive treatment. There were also a relatively large number of donors who did not receive regular check-ups. Both of these issues demonstrate the need for a better-structured lifelong follow-up.
Post scriptum discussion
After submission of the manuscript, Mjøen et al. published a study on the long-term risks for live kidney donors (Citation25). They found a significant increase in numbers of donors developing ESRD, all-cause death, and cardiovascular death (hazard ratio of 11.38, 1.30, and 1.40, respectively). Our study clearly cannot answer these questions. The study group is too small, and we do not have adequate controls. It is, however, reassuring that there was no progressive decline in kidney function, and there was no case of ESRD. With an incidence of ESRD of 332/million/year for those above 65 years of age in Sweden (http://www.medscinet.net/snr/rapporter.aspx) we would have expected to see one or two cases if there were an increased risk. Two donors in the Norwegian study developed ESRD due to diabetes/nephrosclerosis, which could potentially have been avoided with good follow-up and intensive treatment of their diabetes/hypertension. The necessity of a structured, lifelong follow-up is also one of the conclusions from our study.
Acknowledgements
We thank all of the donors for their contribution to the kidney recipients and all of the nurses and physicians who helped us with the physical examinations at the donors' local nephrology departments. B.v.Z.-M. participated in the design of the study, performed research, collected and analysed data, and wrote the manuscript. D.B. collected data and reviewed the manuscript. S.Y. collected data and reviewed the manuscript. J.W. participated in the design of the study, collected and analysed data, and helped to write and review the manuscript.
Declaration of interest: The authors report no conflicts of interest. The authors alone are responsible for the content and writing of the paper.
References
- Horvat LD, Shariff SZ, Garg AX; Donor Nephrectomy Outcomes Research (DONOR) Network. Global trends in the rates of living kidney donation. Kidney Int. 2009;75:1088–98.
- Fehrman-Ekholm I, Elinder CG, Stenbeck M, Tyden G, Groth CG. Kidney donors live longer. Transplantation. 1997;64:976–8.
- Fehrman-Ekholm I, Norden G, Lennerling A, Rizell M, Mjornstedt L, Wramner L, et al. Incidence of end-stage renal disease among live kidney donors. Transplantation. 2006;82:1646–8.
- Ramcharan T, Matas AJ. Long-term (20-37 years) follow-up of living kidney donors. Am J Transplant. 2002;2:959–64.
- Ibrahim HN, Foley R, Tan L, Rogers T, Bailey RF, Guo H, et al. Long-term consequences of kidney donation. N Engl J Med. 2009;360:459–69.
- Delanaye P, Weekers L, Dubois BE, Cavalier E, Detry O, Squifflet JP, et al. Outcome of the living kidney donor. Nephrol Dial Transplant. 2012;27:41–50.
- Fournier C, Pallet N, Cherqaoui Z, Pucheu S, Kreis H, Mejean A, et al. Very long-term follow-up of living kidney donors. Transpl Int. 2012;25:385–90.
- Ellison MD, McBride MA, Taranto SE, Delmonico FL, Kauffman HM. Living kidney donors in need of kidney transplants: a report from the organ procurement and transplantation network. Transplantation. 2002;74:1349–51.
- Gibney EM, Parikh CR, Garg AX. Age, gender, race, and associations with kidney failure following living kidney donation. Transplant Proc. 2008;40:1337–40.
- Santos L, Macario F, Alves R, Mota A, Campos M. Risks of living donor nephrectomy. Transplant Proc. 2010;42:1484–6.
- Goldfarb DA, Matin SF, Braun WE, Schreiber MJ, Mastroianni B, Papajcik D, et al. Renal outcome 25 years after donor nephrectomy. J Urol. 2001;166:2043–7.
- Fehrman-Ekholm I, Duner F, Brink B, Tyden G, Elinder CG. No evidence of accelerated loss of kidney function in living kidney donors: results from a cross-sectional follow-up. Transplantation. 2001;72:444–9.
- Grewal GS, Blake GM. Reference data for 51Cr-EDTA measurements of the glomerular filtration rate derived from live kidney donors. Nucl Med Commun. 2005;26:61–5.
- Andrews PA, Burnapp L, Manas D, Bradley JA, Dudley C; British Transplantation Society; Renal Association. Summary of the British Transplantation Society/Renal Association U.K. guidelines for living donor kidney transplantation. Transplantation. 2012;93:666–73.
- Garg AX, Muirhead N, Knoll G, Yang RC, Prasad GV, Thiessen-Philbrook H, et al. Proteinuria and reduced kidney function in living kidney donors: a systematic review, meta-analysis, and meta-regression. Kidney Int. 2006;70:1801–10.
- Kasiske BL, Ma JZ, Louis TA, Swan SK. Long-term effects of reduced renal mass in humans. Kidney Int. 1995;48:814–19.
- Mjoen G, Oyen O, Midtvedt K, Dahle DO, Norby G, Holdaas H. Age, gender, and body mass index are associated with renal function after kidney donation. Clin Transplant. 2011;25:E579–83.
- Hsu CY, McCulloch CE, Iribarren C, Darbinian J, Go AS. Body mass index and risk for end-stage renal disease. Ann Intern Med. 2006;144:21–8.
- Danielsson M, Talback M. Public health: an overview: Health in Sweden: the National Public Health Report 2012. Scand J Public Health. 2012;40(Suppl):6–22.
- Arunachalam C, Garrues M, Biggins F, Woywodt A, Ahmed A. Assessment of living kidney donors and adherence to national live donor guidelines in the UK. Nephrol Dial Transplant. 2013;28:1952–60.
- Gossmann J, Wilhelm A, Kachel HG, Jordan J, Sann U, Geiger H, et al. Long-term consequences of live kidney donation follow-up in 93% of living kidney donors in a single transplant center. Am J Transplant. 2005;5:2417–24.
- Boudville N, Prasad GV, Knoll G, Muirhead N, Thiessen-Philbrook H, Yang RC, et al. Meta-analysis: risk for hypertension in living kidney donors. Ann Intern Med. 2006;145:185–96.
- Ethics Committee of the Transplantation Society. The consensus statement of the Amsterdam Forum on the Care of the Live Kidney Donor. Transplantation. 2004;78:491–2.
- Fehrman-Ekholm I, Kvarnstrom N, Softeland JM, Lennerling A, Rizell M, Oden A, et al. Post-nephrectomy development of renal function in living kidney donors: a cross-sectional retrospective study. Nephrol Dial Transplant. 2011;26:2377–81.
- Mjoen G, Hallan S, Hartmann A, Foss A, Midtvedt K, Oyen O, et al. Long-term risks for kidney donors. Kidney Int. 2013; Epub ahead of print.