
Abstract
Aim: To consider the evidential value of developmental age images for identifying age of majority.
Methods: The published literature on hand–wrist X-rays, MRI scans of the distal radius and orthopantomograms of the lower left third molar is considered in terms of the mean age of attainment of the adult appearance and the diagnostic test performance of the adult appearance to predict adult status, either administratively (under-17 football) or forensically.
Results: The mean age of attainment of a mature hand-wrist X-ray is under 18 years and most individuals are mature before age 18. For the MRI wrist scan and the third molar the age of attainment is over 19 years and the adult appearance is an indicator of adulthood, while the immature appearance is uninformative about likely age. So MRI and third molars have high specificity, but low sensitivity.
Conclusions: Bone age assessed by hand–wrist X-ray is uninformative and should not be used. The adult appearance of MRI wrist scans and third molars provide evidence of being over-age, although there remains a small risk of minors being misclassified as adult. The immature appearance is uninformative about likely age and, overall, more than one third of assessments are wrong.
Introduction
The process of developmental age assessment involves using markers of the child's growth and development status to estimate how far they have travelled on their journey from conception through birth to adulthood. This provides a developmental age that is analogous to though distinct from chronological age. There are several reasons why one might want to assess developmental age: clinically, to see if there is a mismatch between the two ages that might explain abnormal developmental signs such as tall stature or delayed puberty (Greulich & Pyle, Citation1959); administratively, to confirm a claimed chronological age, such as is used by the Fédération Internationale de Football Association (FIFA) to check for over-age players in under-17 football competitions (Dvorak et al., Citation2007a) and, forensically, where chronological age is undocumented and it needs to be estimated, for example in Australian courts where until recently people smugglers were treated very differently depending on whether they were under or over 18 years of age (Cole, Citation2012a). More generally a range of methods including developmental imaging are increasingly being used across Europe to assess the age of people subject to immigration control. The use of these methods is contested and has been challenged in the courts (Aynsley-Green et al., Citation2012; Crawley, Citation2007; Separated Children in Europe Programme (SCEP), Citation2011). In the UK, despite previous statements to the contrary (Hansard, Citation1982, Citation2009), the English government recently set up a trial to test the value of dental radiography for age assessment (Bowell, Citation2012).
Developmental age through childhood can be measured in several ways, including skeletal maturity, dental maturity and physical maturity. Skeletal maturity is usually assessed from a hand–wrist radiograph, where the appearances of individual bones together define the child's bone age (Greulich & Pyle, Citation1959). Dental maturity is similarly assessed from a radiograph of all the teeth and the appearances of individual teeth, either separately or in combination, define the dental age (Roberts et al., Citation2008). Physical maturity is based on height and weight or, more informatively, height velocity. During puberty, markers of secondary sexual characteristics and menarcheal status in girls can also be used, the markers being classified by Tanner stage: breast stage (girls), genital stage (boys) and pubic hair stage (both sexes) (Marshall & Tanner, Citation1969, Citation1970). In all these cases the child's status is compared with age-related norms and the developmental age is the mean chronological age corresponding to their developmental status (Aynsley-Green et al., Citation2012).
The markers can be used throughout childhood and puberty, during which time the child's chronological age and developmental age are reasonably highly correlated and the standard deviation (SD) of the difference between the two ages is typically ∼1 year.
However, as soon as the child reaches maturity, i.e. the particular marker attains the adult state, the marker is no longer informative and the individual's developmental age cannot be estimated. This is because the adult appearance of the marker is the same, whether the individual matured recently or long ago—the concept of developmental age no longer applies. The only information the marker provides is the likely age or range of ages when the individual reached the adult state, again based on population norms, and this serves as a lower limit for their likely chronological age.
As an example, take menarche in girls, the onset of menstruation. Normally this occurs between the ages of 9–14 years (Marshall & Tanner, Citation1969). So, if a girl has not yet reached menarche she is likely to be under 14, while if she has already reached menarche she is probably at least 9, but she could be much older. Her post-menarcheal status provides no information about how long ago she reached the adult state and her likely age range is unbounded at the upper end.
Until puberty there are various markers available to estimate developmental age. However, the unbounded upper end of the age range is particularly important at older ages, when most markers are adult in appearance. At 18 years, the age of majority in the UK, Australia and many other countries, individuals are physically mature in most respects—secondary sexual characteristics and most permanent teeth are adult in appearance by this time. The only useful exceptions are third molar (wisdom) teeth and the distal radius bone in the wrist. So, if the aim is to judge whether or not individuals have reached the age of majority, these are the markers to use. Another marker that has been mooted, ossification of the junction of the sternum and clavicle, is more relevant for the third decade of life (Schmeling et al., Citation2004).
The information the markers provide is that the individual either has or has not reached adult appearance. This leads to the concept of the “age of attainment”, the notional instantaneous age when the individual transitions from the immature to the mature state. In individuals it is usually identifiable only as an age range between the latest age immature and the earliest age mature (apart from events such as menarche when the transition is evident). In population samples the distribution of the age of attainment can be estimated using logistic regression, the median age being the age when half the population is immature and half mature. If the individual is not yet adult in appearance this distribution acts as an upper bound to their likely age. Conversely, if the individual is adult in appearance, then the distribution provides a likely lower age limit. However, in this case the age is an under-estimate and they could be appreciably older, as the length of time passed since reaching maturity is not known.
Either way, it should be emphasised that the process does not and cannot ascribe a precise chronological age to the individual. There is a substantial range of uncertainty and the aim of this paper is to show how the uncertainty plays out when using such markers to predict majority status in individuals.
Three examples are considered: (i) bone age based on hand–wrist X-rays to decide on majority in Australian courts; (ii) bone age based on magnetic resonance imaging (MRI) of the distal radius as used by FIFA to validate age in under-17 football competitions and (iii) dental age based on third molars to decide on age 18 majority, in the UK, Europe and elsewhere. Two distinct statistical approaches are used: estimating the probability of being adult given the maturity status of the marker and calculating the misclassification rates of using maturity status to predict adult status.
Methods and results
Bone age with hand-wrist X-rays in people smugglers
Bone age based on a hand–wrist X-ray has long been used in paediatrics, and at least three systems have been developed to convert the image to an estimate of chronological age: Greulich-Pyle (Greulich & Pyle, Citation1959), Tanner-Whitehouse versions 2 and 3 (TW2 and TW3) (Tanner et al., Citation1983, Citation2001) and FELS (Chumlea et al., Citation1989). However, interestingly none of them has focused on the age of maturity when the X-ray reaches its adult appearance, and this has proved to be a problem when bone age is used for age assessment outside the medical context.
The Greulich-Pyle atlas of skeletal development is appreciably easier to use than TW2/3 or FELS, and for this reason it has been the method of choice for forensic age assessment. The atlas consists of a series of standard hand–wrist X-rays ranked by age for each sex. The observer compares the X-ray they are assessing with the succession of standard X-rays for that sex and identifies the one it most closely resembles. The age label for this reference X-ray then gives the individual's bone age.
The process works quite well for individuals whose X-ray is not yet mature, but once it is mature the process breaks down. The reason why it breaks down is because one cannot ascribe a meaningful age to the atlas's mature X-ray—it represents adulthood and so could be any adult age. Greulich and Pyle chose, quite arbitrarily, to label the mature male X-ray “age 19”, which in retrospect was an unfortunate choice. It led people to think that one can ascribe an age to a mature X-ray and it suggested that this age was 19 years. In practice the only statement one can make about the age of a mature X-ray is the age when it became mature. This, the age when the bone appearance transitions from “age 18” to “age 19”, cannot easily be measured in individuals, although the population mean and variability of the age of maturity (or age of attainment) can be explored with cross-sectional data using logistic regression. In practice it involves identifying the age when just half the population is mature. However, Greulich and Pyle, because they were not interested in the mature state, did not formally document the age when it occurred, leaving the way open for considerable confusion later on.
Australia has made considerable use of forensic bone age assessment, in response to the large numbers of migrants and asylum seekers reaching Australia on boats crewed by Indonesian fishermen. If caught and convicted of people smuggling, the crew are imprisoned for 5 years unless they can show they are under 18 years old, in which case they are repatriated. So crew members who claim they are under age are held in detention, often for many months, to have their age assessed. For a long time these age assessment hearings have heard evidence from one particular radiologist expert witness to say that individuals with a mature hand–wrist X-ray (i.e. matching “age 19” in the Greulich-Pyle atlas) have only a 22% chance of being under 18 years of age (Low, Citation2012). This he calculated by assuming a mean age of 19 years (i.e. taking the “age 19” label literally), a standard deviation (SD) of 15.4 months (actually the SD of bone age in boys aged 17 years, taken from the atlas) and a normal distribution to calculate the probability. The age assessment hearings are civil cases, where the decision is reached “on the balance of probabilities”. So, a 22% chance meant that the individual was more likely to be over 18 than under 18. The courts accepted this evidence and acted accordingly—most individuals were deemed to be over 18 and sent to prison.
A separate article by the author has explained why this figure of 22% is wrong and that a more correct figure is 61% (Cole, Citation2012a). Using data from the TW3 method showed that the mean age of attainment was 17.6 years, with a standard deviation of 16.5 months. Thus, based on the age of attainment, an individual with a mature X-ray is more likely to be under 18 than over 18. The courts accepted this and most cases since 2011 have ended in dismissal and repatriation.
Due to unease with the age assessment process, the Australian Human Rights Commission set up an inquiry into its use in 2011 and its report “An Age of Uncertainty” deprecated the use of bone age (Australian Human Rights Commission, Citation2012). The case against it was partly ethical, relating to the radiation dose and inadequacy of consent procedures, and partly statistical, in that a mature X-ray is consistent with a wide range of chronological ages. The author gave evidence to the Commission showing that, for example, 3% of boys aged 15 have a mature X-ray, so it is quite inappropriate to view a mature X-ray as synonymous with being aged over 18 (Cole, Citation2012b). In 2012, the Australian government accepted in principle the recommendation of the Senate's Legal and Constitutional Affairs References Committee that it no longer use bone age as evidence in age assessment hearings (Australian Government, Citation2012).
The mean age of maturity for TW3 bone age (score 1000) has recently been estimated in the South African Birth To Twenty bone health study to be 16.5 years in white boys, 17.0 years in black boys and 15.0 years in white and black girls (Cole et al., Citation2014). These ages based on TW3 are slightly lower than they would have been if assessed using Greulich-Pyle, as the two definitions of a mature distal radius differ. (In TW3 stage I fusion of the epiphysis and shaft has begun, whereas in the Greulich-Pyle male “age 19” standard fusion has completed.) But the discrepancy in age between the two methods is likely to be only a few months, and it does not affect the interpretation. Three conclusions follow: that individuals with a mature hand–wrist X-ray can be well under age 18, those with an immature X-ray are probably under 18 and the mean chronological age of reaching skeletal maturity (as defined by TW3) varies by ethnicity.
Bone age with wrist MRI in under-17 international football
Given that most hand–wrist X-rays are mature by the age of 18, their value for deciding whether or not individuals have reached their majority is close to zero. However, there is another more cogent reason for not using bone age to make these decisions—it very often gives the wrong answer. For this reason it is worthwhile to quantify the performance of the bone age assessment in large samples of individuals.
Given a training set of individuals of known age and bone age status, one can cross-classify the frequencies of being adult (or not) and being mature (or not). This allows one to calculate the chances of being immature or mature in minors and adults and, more importantly, the misclassification rates (false positives and false negatives) that would arise from assuming that a mature bone age corresponds to an adult age and vice versa. Recent work on age assessment in football provides a good example.
Where age 18 is the critical age for majority, age 17 is equally critical in international under-17 (U-17) football. FIFA has long been concerned that a proportion of U-17 players are actually 17 or older and as such have advantages in terms of greater maturity, weight and strength. In 2009, FIFA announced that players in the U-17 World Cup would for the first time be tested with “wrist scans” to check their age. The wrist scans, in particular the distal radius, are done using magnetic resonance imaging (MRI) rather than conventional radiography. This is significant, as MRI provides a much more detailed image than radiography, which not only reduces the radiation dose, but also makes it easier to see whether or not the radius has fused. The radius is the key marker of maturity and it provides essentially the only difference between the “age 18” and “age 19” Greulich-Pyle images—the relative appearance of the radial line as a marker of radial fusion.
FIFA started work on the problem of age assessment in 2003 and published the findings in two papers in 2007 (Dvorak et al., Citation2007a,Citationb). They first developed a six-point MRI grading system for fusion of the epiphysis of the distal left radius, ranging from grade 1 “completely unfused” to grade 6 “completely fused”. They then applied the system to 496 male club football players from Switzerland, Malaysia, Algeria and Argentina (Dvorak et al., Citation2007a). The players ranged in age from 14–19 years, defined as age last birthday and based on documented date of birth.
The relationship between fusion grade and age is shown in as a mosaic plot, where the vertical bars are years of age, their widths reflecting the relative sample size at that age, and each year bar is split by fusion grade and shaded from white (grade 1) to black (grade 6). In general, MRI fusion grade increased with age. summarises by looking at maturity (grade 6 vs grades 1–5) in 3-year age groups on either side of 17 years (shown as a red line (or black in the print version) in ). In the U-17 group just one of the 276 boys was mature (0.4%), while in the over-age group 12% (27 of 220) were mature, 30-times more. So, if a grade 6 wrist scan is viewed as evidence of being over-age, only 0.4% of U-17 boys were mature and, hence, would be misclassified as over-age—an impressively low figure. The authors saw this as confirming the value of MRI wrist scans for spotting bogus U-17 players, since nearly all those genuinely under 17 would be accepted and only 0.4% would be wrongly excluded (Dvorak et al., Citation2007a).
Figure 1. The distribution of radial fusion grades from 1 (immature, white) to 6 (mature, black) by year of age in 496 footballers, from Dvorak et al. (Citation2007a). Age 18 is marked by the vertical red line.
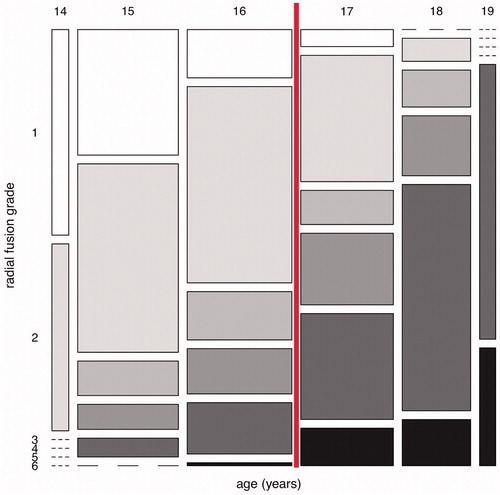
Table 1. Number (%) of 496 footballers graded as immature and mature by radial fusion status in 3-year age groups under and over 17.0 years, based on Dvorak et al. (Citation2007a). Percentages are by column.
However also shows that, among the boys aged 17 or more, 88% were immature (i.e. graded 1–5) and they would also be accepted on the basis of their scan as being U-17. So, only 12% of over-age players would be recognised as such and rejected from the competition. Fewer than 50% of individuals were mature at age 19 (), suggesting that the median age of maturity was 20 or more.
A second study validated the MRI wrist scan in four U-17 competitions—FIFA 2003 and 2005, and the Asian Football Confederation (AFC) in 2004 and 2006 (Dvorak et al., Citation2007b). Each of the 16 countries in each competition provided three players for testing, selected randomly in 2003–2005 and purposively in 2006 to choose the most mature-looking players. The countries knew in advance that their players would be tested.
shows that the proportions of players with a mature scan ranged from a high of 35% in FIFA 2003 to a low of 6% in AFC 2006, all far higher rates than the 0.4% seen in the reference group in . They ought to be near 0.4% and there are only two possible reasons for their being so much higher: (a) the players were U-17 but unusually mature or (b) they were over-age. Unfortunately, the study could not distinguish between these two possibilities, which meant that the conclusions were not clear-cut. However, the downward trend in the maturity rate from 35% in 2003 to 6% in 2006 (significant at p = 0.01) is a clear hint that countries were gradually absorbing the implications of the testing regime and learning to select their teams more strategically.
Table 2. The proportions with a mature wrist scan among 189 international footballers from four U-17 competitions, based on Dvorak et al. (Citation2007b).
Dental age based on third molars
Developmental imaging for age assessment in the UK
The legal status of developmental imaging for age assessment in the UK is unclear. Back in 1982 the then Home Secretary Willie Whitelaw stated in the House of Commons that:
I have … concluded that … X-ray examinations are of limited value and their continued use in the immigration context can no longer be justified. Accordingly, instructions have been issued that X-rays should no longer be used for this purpose … (Hansard, Citation1982).
However, over the past decade, dental age assessment based on X-rays has been increasingly used by UK local authorities to justify decisions to refuse support for asylum seekers and this has been accepted by the Home Office. In 2008, following a consultation on the process, the Home Office recognised the lack of consensus on the use of X-rays and established a working group to review the process (Home Office, Citation2008). Subsequently, the Home Office accepted that X-rays should not be used for age assessment: in a Lords debate on the Borders, Citizenship and Immigration Bill on 10 March 2009, Lord West of Spithead, the Parliamentary Under-Secretary (Security and Counter-terrorism), Home Office, in response to an amendment moved by Lord Avebury, said:
The noble Lord, Lord Avebury, and the noble Earl, Lord Listowel, mentioned the issue of checking age. It is correct to say that we went through the process of asking whether we should take X-rays and it was absolutely agreed not to do so. There is no intention for us now to do that (Hansard, Citation2009).
This intention changed in March 2012, when the head of asylum at the UK Border Agency (then part of the Home Office) announced in a letter to interested parties the setting up of a 3-month trial by Croydon Council, in conjunction with Professor Graham Roberts of Kings College London:
… to establish whether dental X-rays are a useful tool in helping to establish people's ages when they have been assessed as an adult yet continue to maintain that they are a minor (Bowell, Citation2012).
This apparent change in policy attracted considerable opposition (Immigration Law Practitioners' Association, Citation2012) and the Home Office suspended the trial in April 2012. The criticisms of the process matched those in the Australian Human Rights Commission report (Australian Human Rights Commission, Citation2012), including not only the unethical radiation dose and inadequate consent arrangements, but also the uncertainty attached to the estimated age. However, what the criticisms did not cover was the degree of misclassification arising from the dental age assessment, as illustrated here with bone age and U-17 football.
Dental age for assessing age of majority
The age of attainment of third molars (wisdom teeth) and the related misclassification rates can be estimated from surveys of individuals of known chronological age whose tooth maturity status is also known. Dental age is assessed via a panoramic radiograph (orthopantomogram), where a sub-set of the 32 teeth are rated for development based on the eight-stage Demirjian system (Demirjian et al., Citation1973), between stage A (immature) and stage H (mature). So, “stage H” dental age is directly analogous to “age 19” bone age. Other rating systems also exist, but the Demirjian system is widely used (Olze et al., Citation2005).
As explained in the Introduction, third molars are the only teeth still developing around the age of majority (Mincer et al., Citation1993). Several studies have published tables of third molar stage cross-classified by age in particular population samples and they provide the opportunity to judge the concordance between dental age and chronological age (Johan et al., Citation2012; Jung & Cho, Citation2014; Kasper et al., Citation2009; Lee et al., Citation2009; Li et al., Citation2012; Martin-De Las Heras et al., Citation2008; Olze et al., Citation2004). There are four third molars, upper/lower left/right and for simplicity the argument here focuses on the lower left, commonly known as LL8.
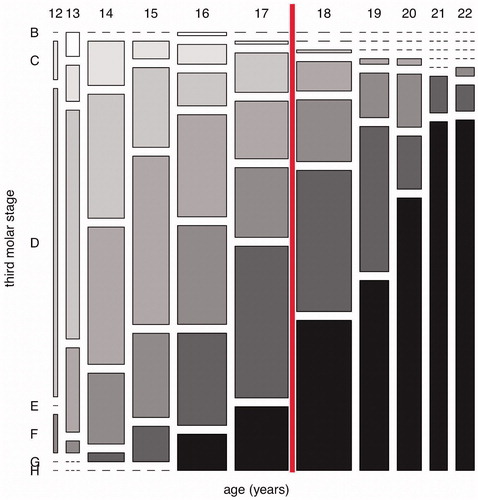
is a mosaic plot showing the stage distribution of the LL8 third molar at different ages from 12 (and earlier) to 22 years in 619 Korean males (Lee et al., Citation2009). As with the vertical bars indicate years of age, the bar widths reflect sample size and the data are spread uniformly across the age range. Each year bar is split into the eight stages A–H. The shading increases in density with maturation, with mature teeth (stage H) shown in black at the bottom right. Before age 18 no teeth are mature and at 18 only a few are, but the proportion rises steeply until age 22, when ∼90% of teeth are mature. The age when just half the sample is mature is 19.5 years and this is the median age of attainment of a mature LL8 tooth.
Figure 2. The distribution of Demirjian stages from A (immature, white) to H (mature, black) by year of age, for lower left third molars of 619 Korean males (Lee et al., Citation2009). Age 18 is marked by the vertical red line.
also shows in red the age of majority at 18.0 years. If the LL8 tooth were a perfect marker of maturity, the proportion mature would be zero to the left of the line (i.e. all stage A–G in grey) and 100% to the right (stage H in black). In other words the age of attainment would be 18.0 years in all individuals. In practice the first requirement is satisfied—there are no mature (black) teeth before age 18—but the second requirement is not, with many teeth after age 18 being immature (grey). So, for this Korean sample, having a mature third molar is unambiguously associated with being over age 18. However, equally, having an immature third molar implies any age from 12–22 and beyond. Looked at the other way, teeth for those under age 18 are all immature, while over 18 they may be immature or mature.
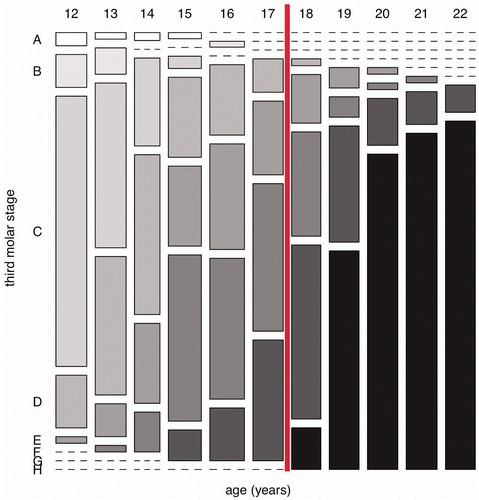
As another example, shows the mosaic plot of lower third molars (left and right combined) tabulated by stage and age from a sample of 415 Texan Hispanic males (Kasper et al., Citation2009). Here mature teeth are first seen at the earlier age of 16, while median age of attainment is 19.9 years. So, in this case, dental maturity corresponds to age 16 or more, while immature third molars are seen at all ages from 12–22.
Figure 3. The distribution of Demirjian stages from B (immature, white) to H (mature, black) by year of age, for 804 lower third molars from 415 Texan Hispanic males (Kasper et al., Citation2009). Age 18 is marked by the vertical red line.
As with bone age, one can calculate the degree of misclassification based on the maturity or otherwise of the LL8 tooth. Looking at and , this clearly depends on the range of ages of individuals being assessed. If they included many who were under 16 (where none are mature) or over 20 (nearly all mature) then the LL8 would perform well. However, this is unrealistic, and disputed cases are far more likely to be concentrated in the age range 15–20, i.e. 3 years on either side of 18.0, and over this range the LL8 performs less well. Focusing on this age range effectively specifies it as the prior distribution for the age of individuals subject to age assessment.
aggregates the numbers in and and it shows that, for age 15–17 years the proportion with mature teeth and wrongly classified as being adult is zero for the Koreans and 9% for the Texan Hispanics. Conversely for age 18–20 half are misclassified as being minor in both samples. These numbers correspond, respectively, to the black regions to the left and the grey regions to the right of the red lines in and .
Table 3. Number (%) of subjects graded as immature and mature by lower third molar stage in 3-year age groups under and over 18.0 years, for Korean and Texan Hispanic males. Percentages are by column.
Diagnostic tests
The maturity status of the distal radius () and the lower third molar () can be viewed as diagnostic tests to detect majority. The diagnostic test is a tool from clinical medicine where disease status (present or absent) is related to the level of a disease marker (high or low). Here the marker is third molar stage (with stage H high and stages A–G low), disease present corresponds to age 18 + and the age range is restricted to 15–20 years for the reasons explained above. The data are laid out in a two-by-two table, as in and , and the performance of the test is judged in terms of the proportions of true positives (sensitivity) and true negatives (specificity) calculated as column percentages (see and ). In addition, the positive predictive value (PPV) and negative predictive value (NPV) are derived, where the PPV is the proportion of cases with a mature appearance that are adult and the NPV is the proportion of immature cases that are minor. These can be calculated as row percentages in and . Also the accuracy is the proportion of assessments that are either true positive or true negative.
The evidential value of a positive test can be expressed as the ratio of the percentage of true positives to the percentage of false positives; this is known as the likelihood ratio positive (LR+) and is calculated as the sensitivity divided by 100% minus the specificity. The likelihood ratio negative (LR−), based on a negative test, is the ratio of false to true negatives, calculated as 100% minus the sensitivity divided by the specificity. Values of LR + well above 1 indicate that a positive test provides useful evidence of majority, while values of LR− well below 1 show that a negative test is strong evidence for being a minor.
The results for seven studies (12 groups) are summarised in , based either on LL8 or both lower third molars. The specificity is consistently 80% or higher, reaching 100% in five of the 12 groups. Equally the positive predictive value is close to 100%. This means that nearly all minors have an immature third molar, or equivalently that nearly all individuals with a mature third molar are 18+. Note, though, that the specificity is ethnic-specific, being below 90% on average for the Spanish and Texan groups, compared to near 100% in the Far Eastern populations of China, Malaysia, Japan and Korea.
Table 4. Diagnostic test statistics for a mature lower third molar to detect age of majority. Results from seven population studies.
Conversely, the sensitivity overall is low, between 20–69%, meaning that about half of third molars in minors are immature and half mature. The same applies to the negative predictive value, so that an immature third molar is very poor at predicting age status. The accuracy column in shows the proportion of cases that are correctly predicted (either true positive or true negative); the figures range from 32–77%, with a mean of 62%. So, on average, three in eight assessments give the wrong answer.
For completeness, the equivalent results for the distal radius in show 99.6% specificity, 12% sensitivity, 96% positive predictive value, 59% negative predictive value and 61% accuracy. The high specificity matches that for the third molar, but again it is group-specific, with the proportions of under-age U-17 players with a mature wrist scan ranging from 6–35% (), as against 0.4% in the reference group ().
The results expressed as likelihood ratios lead to the same conclusions. The high specificities mean that LR + ranges from 2.2 to infinity, indicating the value of a positive test. Conversely, the low sensitivities give LR− between 0.5 and 0.9, so the negative test is not useful. Ideally, these results should be adjusted to account for the non-uniform age structure in each 3-year age group, as a reviewer has pointed out. However the age structure is close to uniform in many of the groups anyway (see, e.g. and , where the columns for the 6 years are similar in width), meaning that adjustment would make little difference to the results and no difference to the broad conclusions.
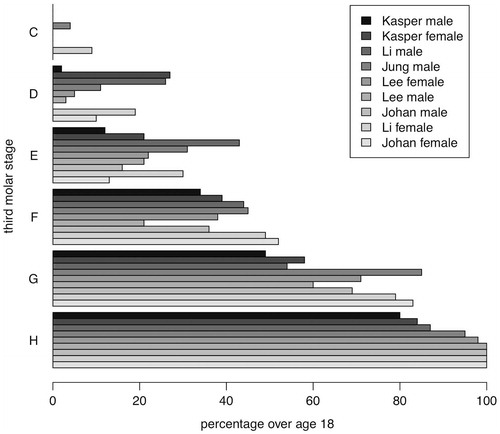
Thus, in summary, a mature image is informative while an immature image is uninformative. However, the immature category summarises a wide spectrum of maturity (from stage 1–5 for wrist MRI and stage A–G for third molars), so that using the individual stages rather than the whole category might be more informative. explores the evidential value of individual dental stages from C–H for assessing majority, based on the studies in (omitting those of Martin-De Las Heras et al. (Citation2008) and Olze et al. (Citation2004), which have insufficient data). shows by study and sex the proportions of individuals with each tooth stage that are age 18 or more—they correspond to the positive predictive value for each stage. The proportions range from near 0% for stage C to near 100% for stage H. Thus, individuals in stage C are very likely to be under 18, while those in stage H are very likely to be over 18 (as has already shown). However, stages D–G are uninformative, as individuals in these stages can be either under or over 18.
Figure 4. The proportions of individuals aged over 18 in Demirjian stages C–H, by study and sex. Studies are ranked by the values for stages H and G. Most individuals in stage H are over 18, while most in stage C are under 18; stages D–G are uninformative, in that individuals may be either under or over 18.
Discussion
The ability of developmental age markers to predict the age of majority depends on two factors: the mean age of attainment of the marker's mature adult appearance and the misclassification rate of this mature appearance for determining majority status. For bone age assessed by hand–wrist X-ray the mean age of attainment is 17–18 years, appreciably less than the 19 years that has been inferred from the Greulich-Pyle Atlas (Cole, Citation2012a). Conversely, for radial fusion assessed by MRI, the mean age of attainment is ∼ 20 years, as seen in (Dvorak et al., Citation2007a). In lower third molars the mean age of attainment for mature Demirjian stage H is 19–20 years ( and ). So, for the majority of people, the distal radius imaged by X-ray fuses before the age of majority, while imaged by MRI it fuses later. Similarly, the third molar matures mostly after the age of majority.
It is striking that the distal radius fuses so much later when imaged by MRI than by X-ray. shows that, by age 19, only 30% of the MRI-imaged radii had completely fused (grade 6). Conversely, grade 5 looks to be reached during the 19th year, a year later than for complete fusion imaged by X-ray. Interestingly, the Greulich-Pyle atlas (1959) and the original Tanner-Whitehouse bone age scoring system (TW1 method) (Tanner et al., Citation1962) both assessed radial fusion in broadly the same way (respectively, “age 19” and “stage J”), whereas the revised TW2 and TW3 methods omitted stage J entirely. The implication is that, in a proportion of individuals, the radius takes a very long time to fuse and, imaged with MRI, this incomplete fusion becomes more evident.
In addition to depending on the method of imaging used, the mean age of attainment varies across populations. It is often assumed that individuals being assessed are similar in background to those used to produce the reference, be it for the distal radius or third molar. However, this is wrong, as most asylum seekers for example come from poor developing countries where patterns of maturation are likely to differ. There are also differences attributable to genetics and nutritional status, as seen for example in , where third molars in Koreans mature appreciably later than in Texan Hispanics. Also the median age of attainment of a mature hand–wrist X-ray differed by 6 months between the white and black boys in the Birth To Twenty Study. The effect of all these differences is poorly documented, but it is known to both hasten and delay maturational timing in different contexts (Schmeling et al., Citation2000; Thodberg & Savendahl, Citation2010). Thus, the most one can say about them is that they increase the uncertainty attached to the prediction.
Court cases often rely on the probability of a marker being mature to make a judgement about majority, as discussed here for bone age assessed by X-ray. In civil cases the judgement is made “on the balance of probabilities”, so, if the probability of being over age 18 exceeds 50%, i.e. if the median age of attainment is above 18 years, then this may be viewed as sufficient to reach a verdict. However, it pre-supposes that the bone age evidence is valid and the quality of such evidence can—and should—be challenged. The key issue is how well the marker predicts majority and how high the misclassification rate is. The results here from the Birth To Twenty Study confirm that most individuals have a mature hand–wrist X-ray by age 18, so that a mature X-ray is uninformative about majority. However, for the immature X-ray the reverse is true, where its presence is stronger evidence for being minor. So it is the immature, not the mature, X-ray that is informative. Thus, the assessment is of no value to a prosecutor, as it cannot demonstrate majority, and there is no point in using it. The hand–wrist X-ray should not be used to assess age of majority.
This raises a more general point. Overall, the misclassification rate of developmental age imaging for age assessment is high, so to compensate for this it is important to work to a higher level of evidence than the balance of probabilities, i.e. a probability beyond reasonable doubt. This corresponds to a positive (or negative) predictive value approaching 100%.
The third molar, in contrast to the hand–wrist X-ray, has high specificity and high positive predictive value, but low sensitivity, low negative predictive value and low accuracy (). The same is true for the distal radius with MRI (). Dvorak et al. (Citation2007b) argue that the low false positive rate (high specificity) for the distal radius makes it a viable tool to detect over-age U-17 footballers—if the radius is fused they are likely to be over-age. However, this argument is not entirely convincing, for two reasons. First, if the radius is unfused the individual is assumed to be under-age, yet 88% of 17–19-year-olds had unfused radii () and, hence, would be deemed eligible to play. So, the wrist scan is a far from perfect marker for screening out over-age players. In addition, the low false positive rate of 0.4% may itself be an under-estimate, as the application of the method to U-17 competition players () shows much higher rates, ranging from 6–35% across the four competitions (Dvorak et al., Citation2007b).
Notably this rate fell steeply over time, suggesting that national managers were learning how to play the system and omit players with a mature scan (). It is interesting to speculate how use of the wrist scan in future U-17 competitions might affect the way teams are selected. A manager could easily scan his own players and avoid selecting those with fused radii, preferring instead those with unfused radii, even if they were over-age. The net effect of the scan would be to encourage unfairness in another form, the very thing it was introduced to eliminate.
In forensic age assessment hearings, where the evidence provided is an image that is either mature or immature, one needs to judge the value of the evidence in these two categories separately, as measured by the positive predictive value and negative predictive value. The third molar is often used to assess majority in asylum cases where age is unknown. However, its performance as a diagnostic test is uneven, as shown in , where it gives the wrong answer nearly 40% of the time. It is true that a mature third molar is informative, in that the positive predictive value is relatively high and few individuals with a mature tooth from the Far East (China, Malaysia, Japan and Korea) are under 18. For Western populations it is less clear-cut, where a mature third molar would erroneously rate 10% or more of minors (some as young as 16) as adult.
The situation with an immature third molar is different, where the negative predictive value is about a half—similar to tossing a coin. It is entirely useless for assessing majority, in that a large proportion of adults aged 18–20 fall in this category. Taking the stage of the immature third molar into account, it has to be as early as stage C before one can be confident that the individual is under 18. Thus, if one wants to distinguish between minors and adults, a mature third molar is informative, but an immature third molar is not—there is a lack of symmetry. This corresponds to the situation with the wrist scan in U-17 football.
The asymmetry of the test is important for informed consent. The test works in only one direction; a mature third molar demonstrates that the individual is probably adult, but an immature third molar says nothing about their age—and it certainly does not demonstrate that they are a minor. For individuals wanting to prove that they are under 18 the test has nothing to offer them. Thus, it is essential that they be given “the benefit of the doubt”, which in practice means treating an immature tooth as evidence of minority. Without this safeguard, one could argue that the concept of informed consent is meaningless, because no fully informed individual would agree to taking the test if it could show only they were an adult and not that they were a minor.
It needs emphasising here that the paper has focused on the evidence of majority provided by a developmental age image. Wider questions about the ethics of such age assessments, including consent procedures and radiation dose, while undoubtedly important, are outside its remit.
Finally there is an important effect of selection, whereby individuals who are unusually mature for their age are likely to be over-represented, either in long-running age assessment cases or in international football. Thus, documented rates of early maturity are likely to under-estimate the chance of such individuals being the age they claim to be.
The unpalatable truth is that physical maturation is problematic for assessing age. Bone age by X-ray is effectively uninformative, whether or not the appearance is adult, while for bone age with MRI or dental age with third molars the mature appearance is predictive, particularly in Far Eastern populations, but the immature appearance is not. This leads to a large proportion of adults being assessed as minors. Governments and international sporting bodies desperately need a workable solution to the problem of distinguishing between under-age and over-age individuals and such a solution does not exist. However, a recognition of this reality, coupled with some discussion about alternative approaches using extra information (Aynsley-Green et al., Citation2012), has to be the way forward.
Overall, the misclassification rates of imaged markers are high and asymmetric, whether used in a court of law or on the football field. The use of developmental markers, be they skeletal, dental or other, for age assessment purposes, is imperfect and where they are used the quality of their evidence should be challenged.
Acknowledgements
Thanks to the three reviewers for their comments on the paper, particularly Lyle Konigsberg for his modelling insights.
Declaration of interest
TJC was paid for providing expert witness evidence to age assessment court cases in England, Scotland and Australia. Unpaid, he provided evidence to inquiries into age assessment of the Australian Human Rights Commission and the Australian Senate Legal and Constitutional Affairs Committee. TJC was funded by Medical Research Council grants MR/J004839/1 and MR/M012069/1.
References
- Australian Government. 2012. Canberra. Australian Government response to the Senate Legal and Constitutional Affairs References Committee report: detention of Indonesian minors in Australia [Online]. Available online at: http://catalogue.nla.gov.au/Record/6328017 (accessed February 5, 2014)
- Australian Human Rights Commission. 2012. An age of uncertainty: Inquiry into the treatment of individuals suspected of people smuggling offences who say that they are children [Online]. Sydney, Australia: Australian Human Rights Commission. Available online at: http://www.humanrights.gov.au/age-assessment-people-smuggling-cases-inquiry-treatment-individuals-suspected-people-smuggling (accessed July 19, 2013)
- Aynsley-Green A, Cole TJ, Crawley H, Lessof N, Boag LR, Wallace RMM. 2012. Medical, statistical, ethical and human rights considerations in the assessment of age in children and young people subject to immigration control. Brit Med Bull 102:17–42
- Bowell Z. 2012. Age assessments -- dental X-rays [Online]. London: Home Office UK Border Agency. Available online at: http://www.ilpa.org.uk/data/resources/14476/12.03.28-UKBA-letter-on-X-ray-Age-Assessment.pdf (accessed February 5, 2014)
- Chumlea WC, Roche AF, Thissen D. 1989. The FELS method of assessing the skeletal maturity of the hand-wrist. Am J Hum Biol 1:175–183
- Cole T. 2012a. People smugglers, statistics and bone age. Significance 9:8–12
- Cole TJ. 2012b. Professor Tim Cole (Submission 5) [Online]. Sydney: Australian Human Rights Commission. Available online at: http://www.humanrights.gov.au/publications/submissions-age-assessment-people-smuggling-cases-inquiry-treatment-individuals (accessed July 19, 2013)
- Cole TJ, Rousham EK, Hawley NL, Cameron N, Norris SA, Pettifor JM. 2014. Ethnic and sex differences in skeletal maturation among the Birth to Twenty cohort in South Africa. Arch Dis Child 100:138–143
- Crawley H. 2007. When is a child not a child? Asylum, age disputes and the process of age assessment [Online]. London: Immigration Law Practitioners Association. Available online at: http://www.ilpa.org.uk/data/resources/13266/ILPA-Age-Dispute-Report.pdf (accessed February 5, 2014)
- Demirjian A, Goldstein H, Tanner JM. 1973. A new system of dental age assessment. Hum Biol 45:211–227
- Dvorak J, George J, Junge A, Hodler J. 2007a. Age determination by magnetic resonance imaging of the wrist in adolescent male football players. Br J Sports Med 41:45–52
- Dvorak J, George J, Junge A, Hodler J. 2007b. Application of MRI of the wrist for age determination in international U-17 soccer competitions. Br J Sports Med 41:497–500
- Greulich WW, Pyle SI. 1959. Radiographic atlas of skeletal development of the hand and wrist. California: Stanford University Press
- Hansard. 1982. HC Deb 22 February 1982. Vol. 18. cc279-80W. Immigrants (X-ray Examinations) [Online]. London: Hansard. Available online at: http://hansard.millbanksystems.com/written_answers/1982/feb/22/immigrants-x-ray-examinations (accessed February 6, 2014)
- Hansard. 2009. HL Deb, 10 March 2009, c1151 [Online]. London: Hansard. Available online at: http://www.publications.parliament.uk/pa/ld200809/ldhansrd/text/90310-0014.htm (accessed February 6, 2014)
- Home Office. 2008. Better outcomes: the way forward – Improving the care of unaccompanied asylum seeking children [Online]. London: Home Office. Available online at: http://dera.ioe.ac.uk/228/ (accessed February 10, 2014)
- Immigration Law Practitioners' Association. 2012. ILPA information sheet: age disputes (dental X-rays) [Online]. London: ILPA. Available online at: http://www.ilpa.org.uk/data/resources/14526/12.04-Age-Disputes-Dental-X-Rays.pdf (accessed February 5, 2014)
- Johan NA, Khamis M, Abdul Jamal NS, Ahmad B, Mahanani ES. 2012. The variability of lower third molar development in Northeast Malaysian population with application to age estimation. J Forensic Odontostomatol 30:45–54
- Jung Y-N, Cho B-H. 2014. Radiographic evaluation of third molar development in 6- to 24-year-olds. Imaging Sci Dent 44:185–191
- Kasper KA, Austin D, Kvanli AH, Rios TR, Senn DR. 2009. Reliability of third molar development for age estimation in a Texas Hispanic population: a comparison study. J Forensic Sci 54:651–657
- Lee SH, Lee JY, Park HK, Kim YK. 2009. Development of third molars in Korean juveniles and adolescents. Forensic Sci Int 188:107–111
- Li G, Ren J, Zhao S, Liu Y, Li N, Wu W, Yuan S, Wang H. 2012. Dental age estimation from the developmental stage of the third molars in western Chinese population. Forensic Sci Int 219:158–164
- Low VHS. 2012. Dr Vincent Low (Submission 15) [Online]. Sydney: Australian Human Rights Commission. Available online at: http://www.humanrights.gov.au/publications/submissions-age-assessment-people-smuggling-cases-inquiry-treatment-individuals (accessed July 19, 2013)
- Marshall WA, Tanner JM. 1969. Variations in pattern of pubertal changes in girls. Arch Dis Child 44:291–303
- Marshall WA, Tanner JM. 1970. Variations in pattern of pubertal changes in boys. Arch Dis Child 45: 13–23
- Martin-De Las Heras S, Garcia-Fortea P, Ortega A, Zodocovich S, Valenzuela A. 2008. Third molar development according to chronological age in populations from Spanish and Magrebian origin. Forensic Sci Int 174:47–53
- Mincer HH, Harris EF, Berryman HE. 1993. The A.B.F.O. study of third molar development and its use as an estimator of chronological age. J Forensic Sci 38:379–390
- Olze A, Bilang D, Schmidt S, Wernecke KD, Geserick G, Schmeling A. 2005. Validation of common classification systems for assessing the mineralization of third molars. Int J Legal Med 119:22–26
- Olze A, Taniguchi M, Schmeling A, Zhu B-L, Yamada Y, Maeda H, Geserick G. 2004. Studies on the chronology of third molar mineralization in a Japanese population. Leg Med (Tokyo) 6:73–79
- Roberts GJ, Parekh S, Petrie A, Lucas VS. 2008. Dental age assessment (DAA): a simple method for children and emerging adults. Br Dent J 204:E7
- Schmeling A, Reisinger W, Loreck D, Vendura K, Markus W, Geserick G. 2000. Effects of ethnicity on skeletal maturation: consequences for forensic age estimations. Int J Legal Med 113:253–258
- Schmeling A, Schulz R, Reisinger W, Muhler M, Wernecke KD, Geserick G. 2004. Studies on the time frame for ossification of the medial clavicular epiphyseal cartilage in conventional radiography. Int J Legal Med 118:5–8
- Separated Children in Europe Programme (Scep). 2011. Review of current laws, policies and practices relating to age assessment in sixteen European Countries [Online]. Leiden: Separated Children in Europe Programme, coordinated by Defence for Children. Available onine at: http://www.separated-children-europe-programme.org/images/17/166.pdf (accessed February 5, 2014)
- Tanner JM, Healy MJR, Goldstein H, Cameron N. 2001. Assessment of skeletal maturity and prediction of adult height (TW3 method). London: WB Saunders
- Tanner JM, Whitehouse RH, Healy MJR. 1962. A new system for estimating skeletal maturity from the hand and wrist, with standards derived from a study of 2,600 healthy British children. Paris: International Children's Centre
- Tanner JM, Whitehouse RH, Marshall WA, Healy MJR, Goldstein H. 1983. Assessment of skeletal maturity and prediction of adult height (TW2 method). London: Academic Press
- Thodberg HH, Savendahl L. 2010. Validation and reference values of automated bone age determination for four ethnicities. Acad Radiol 17:1425–1432