
Abstract
Background Early detection of abnormal weight gain in childhood may be important for preventive purposes. It is still debated which annual changes in BMI should warrant attention.
Aim To analyse 1-year increments of Body Mass Index (BMI) and standardised BMI (BMI SDS) in childhood and explore conditional change in BMI SDS as an alternative method to evaluate 1-year changes in BMI.
Subjects and methods The distributions of 1-year increments of BMI (kg/m2) and BMI SDS are summarised by percentiles. Differences according to sex, age, height, weight, initial BMI and weight status on the BMI and BMI SDS increments were assessed with multiple linear regression. Conditional change in BMI SDS was based on the correlation between annual BMI measurements converted to SDS.
Results BMI increments depended significantly on sex, height, weight and initial BMI. Changes in BMI SDS depended significantly only on the initial BMI SDS. The distribution of conditional change in BMI SDS using a two-correlation model was close to normal (mean = 0.11, SD = 1.02, n = 1167), with 3.2% (2.3–4.4%) of the observations below −2 SD and 2.8% (2.0–4.0%) above +2 SD.
Conclusion Conditional change in BMI SDS can be used to detect unexpected large changes in BMI SDS. Although this method requires the use of a computer, it may be clinically useful to detect aberrant weight development.
Introduction
Early detection of abnormal weight gain is of importance for the prevention of overweight. Therefore, identifying aberrant changes in BMI should optimally be included in routine clinical care. Similar strategies have been evaluated also for height in relation to short stature (Grote et al., Citation2008; Oostdijk et al., Citation2009) and Turner syndrome (Saari et al., Citation2012).
Cross-sectional BMI charts with sex and age-adjusted cut-offs for overweight and obesity serve in many countries as guidelines for referral of obese children (Cole et al., Citation2000). However, the shortcomings of a single BMI as a measure of body composition are well known (Freedman & Sherry, Citation2009; Freedman et al., Citation2008; Prentice & Jebb, Citation2001) and it has been questioned which change in BMI should warrant attention. A US expert committee concluded that for most children an annual gain of 3–4 kg/m2 in BMI probably reflects a rapid increase in body fat (Barlow & Dietz, Citation1998) and, in a study from Japan, an annual change in BMI SDS of 2 standard deviations (SD) was proposed as an indicator of a rapid increase in body fat (Inokuchi et al., Citation2011). This was equivalent to 1–2 BMI kg/m2/year in younger children and 2–3 BMI kg/m2/year in older children.
Appropriate information on changes over time can only be obtained from longitudinal references like velocity charts or increments by age (Cole, Citation1998). Two common methods for assessing change in growth over time are: (1) velocity on the measurement scale (e.g. cm/year) and (2) velocity on the SDS scale (change in SDS over time). Velocity on the measurement scale is a straightforward parameter, but normal limits depend on age and interval between measurements. Change in SDS over time (Inokuchi et al., Citation2011) is a more flexible approach, but it assumes tracking along percentiles and has been shown to be biased (Cole, Citation1998). However, in the current paper we explore a third method, conditional change in SD scores, which is comparable to velocity on the SD scale, but also takes the SDS of the first measurement into account (Cole, Citation1998; Healy, Citation1974). This method corrects for regression to the mean and has been shown to be unbiased. Conditional growth based on the correlation between longitudinal measurements has been validated for weight in the UK (Cole, Citation1998) and for length, height, weight and head circumference in Belgium (Roelants, Citation2013). To our knowledge, conditional change in BMI SDS has not been published before in the framework of monitoring overweight. Equivalent norms for the conditional change in BMI SDS could potentially serve as a supplement to single BMI cut-offs and give guidance about unexpectedly large changes in BMI compared to a child’s peers.
The aims of this work were to analyse 1-year BMI increments in Norwegian children and adolescents and to validate conditional change in BMI SDS as an alternative approach to detect abnormal weight gain beyond infancy.
Subject and methods
Subjects and measurements
The Bergen Growth Study (BGS) is a cross-sectional growth study conducted in the city of Bergen, Norway, including 8299 children from 0–19 years of age. Children were recruited in a random selection of well-baby centres, kindergartens and schools. Data from the BGS formed the basis for the current national growth references for Norwegian children and have been described in detail previously (Juliusson et al., Citation2013). A sub-set of children who participated in the BGS were invited for a second measurement of height and weight 1 year after the initial measurement. For the present study, a second measurement of weight and height was available for 1167 children (576 boys, 591 girls) between 6–14.99 years of age and free from any known condition that might affect growth. The time between measurements was ∼1 year (range = 0.98–1.09), except for one boy with an interval of 1.79 years and one girl with an interval of 1.62 years. These were not excluded, as BMI increments were adjusted for time. Mean and SD of height, weight and BMI by age and sex in the sub-set were comparable to that in the total reference sample.
Statistical analysis
The BMI was calculated from measured height and weight as weight/height2 (kg/m2), and converted to SDS using the national BMI reference (Juliusson et al., Citation2013). Annual BMI increments on the measurement scale (ΔBMI) were obtained by subtracting the BMI of the first measurement from the BMI of the second measurement and scaled to exactly 1 year by dividing by the time between both measurements. The change in standardised BMI was not adjusted for the measurement interval.
The distribution of BMI increments by age was summarised by calculating raw percentiles within age groups. Differences between sexes and between weight categories (normal weight including underweight, vs overweight including obese) were tested within age groups with a t-test. Children were grouped by age at last birthday (6: 6.00–6.99 years, etc.).
Weight status was determined by the IOTF age and sex-specific cut-offs for the BMI as underweight (BMI < 18.5 kg/m2), normal weight (BMI 18.5–25 kg/m2), overweight (equivalent to adult BMI ≥ 25 kg/m2) and obesity (equivalent to adult BMI ≥30 kg/m2) (Cole et al, Citation2000).
The effects of sex, age, weight, height, BMI and weight status on the BMI and BMI SDS increments were analysed with linear regressions. Results are expressed as unstandardised regression coefficients with 95% confidence interval. Results are given for simple (unadjusted) linear regression models for each independent variable separately, fully adjusted multiple linear regression models including all variables and a final (adjusted) model that includes only significant predictors, selected by a backward stepwise procedure. For multiple regression models, the coefficient of determination (R2) is reported.
The conditional change in BMI SDS was calculated using the Pearson correlation coefficient between the first and second BMI SDS within age groups. Data from boys and girls were combined as the correlations by age were highly comparable in both sexes. Based on these annual correlations we decided to split the dataset in two parts (6–11 years and 12–15 years) and use a single correlation coefficient (r) for each age group. The conditional expected BMI SDS after 1 year (BMI2 SDS°) is obtained from the first measurement (BMI1 SDS) as: BMI2 SDS° = r*BMI1 SDS and has a standard deviation of √1 − r2. By subtracting the expected value (BMI2 SDS°) from the observed BMI SDS after 1 year (BMI2 SDS) and dividing this value by the standard deviation of the expected BMI (√1 − r2), we obtain a conditional SDS, which is symmetrically distributed around a mean of 0, has an SD of 1 and includes ∼95% of the observations between −2 and +2 SD. The model was validated by assessing these properties in our data.
IBM SPSS Statistics version 23 (IBM Corp 2013) was used for descriptive statistics, t-tests and regression analysis and R, version 3.1 (R Foundation for Statistical Computing) was used for the conversion of measurements to SDS and calculation and validation of conditional gains. A test probability of p < 0.05 was considered statistically significant.
The study has been approved by the Regional Committee for Medical Research Ethics and the Norwegian Data Inspectorate. Written consent was obtained from the parents of each participating child and above 12 years of age from the child as well.
Results
BMI increments increased slightly with minor variations during childhood and reached a peak by 13 years, followed by a decrease in older children. In both sexes, ∼10% of the children had negative annual BMI increments. The maximum difference between the smallest and largest BMI increments within any age group was 2.6 kg/m2 in both girls and boys. The mean change in BMI SDS (ΔBMI SDS) was close to 0, with no particular tendency in different age groups, and the difference between the 10th and the 90th percentile was below 1 SDS, except in 13 year old girls, where this difference was 1.15 SDS. Selected percentiles of 1 year increments of BMI and BMI SDS are given in and .
Table 1. One year increments of body mass index (ΔBMI) according to sex, age and percentile in a sample of 1167 Norwegian children between 2003–2007.
Table 2. One year increments of BMI SDS (ΔBMI SDS) according to sex, age and percentile in a sample of 1167 Norwegian children between 2003–2007.
BMI and BMI SDS did not differ significantly between boys and girls within age groups, except at 8 years of age where increments were higher in boys than in girls (mean difference in BMI by 8 years = 0.38 kg/m2, p = 0.004; and mean difference in BMI SDS = 0.16, p = 0.003).
In the regression analysis of ΔBMI on the measurement scale, sex (boys), height and BMI by first measurement influenced ΔBMI positively, while weight influenced ΔBMI negatively (). For ΔBMI SDS, only BMI SDS of the first measurement remained significant in the final model ().
Table 3. Results from linear regression analysis of 1 year increments of BMI in 1167 Norwegian children (576 boys), 6.00–14.99 years of age/
Table 4. Results from linear regression analysis of 1 year increments of BMI SDS in 1167 Norwegian children (576 boys), 6.00–14.99 years of age.
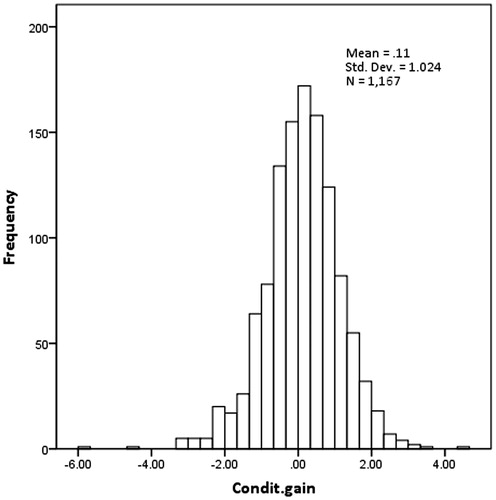
Based on annual correlations between the BMI SDS of the first and the second measurement (), the correlation coefficient in each age group was: r = 0.95 from 6–11 years and r = 0.92 from 12–14 years. When the conditional gain in BMI SDS using this two-correlation model was validated, the mean z-score (0.11, SD = 1.02, n = 1167) was close to the expected value of zero, although even this small difference was statistically significant (p < 0.001); 3.2% (2.3–.4%) of the observations were below −2 SD and 2.8% (2.0–4.0%) above +2 SD. The distribution of conditional gain SDS was symmetrical (), but with heavier tails than expected. These validation statistics did not improve when using three or higher order correlation models (data not shown).
Figure 1. Correlation between standard deviation scores of the BMI (BMI SDS) and BMI SDS after 1 year in annual age groups from 6.00–14.99 years of age.
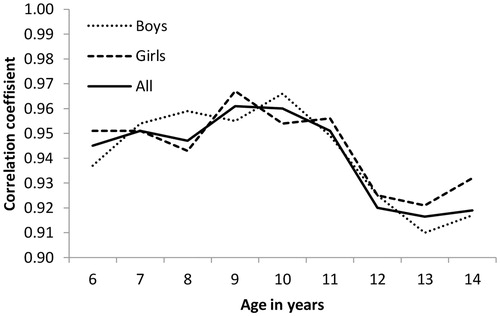
Figure 2. Distribution of standard deviation scores of 1 year conditional change in BMI in 1167 Norwegian children from 6.00–14.99 years of age.
Discussion
In the present study we have analysed 1 year increment data of childhood BMI and BMI SDS and proposed a two-correlation model for conditional gain in BMI SDS.
We could not detect any statistically significant differences in mean gain between boys and girls except in 8-year old children and also the correlations between annual measurements were highly comparable between sexes. This confirms findings by other authors who could not detect sex differences, which were expected due to a different timing of puberty (Demerath et al., Citation2006; Rogol et al., Citation2002; Siervogel et al., Citation2000).
Although there was a tendency of increasing BMI increments up to 12–13 years in both sexes followed by a decrease in the oldest age group, the increments were relatively stable in the age range studied. We have previously observed a higher prevalence of overweight and obesity among 7–11 year old children (Juliusson, Citation2010) and we, therefore, expected larger changes during these years. One explanation of these findings could be that overweight children are temporarily taller than normal weight children (Stovitz et al., Citation2008), so that the relationship between height and weight does not change substantially, at least until height velocity diminishes. The condition of overweight may also have been developed before 6 years of age, leaving a less marked change in BMI increments in older age groups.
From the regression analysis of ΔBMI, using non-standardised anthropometric measures, we found that children with a higher BMI had larger positive increments, although the explained variance was low. Boys had somewhat larger increments compared to girls and height had a positive effect on the change in BMI. The negative effect of weight on BMI increments in the fully adjusted model could be influenced by regression to the mean. When using standardised BMI already adjusted for sex and age, only the BMI SDS of the first measurement had a significant effect on ΔBMI SDS in the final model and this was negative. This may also be an effect of regression to the mean.
To our knowledge, conditional change in BMI SDS has not been used before to detect large changes in BMI in order to reduce the risk of developing overweight. Inokuchi et al. (Citation2011) described a very similar method, based on correlations, but did this to estimate the variance of the unconditional change in BMI SDS. This method does not account for regression to the mean and could, therefore, be biased. More recently, a similar approach was used by Saari et al. (Citation2015) to detect weight loss as an early sign of coeliac disease in children. Conditional change in BMI SDS offers an alternative way of evaluating changes in BMI between two time points, provided that the correlation is known, and a matching growth reference to convert the measurements to SD scores is available. An advantage of this approach is that the conditional change in BMI SDS accounts for the starting position and does not have to discriminate between light and heavy subjects. The distribution of the conditional gain showed somewhat heavier tails compared to the standard normal distribution and accordingly more observations were below – 2 SD and above +2 SD. However, given that the distribution is symmetrical and ∼94% of the observations were found between ±2 SD, we believe that this approach is meaningful and may give guidance about the change in BMI SDS that is typically observed in the majority of the population. This offers a possibility to interpret how much a particular child’s gain in BMI differs from its peers. One example: A 12 year old boy has a BMI by first assessment (BMI1) of 18.66 (BMI1 SDS = 0.28). After 1 year his BMI (BMI2) is 20.81 (BMI2 SDS = 0.80). During 1 year he has changed BMI by 2.15. Is this gain unusually large compared to his peers? We calculate his conditional gain by using r = 0.92: Expected BMI SDS after 1 year = 0.92*0.28 (r*BMI1 SDS) = 0.26. The difference between observed BMI2 SDS and expected is: 0.80 – 0.26 = 0.54. His conditional change expressed as z-score is 0.54/ √ 1 – 0,922 = 1.38, which is above average, but still within the typical range defined by ±2 SD. This method (as the method by the US Expert Committee (Barlow & Dietz, Citation1998) and the method from Japan (Inokuchi et al., Citation2011), mentioned previously) gives no information about body composition, but in most settings outside a specialised obesity clinic there is often no alternative assessment procedure. In these settings, information on the change in BMI could be an important and valuable addition to the actual BMI. Several studies have shown that an upward trend in BMI is usually persistent (Glavin et al., Citation2014). Conditional change in BMI SDS provides a framework to determine frequency based cut-off values (analogous to for instance ±2 SD for length). To detect optimal cut-off, more data and preferably longitudinal data are needed. Further studies are also needed to investigate whether this method is useful as a guide for early detection of the overweight risk, but we believe it has potential and can be easily implemented in computerised growth journals, flagging children with aberrant changes in BMI. When a computer is not at hand, the correlation coefficients can be used to provide a rough guideline for assessing the unconditional change in BMI SDS relative to a paper growth chart. The variance of the unconditional change is 2*(1 − r) and a typical range that includes 95% of the population is, thus, given by ±0.62 SD in 6–11 year old children and 0.78 SD in 12–14 year old children. On a typical centile chart (with centiles spaced 2/3rds of an SD apart), the former is slightly less than one centile band; and the latter is slightly more than one centile band. It should be noted that new correlation studies must be done for other populations before deciding which correlations coefficient to use in the population studied.
A possible weakness of this study is the single (short) time interval of 1 year. Expanding this to shorter and longer intervals could increase the flexibility of this approach. Also, conditional change in BMI SDS should be used cautiously in children that have a high BMI at start, i.e. in children who are overweight or obese. Cole et al. (Citation2005) have previously analysed the change in BMI SDS in a group of Italian pre-school children, including some with a high initial BMI according to the Centres for Disease Control BMI reference. They found that the variance of the change in BMI SDS over time was lower in children with a high BMI SDS, in which case the method of conditional change proposed here is not valid. This apparent contradiction highlights an important, but known, condition, as well as a limitation of conditional change based on the correlation between SD scores. The condition is the need for a well matched growth reference to convert measurements to SD scores (Cole, Citation1998) and the limitation is that the method is not suitable for monitoring a group of children that are already overweight or obese. Both problems are avoided if a recent local BMI reference is used to detect relatively large changes in BMI before the onset of overweight or obesity. However, as pointed out by Cole et al. (Citation2005), conditional change in BMI is, for instance, not suitable to monitor progress in weight reduction programmes.
In conclusion, 1 year BMI increments are higher for children with higher BMI. Conditional change in BMI SDS is an alternative method to evaluate BMI changes, which provides more accurate information relative to a reference population. Although further research is needed, we believe that this method can serve as a ‘red light signal’ in computerised growth journals to identify children with a relative large increase in BMI compared to their peers and, thus, offer the possibility of early intervention.
Disclosure statement
The authors report no conflicts of interest. The authors alone are responsible for the content and writing of the paper.
References
- Barlow SE, Dietz WH. 1998. Obesity evaluation and treatment: Expert Committee recommendations. The Maternal and Child Health Bureau, Health Resources and Services Administration and the Department of Health and Human Services. Pediatrics 102:E29.
- Cole TJ. 1998. Presenting information on growth distance and conditional velocity in one chart: practical issues of chart design. Stat Med 17:2697–2707.
- Cole TJ, Bellizzi MC, Flegal KM, Dietz WH. 2000. Establishing a standard definition for child overweight and obesity worldwide: international survey. BMJ 320:1240–1243.
- Cole TJ, Faith MS, Pietrobelli A, Heo M. 2005. What is the best measure of adiposity change in growing children: BMI, BMI %, BMI z–score or BMI centile? Eur J Clin Nutr 59:419–425.
- Demerath EW, Schubert CM, Maynard LM, Sun SS, Chumlea WC, Pickoff A, Czerwinski SA, Towne B, Siervogel RM. 2006. Do changes in body mass index percentile reflect changes in body composition in children? Data from the Fels Longitudinal Study. Pediatrics 117:e487–e495.
- Freedman DS, Sherry B. 2009. The validity of BMI as an indicator of body fatness and risk among children. Pediatrics 124(Suppl 1):S23–S34.
- Freedman DS, Wang J, Thornton JC, Mei Z, Pierson RN, Jr, Dietz WH, Horlick M. 2008. Racial/ethnic differences in body fatness among children and adolescents. Obesity (Silver Spring) 16:1105–1111.
- Glavin K, Roelants M, Strand BH, Juliusson PB, Lie KK, Helseth S, Hovengen R. 2014. Important periods of weight development in childhood: a population-based longitudinal study. BMC Public Health 14:160.
- Grote FK, Van Dommelen P, Oostdijk W, De Muinck Keizer-Schrama SM, Verkerk PH, Wit JM, Van Buuren S. 2008. Developing evidence-based guidelines for referral for short stature. Arch Dis Child 93:212–217.
- Healy MJ. 1974. Notes on the statistics of growth standards. Ann Hum Biol 1:41–46.
- Inokuchi M, Matsuo N, Takayama JI, Hasegawa T. 2011. Tracking of BMI in Japanese children from 6 to 18 years of age: reference values for annual BMI incremental change and proposal for size of increment indicative of risk for obesity. Ann Hum Biol 38:146–149.
- Juliusson P. 2010. Overweight and obesity in Norwegian children. Trends, current prevalence, effect of socio-demographic factors and parental perception. PhD, University of Bergen, Norway.
- Juliusson PB, Roelants M, Nordal E, Furevik L, Eide GE, Moster D, Hauspie R, Bjerknes R. 2013. Growth references for 0-19 year-old Norwegian children for length/height, weight, body mass index and head circumference. Ann Hum Biol 40:220–227.
- Oostdijk W, Grote FK, De Muinck Keizer-Schrama SM, Wit JM. 2009. Diagnostic approach in children with short stature. Horm Res 72:206–217.
- Prentice AM, Jebb SA. 2001. Beyond body mass index. Obes Rev 2:141–147.
- Roelants M. 2013. Normal variation in human growth. PhD, Vrije Universiteit Brussel.
- Rogol AD, Roemmich JN, Clark PA. 2002. Growth at puberty. J Adolesc Health 31:192–200.
- Saari A, Harju S, Makitie O, Saha MT, Dunkel L, Sankilampi U. 2015. Systematic growth monitoring for the early detection of celiac disease in children. JAMA Pediatr 169:e1525.
- Saari A, Sankilampi U, Hannila ML, Saha MT, Makitie O, Dunkel L. 2012. Screening of turner syndrome with novel auxological criteria facilitates early diagnosis. J Clin Endocrinol Metab 97:E2125–E2132.
- Siervogel RM, Maynard LM, Wisemandle WA, Roche AF, Guo SS, Chumlea WC, Towne B. 2000. Annual changes in total body fat and fat-free mass in children from 8 to 18 years in relation to changes in body mass index. The Fels Longitudinal Study. Ann N Y Acad Sci 904:420–423.
- Stovitz SD, Pereira MA, Vazquez G, Lytle LA, Himes JH. 2008. The interaction of childhood height and childhood BMI in the prediction of young adult BMI. Obesity (Silver Spring) 16:2336–2341.