
Abstract
This study assessed daily rest-activity patterns in euthymic, medication-naïve bipolar phenotype individuals. The Mood Disorder Questionnaire was used to identify 19 bipolar phenotype individuals and 21 controls. Participants wore an Actiwatch-L for 2 weeks to assess their sleep behaviour and circadian rest-activity rhythmicity. Bipolar phenotype individuals had increased movement during sleep, as assessed by the fragmentation index, greater activity levels during their least active 5 h (2 am–7 am), and lower circadian relative amplitude compared to controls. Higher activity levels during sleep affecting circadian amplitude in young adults with the bipolar phenotype may be associated with vulnerability for developing mood disorder.
Introduction
Disruptions in sleep and circadian rhythms are common in psychiatric disorders, including mood disorders (Wulff et al., Citation2010). Sleep disruption is an intrinsic clinical feature of all phases of bipolar disorder, with patients experiencing insomnia or hypersomnia during depressive episodes and reduced need for sleep during (hypo-) manic episodes. Overall, a recent review found that 23–78% of depressed patients experienced hypersomnia, 58–60% of depressed patients experienced difficulty falling asleep, and 69–99% of manic patients experienced reduced need for sleep in published studies (Harvey, Citation2008). Furthermore, circadian instability, including changes in sleep–wake timing, is seen in approximately two-thirds of bipolar patients between episodes (Harvey et al., Citation2005), with euthymic bipolar patients showing reduced daytime activity (Harvey et al., Citation2005) and greater fragmentation of daily rest-activity patterns (Jones et al., Citation2005). In addition, sleep–wake activity levels have been shown to discriminate between patients with depression and healthy individuals (Moraes et al., Citation2013). However, there are important limitations to the many studies that have recorded sleep and circadian rhythm disruption in euthymic bipolar patients. Even during euthymia there may be quite marked mood instability and, more importantly, medication confounds which are almost inevitable when studying a severe psychiatric disorder. Moreover, there may be great variability in the number and severity of previous illness episodes. Although this may be addressed in part by studying first-episode bipolar disorder, these patients may not in fact be experiencing their first episode owing to frequent misdiagnosis and delayed diagnosis of bipolar disorder (Bowden, Citation2001).
Studies in at-risk groups enable the investigation of sleep and circadian rhythmicity to take place in the absence of state-dependent mood changes, scar effects of repeated mood episodes, or the effects of medications. A continuum approach is increasingly being applied in the investigation of subclinical psychiatric disorders in the search for vulnerability markers and risk-factors associated with these disorders, specifically when assessing cognitive and emotional functioning (Chan et al., Citation2009; Mannie et al., Citation2008; Rock et al., Citation2010) and when establishing criteria for novel assessment tools (Leopold et al., Citation2012). According to this approach, hypomania or mixed states and dissociative symptoms and sub-threshold depression are considered features of a bipolar phenotype.
The Mood Disorder Questionnaire (MDQ) is a self-report screening tool for bipolar phenotype that targets mood-elevation symptoms (Hirschfeld et al., Citation2000). Experience of mood elevation is predictive of depression as well as bipolar disorder (Lewinsohn et al., Citation2003), and high scores on the MDQ are associated with increased probability of a diagnosis of bipolar disorder (usually bipolar II disorder). For example, when used with validated screening criteria (≥7 mood-elevation symptoms of the 13 and endorsement of the co-occurrence and problematic nature of symptoms), the MDQ had a high sensitivity for detecting bipolar disorder (0.73) and a very good specificity (0.90) for screening out those without bipolar disorder in a psychiatric sample (Hirschfeld et al., Citation2000). In a previous study, we described the utility of the MDQ in identifying a bipolar phenotype relatively common in adolescence and characterised the emotional processing abnormalities existent in this group (Rock et al., Citation2010). In that study, we used the MDQ with adjusted screening criteria (≥7 mood-elevation symptoms alone), and the positive predictive value of the MDQ for bipolar disorder was 38% (Rock et al., Citation2010). The present study used actigraphy to investigate sleep behaviour and daily rest-activity rhythms in a subset of these medication-naïve bipolar phenotype individuals.
Methods
Participants
Participants were recruited through the University of Oxford Student Stress Survey and had completed the MDQ online. Forty undergraduate students (20 female, 20 male; aged 18.4–24.7 years) with either high or low scores on the MDQ (Hirschfeld et al., Citation2000) gave their written informed consent to participate in the study, which was approved by Oxfordshire Research Ethics Committee (REC 05/Q1606/174). Nineteen participants were in the high MDQ bipolar phenotype group by virtue of high scores on the MDQ (mean MDQ score ± standard deviation = 9.0 ± 1.5, range = 7–12). This group was compared with 21 control participants with low scores on the MDQ (mean MDQ score ± standard deviation = 0.3 ± 0.6, range = 0–2).
The Mini International Neuropsychiatric Interview-Plus (MINI-Plus) (Sheehan et al., Citation1998) was used to screen participants for current or prior psychiatric disorder, including any history of alcohol or other substance abuse. MINI-Plus criteria were used to identify cases of bipolar I, bipolar II, and bipolar not otherwise specified (NOS). In addition to possible diagnoses of major depression and/or (hypo-)mania, acceptable co-morbidities for bipolar phenotype participants included generalised anxiety disorder (GAD), panic disorder, agoraphobia, social phobia, and specific phobia on the condition that the co-morbidity did not interfere with participation. Control participants were screened to exclude any current or prior psychiatric disorder. Where clinical judgement indicated an absence of functional impairment, participants endorsing sufficient criteria to receive a liberal MINI-Plus alcohol dependence diagnosis were not excluded. All participants were screened to exclude those with history of significant medical disorder, pregnancy and lactation, current usage of any medication other than contraception, and any history of antidepressant, mood stabiliser, or antipsychotic use. Details of family history of mood and psychotic disorder, including bipolar disorder, were sought.
Clinical assessments and characterisation of chronotype
To assess mood, participants were interviewed with the 17-item Hamilton Depression Rating Scale (HAM-D) (Hamilton, Citation1960) and the Young Mania Rating Scale (YMRS) (Young et al., Citation1978). All participants were euthymic at time of assessment (HAM-D ≤8 and YMRS ≤8).
Diurnal (day/night) preference, i.e. chronotype, was assessed with the Morningness–Eveningness questionnaire (MEQ), which has been validated for young adults (Horne & Ostberg, Citation1976). Higher scores are associated with a greater degree of morningness, which is associated with earlier waking and bedtime, while eveningness is associated with later waking and bedtime. A score of 16–30 represents extreme evening type, 31–41 represents moderate evening type, 42–58 represents neither type, 59–69 represents moderate morning type, and 70–86 represents extreme morning type in student-aged subjects (Horne & Ostberg, Citation1976).
Sleep–wake monitoring
The sleep–wake cycle of each participant and exposure to light were simultaneously monitored for a period of approximately 2 weeks (9–16 days) using actigraphs with an integrated light sensor (Actiwatch-L) worn on wrist of the participant’s non-dominant hand. Any intrinsic variability among the watches was addressed by ensuring that the same watch was used equally in both groups. Actigraphs contain a miniaturised piezoelectric accelerometer that detects the movement-induced force and stores this information in a memory chip. Data were collected in the Actiwatch’s integration mode, which generated an activity score linked to the amplitude of movement. Equidistant 1-min sampling was used to give an activity score that represented the sum of the maximum activity counts for each of 60 one-second epochs within each minute. Participants wore the watch continuously, but removed it when it might get wet or damaged such as during showering or sport. Participants also completed a standardised diary for the duration of actigraphic monitoring to provide a daily record of bedtime, get-up time, naps, day-time activities and any periods during which the watch was removed.
Data analysis
Activity and light data from Actiwatches were downloaded to a computer, and actigraphs showing the rest-activity and light patterns were generated and analysed with Actiwatch Activity and Sleep Analysis software (Actiwatch software version 7.23, Cambridge Neurotechnology, Cambridge, UK). Diary information was then added manually to the printed actograms to verify the concordance with the actigraphic data, to determine “bedtime” and “get-up time” and to edit gaps when the watch was removed, for example to avoid water when swimming, showering or bathing. “Bedtime” was denoted as the time from which the participant was trying to sleep, i.e. lights were off and participant was lying still. “Get-up time” was the earliest time at which there was significant and sustained movement in the morning. The automated algorithm of the Actiwatch software was used to establish “sleep onset time” and “final wake time” for each night and to calculate sleep/wake estimates. Sleep estimates, derived from the actigraphic sleep analysis, included “total sleep period” (defined as time between “sleep onset time” and “final wake time”, including periods of activity above threshold of 40-activity counts, defined as “wake time” by the algorithm), “total sleep time” (defined as time between “sleep onset time” and “final wake time”, excluding periods defined as “wake time”), “sleep onset latency” (defined as time between “bedtime” and “sleep onset time”), “sleep efficiency” (defined as percentage of time spent asleep between “sleep onset time” and “final wake time”) and “fragmentation index” (providing a measure of the frequency and intensity of physical movements; >50 is considered bad, <20 is considered very good). Sleep/wake estimates were averaged over the entire recording period. Days with missing data of more than 3 h (e.g. when the participant forgot the Actiwatch) were excluded from further analysis.
Non-parametric circadian rhythm analysis was also performed using Actiwatch Activity and Sleep Analysis software (Actiwatch software version 7.23, Cambridge Neurotechnology, UK). A 10-h window (“M10”) and another 5-h window (“L5”) were moved in 1-h steps across each day to determine periods of the 10 most active hours and the 5 least active hours, respectively. The onset times of these windows were defined as “M10 onset time” and “L5 onset time”, while the levels of activity during these periods were defined as “M10 activity” and “L5 activity”, respectively. Circadian rhythm parameters were calculated automatically and included “relative amplitude” (reflecting the difference between “M10 activity” and “L5 activity”), “inter-daily stability”, and “intra-daily variability”. “Relative amplitude” reflects the difference between M10 activity and L5 activity and is calculated as follows: (M10−L5)/(M10+L5). In healthy people, high circadian relative amplitude values result from greater daytime activity and reduced activity during sleep. Relative amplitude scores theoretically range from 0 to 1, with higher values indicating a circadian rhythm of higher amplitude. Inter-daily stability represents the degree of consistency of activity patterns from 1 day to the next. Inter-daily stability scores range from 0 to 1, and may typically be 0.6, with lower scores representing poor consistency of activity patterns. Intra-daily variability quantifies the fragmentation of periods of activity from periods of rest within a 24-h period. Intra-daily variability scores range from 0 to 2 and are typically below 1. Higher intra-daily variability values indicate a more fragmented rhythm and reflect shorter periods of rest and activity rather than one extended active period during the daytime and one extended rest period at night.
Statistical analysis
Age and subjective mood characteristics were analysed using independent-samples t-tests. Sleep and circadian rhythm data were analysed using univariate analyses of covariance (ANCOVA) with group and gender as fixed factors and depressive symptoms (HAM-D) and mood-elevation symptoms (YMRS) as covariates of no interest. Chi-square tests were used to analyse gender distribution and Morningness–Eveningness questionnaire responses for differences in chronotype distribution between groups. All statistical analyses were performed using SPSS (version 19.0 for Mac, SPSS Inc., Chicago, IL). A significance threshold of p < 0.05 was used for all analyses.
Results
Demographics and chronotype
Demographic characteristics and chronotype are shown in . The bipolar phenotype group and control group were matched for age and gender. All participants were euthymic (HAM-D ≤8 and YMRS ≤8) during testing, though bipolar phenotype participants had marginally higher depression and mania rating scores. Four participants (3 bipolar phenotype individuals and 1 control participant) endorsed sufficient criteria to receive a MINI-Plus alcohol dependence diagnosis, however, clinical judgement indicated an absence of functional impairment. There were similar distributions of chronotype across the bipolar phenotype group and control group.
Table 1. Demographics of the bipolar phenotype group and control group.
Actigraphy results
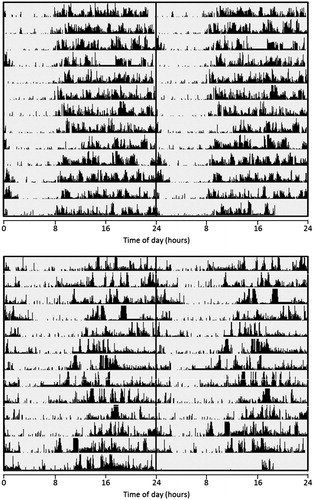
The bipolar phenotype participants had 9–15 days of actigraphy data and the control participants had 9–16 days of actigraphy data. Representative examples of rest-activity patterns in bipolar phenotype and control individuals are shown in .
Figure 1. Representative examples of rest-activity patterns derived from 2 weeks’ wrist activity monitoring in control (upper panel) and bipolar phenotype (lower panel) female individuals. Actigraphic data are 48-h double plotted with successive days on vertical axis. Midline indicates midnight between day 1 and day 2. Edited data are highlighted with “___”.
Analysis of sleep parameters () revealed that bipolar phenotype participants had more frequent physical movements of higher intensity during sleep, as assessed by the fragmentation index, compared to controls. Time of sleep onset and final waking, total sleep period, total sleep time, sleep onset latency, and sleep efficiency did not differ significantly between groups.
Table 2. Parameters of sleep–wake activity in the bipolar phenotype group and control group.
Analysis of non-parametric circadian rhythm parameters () revealed that, relative to controls, bipolar phenotype participants had greater activity levels during their least active 5 h, between approximately 2 am and 7 am (L5 activity). Correspondingly, bipolar phenotype participants also had lower circadian relative amplitude, reflecting a smaller difference in activity between their most active 10 h, between 11 am and 9 pm, and their least active 5 h. Time of onset of the most active 10 h and the least active 5 h, activity during the most active 10 h, inter-daily stability, and intra-daily variability did not differ significantly between groups.
Table 3. Parameters of circadian rhythms in activity in the bipolar phenotype group and control group.
Exclusion of participants with a bipolar diagnosis
To assess whether group differences may have been related to bipolar diagnosis, analyses were performed excluding four individuals with a diagnosis of bipolar II disorder and three individuals with a diagnosis of bipolar NOS, thereby including only those vulnerable individuals without a prior bipolar diagnosis.
After exclusion of bipolar phenotype participants with a diagnosis of bipolar II disorder or bipolar NOS, there remained a significant group difference for physical movements during sleep, as assessed by the fragmentation index (F(1,27) = 8.065, p = 0.008), activity during the least active 5 h (F(1,27) = 6.779, p = 0.015), and the relative amplitude of their rest-activity rhythm (F(1,27) = 5.200, p = 0.031).
Discussion
This actigraphic study recorded differences in rest-activity behaviour between young adults with the bipolar phenotype and matched controls. The bipolar phenotype was associated with frequent movements of high intensity during sleep (i.e. indexed as fragmentation) alongside increased levels of activity during participants’ least active 5 h (between 2 am and 7 am) (L5 activity) and corresponding reductions in their relative amplitude of the circadian rest-activity rhythm.
Changes in sleep and circadian patterns are potentially relevant to the pathological process of bipolar disorder alongside sub-threshold depression, hypomanic or mixed states and dissociative symptoms. These features have been considered to be part of a phenotypic bipolar mania prodrome (Correll et al., Citation2007) and have been included in a first catalogue of high-risk factors in support of recognition of vulnerable individuals (Leopold et al., Citation2012). In the absence of a standardised instrument to screen for risk factors, various self-report scales for symptoms of bipolar disorder and structured interviews have been used to evaluate the prodromal bipolar phenotype (Ankers & Jones, Citation2009; Jones et al., Citation2006; Ritter et al., Citation2012). In our study, we used the MDQ to distinguish students at elevated risk – by applying a threshold of seven or more symptoms of mood elevation – from students at very low risk – by applying a threshold of no more than two symptoms.
There have now been a number of studies assessing sleep and circadian rhythms in individuals with the prodromal bipolar phenotype. First, Ankers and Jones (Citation2009) used the Hypomanic Personality Scale (Eckblad & Chapman, Citation1986) to identify individuals at risk of hypomania. They assessed sleep and rest-activity patterns with the same type of accelerometer (Actiwatch) and the same algorithms provided with the software as in the present study. The study corresponded with our own in that the variability within and between days as well as sleep latency and sleep efficiency were similar between groups while the high-risk groups showed significantly lower amplitudes in their rest-activity rhythms than controls. However, Ankers and Jones (Citation2009) reported significantly shorter sleep duration for the high-risk group compared to controls, while durations were similar in the present study. Our bipolar phenotype group showed more physical movements during sleep than our control group but overall this level was better than in the Ankers and Jones (Citation2009) study, which did not report a between-group difference. This minor systematic difference between the studies might be related to the different epochs lengths with which data were recorded, namely one minute in our study and every 15 s in Ankers and Jones's study (Citation2009).
Secondly, a recent actigraphic study that used a different recording and software system (Ritter et al., Citation2012) compared a small group of at-risk subjects, defined on the basis of either experience of a previous episode of major depression with sub-threshold mania symptoms or a first- or second-degree relative with mood disorder, with patients and healthy controls. Activity levels during sleep were generally higher in high-risk subjects, which is comparable to the present study. The sleep disturbances in the patient group were similar to the at-risk group, again supporting continuity across the formal diagnostic boundaries into the at-risk population.
Finally, a comparison between high-risk adolescents (13–19 years), defined by having a parent with bipolar disorder, and age-matched control subjects (Jones et al., Citation2006) ran contrary to the findings discussed so far. These familial high-risk subjects showed longer sleep duration, shorter sleep latency and less fragmented sleep, indicating that age and the criteria by which high-risk is defined contribute to the heterogeneity between data. It is possible that the longer sleep duration was simply part of “normal” emotional development during adolescence (Correll et al., Citation2007).
Importantly, the pattern of abnormalities described in our study persisted when participants with a bipolar (II or NOS) diagnosis were excluded. Given that DSM-IV-TR criteria are arbitrary, it is not surprising that a formal diagnosis made no difference to the results. This further supports the validity of the broad bipolar phenotype as a platform for understanding the psychopathology and biology of mood elevation. It confirms that a sleep-activity phenotype is not limited to diagnosed bipolar patients but is also seen as a biological prodromal phenotype. Sleep–wake activity abnormalities are also associated with many other psychiatric disorders, including the schizophrenia syndrome (Pritchett et al., Citation2012; Wulff et al., Citation2012). Since there is substantial phenotypic overlap between the prodromes that may precede mania and schizophrenia, better assessment tools are needed to understand the mixture of sleep–wake activity phenotypes during the adolescent phase and to explore their predictive value as a possible risk marker of conversion to a mood or psychotic disorder.
Limitations
The limitations of this study are the use of self-report scales, the criteria by which high-risk subjects were defined, and the algorithms used to evaluate actigraphic data.
First, by using a self-report scale such as the MDQ, we were dependent on the individuals’ accuracy in reporting their bipolar symptoms. Furthermore, in a larger cohort that extended our sample from 20 to 92 bipolar phenotype individuals, the positive predictive value of the MDQ for bipolar disorder when used with the current screening criteria was relatively low at 40% (Rock et al., 2013).
Second, regarding actigraphy, while the raw data are very accurate in terms of time-stamped movements over extended periods (9–16 days), the periods of sleep are extracted from movement and not directly from brain activity, although the algorithms have been correlated with polysomnography (Lichstein et al., Citation2006). Therefore, timing of sleep start and sleep end may vary in accuracy depending on the individual patterns in relation to the pre-set sensitivity levels and thresholds, which will affect sleep latency, duration of sleep and periods of wake after sleep onset but not sleep fragmentation and activity levels because they are derived directly from activity counts without sensitivity thresholds.
Conclusions
Increased physical movements during sleep and greater activity during the least active 5 h of sleep (between 2 am and 7 am) and, correspondingly, reduced relative amplitude of circadian rest-activity cycles, were recorded in medication-naïve bipolar phenotype participants. The persistence of these patterns when analyses were repeated while excluding participants with a bipolar (II or NOS) diagnosis provides evidence that actively moving during sleep may be associated with vulnerability for a bipolar phenotype. These results provide useful insight into the potential role of a sleep phenotype in the development of bipolar disorder and may be important in understanding the efficacy of pharmacological treatments whose effects may be mediated through manipulation of sleep (Kasper et al., Citation2010).
Future longitudinal actigraphy studies are required to assess whether these differences in activity levels during sleep are stable over time and if those participants with particularly restless sleep are particularly likely to go on to develop serious mood episodes. Furthermore, these studies may provide information about changes in sleep and circadian rhythms prior to mood episode onset, and, therefore, actigraphy may have a potential role as an early warning system in patients with bipolar disorder.
Declaration of interests
PLR, GMG, CJH and KW do not have any conflicts of interest relating to the subject matter of this article. PLR is a full-time employee of Cambridge Cognition.
Acknowledgments
This work was partly funded by a Medical Research Council PhD Studentship (P. L. R.) and the NIHR University of Oxford Biomedical Research Centre (K. W.).
References
- Ankers D, Jones SH. (2009). Objective assessment of circadian activity and sleep patterns in individuals at behavioural risk of hypomania. J Clin Psychol. 65:1071–86
- Bowden CL. (2001). Strategies to reduce misdiagnosis of bipolar depression. Psychiatr Serv. 52:51–5
- Chan SWY, Norbury, R, Goodwin GM, Harmer CJ. (2009). Risk for depression and neural responses to fearful facial expressions of emotion. Br J Psychiatry. 194:139–45
- Correll CU, Penzner JB, Frederickson AM, et al. (2007). Differentiation in the preonset phases of schizophrenia and mood disorders: Evidence in support of a bipolar mania prodrome. Schizophr Bull. 33:703–14
- Eckblad M, Chapman LJ. (1986). Development and validation of a scale for hypomanic personality. J Abnorm Psychol. 95:214–22
- Hamilton M. (1960). A rating scale for depression. J Neurol Neurosurg Psychiartry. 23:56–62
- Harvey AG. (2008). Sleep and circadian rhythms in bipolar disorder: Seeking synchrony, harmony, and regulation. Am J Psychiatry. 165:820–9
- Harvey AG, Schmidt DA, Scarnà A, et al. (2005). Sleep-related functioning in euthymic patients with bipolar disorder, patients with insomnia, and subjects without sleep problems. Am J Psychiatry. 162:50–7
- Hirschfeld RM, Williams JB, Spitzer RL, et al. (2000). Development and validation of a screening instrument for bipolar spectrum disorder: The Mood Disorder Questionnaire. Am J Psychiatry. 157:1873–5
- Horne J, Ostberg O. (1976). A self-assessment questionnaire to determine morningness--eveningness in human circadian rhythms. Int J Chronobiol. 4:97–110
- Jones SH, Hare D, Evershed K. (2005). Actigraphic assessment of circadian activity and sleep patterns in bipolar disorder. Bipolar Disord. 7:176–86
- Jones SH, Tai S, Evershed K, et al. (2006). Early detection of bipolar disorder: A pilot familial high-risk study of parents with bipolar disorder and their adolescent children. Bipolar Disord. 8:362–72
- Kasper S, Hajak G, Wulff K, et al. (2010). Efficacy of the novel antidepressant agomelatine on the circadian rest-activity cycle and depressive and anxiety symptoms in patients with major depressive disorder: A randomized, double-blind comparison with sertraline. J Clin Psychiatry. 71:109–20
- Leopold K, Ritter PS, Correll CU, et al. (2012). Risk constellations prior to the development of bipolar disorders: Rationale of a new risk assessment tool. J Affect Disord. 136:1000–10
- Lewinsohn P, Seeley J, Klein D. (2003). Bipolar disorders during adolescence. Acta Psychiatr Scand. 108:47–50
- Lichstein KL, Stone KC, Donaldson J, et al. (2006). Actigraphy validation with insomnia. Sleep. 29:232–9
- Mannie ZN, Norbury R, Murphy SE, et al. (2008). Affective modulation of anterior cingulate cortex in young people at increased familial risk of depression. Br J Psychiatry. 192:356–61
- Moraes AC, Cambras T, Diez-Noguera A, et al. (2013). A new chronobiological approach to discriminate between acute and chronic depression using peripheral temperature, rest-activity, and light exposure parameters. BMC Psychiatry. 13:77
- Pritchett D, Wulff K, Oliver PL, et al. (2012). Evaluating the links between schizophrenia and sleep and circadian rhythm disruption. J Neural Transm. 119:1061–75
- Ritter PS, Marx C, Lewtschenko N, et al. (2012). The characteristics of sleep in patients with manifest bipolar disorder, subjects at high risk of developing the disease and healthy controls. J Neural Transm. 119:1173–84
- Rock PL, Chandler RA, Harmer CJ, et al. (2013). The common bipolar phenotype in young people. Int J Bipolar Disord. 1:19
- Rock PL, Goodwin GM, Harmer CJ. (2010). The common adolescent bipolar phenotype shows positive biases in emotional processing. Bipolar Disord. 12:606–15
- Sheehan DV, Lecrubier Y, Sheehan KH, et al. (1998). The Mini-International Neuropsychiatric Interview (M.I.N.I): The development and validation of a structured diagnostic psychiatric interview for DSM-IV and ICD-10. J Clin Psychiatry. 59:34–57
- Wulff K, Dijk D-J, Middleton B, et al. (2012). Sleep and circadian rhythm disruption in schizophrenia. Br J Psychiatry. 200:308–16
- Wulff K, Gatti S, Wettstein JG, Foster RG. (2010). Sleep and circadian rhythm disruption in psychiatric and neurodegenerative disease. Nat Rev Neurosci. 11:589–99
- Young RC, Biggs JT, Ziegler VE, Meyer DA. (1978). A rating scale for mania: Reliability, validity and sensitivity. Br J Psychiatry. 133:429–35