Abstract
Aims. To evaluate the profile of pro- and anti-inflammatory cytokines in type 1 diabetes mellitus (T1DM) and the way they are connected in co-regulated networks and determine whether disease duration influences their pattern.
Methods. Plasma levels of 20 cytokines and soluble CD40 (sCD40) from 44 uncomplicated patients and 22 healthy controls (HCs) were measured using enzyme-linked immunosorbent assay (ELISA) and protein array technology.
Results. Patients showed significantly higher levels of sCD40, IL-1a, IL-2, IL-4, IL-5, IL-10, granulocyte-macrophage colony-stimulating factor (GM-CSF), macrophage inflammatory protein (MIP)-1a, MIP-1b, regulated on activation normal T cell expressed and secreted (RANTES), matrix metalloproteinase (MMP)-9, and a trend to higher IL-6 than did HCs. RANTES and sCD40 discriminated significantly between diabetics and HCs. In patients with disease duration >6 months, cytokines were organized in two clusters mainly regulated by Th17 and Th1/Th2 cells respectively, while in those with disease duration ≤6 months a set of Th1-cytokines was separated apart from the second cluster. Monocyte chemotactic protein (MCP)-1 was revealed as the most discriminant factor between patients with disease duration of more than and less than 6 months.
Conclusions. A parallel elevation of both inflammatory and anti-inflammatory cytokines was observed in patients compared with HCs. In T1DM patients with disease duration ≤6 months, Th1-cytokines were organized on a separate cluster, suggesting a possible role of Th1 cells in the progress of beta-cell destruction during the first period of the disease.
| Abbreviations | ||
| CPCC | = | cophenetic correlation coefficient |
| CRG | = | cytokine responsive gene |
| CRP | = | C-reactive protein |
| DCs | = | dendritic cells |
| DFA | = | discriminant function analysis |
| ELISA | = | enzyme-linked immunosorbent assay |
| GM-CSF | = | granulocyte-macrophage colony-stimulating factor |
| GRO | = | growth-regulated oncogene |
| HbA1c | = | hemoglobin A1c or glycated hemoglobin |
| HCA | = | hierarchical clustering algorithms |
| HCs | = | healthy controls |
| HDL | = | high-density lipoprotein |
| IFN | = | interferon |
| IL | = | interleukin |
| LDL | = | low density lipoprotein |
| MCP-1 | = | monocyte chemotactic protein-1 |
| MIP | = | macrophage inflammatory protein |
| MMP-9 | = | matrix metalloproteinase-9 |
| RANTES | = | regulated on activation normal T-cell expressed and secreted |
| SSDifN | = | normalized sum of squared differences |
| T1DM | = | type 1 diabetes mellitus |
| TNF | = | tumor necrosis factor |
| UPGMA | = | unweighted pair-group method arithmetic average |
| VEGF | = | vascular endothelial growth factor |
Key messages
Type 1 diabetes mellitus is characterized by a parallel elevation of both inflammatory and anti-inflammatory cytokines.
Th1-cytokines are probably implicated in the progress of beta-cell destruction during the first period of the disease.
Monocyte chemotactic protein (MCP)-1 is the most discriminant factor between diabetic patients with disease duration of more than and less than 6 months.
Introduction
Type 1 diabetes mellitus is an autoimmune disease characterized by T-cell-mediated destruction of the pancreatic beta-cells, which results in insulin deficiency, ascertained by high glucose levels in blood (Citation1,Citation2). However, at the time of diagnosis, 5%–20% of beta-cells are still present and, thus, patients usually experience a period of remission, which takes place at about 2–4 months after diagnosis and is featured by comparatively lower glycated hemoglobin (HbA1c) levels (Citation3).
Generally, poor glycemic control of type 1 diabetic patients affects negatively the development and progression of diabetic complications, and thus intensive insulin therapy is of great importance (Citation4,Citation5). It has also been found that the disease is characterized by hyperglycemia-related low-grade chronic inflammation, confirmed by high levels of inflammatory markers, such as monocyte interleukin (IL)-6 and C-reactive protein (Citation6,Citation7). Therefore, this low-grade diabetic inflammation, which is probably cytokine-mediated, may be the pathway by which hyperglycemia leads to the complications, since markers of inflammation are strongly associated with microvascular complications, cardiovascular disease (Citation8,Citation9), and diabetic nephropathy (Citation10).
Inflammatory mediators, such as cytokines and chemokines, are implicated in the pathogenesis of many autoimmune diseases, including multiple sclerosis, rheumatoid arthritis, and type 1 diabetes mellitus (T1DM) (Citation11,Citation12). In autoimmune diabetes, although both T helper type 1 (e.g. interferon (IFN)-γ, IL-2) and type 2 (e.g. IL-4, IL-10)-associated cytokines have been observed in insulitis lesions, the former seem to promote and the latter to regulate beta-cell destruction (Citation13,Citation14). Besides, elevated levels of inflammatory cytokines have been observed in type 1 diabetic patients and associated with the development of vascular complications (Citation7,Citation9,Citation15,Citation16), though hyperglycemia up-regulates their expression even in a non-diabetic background (Citation17,Citation18). Hence, an imbalance between inflammatory and anti-inflammatory cytokines may play a significant role both in autoimmunity and chronic inflammation that probably leads to complications in T1DM (Citation19).
CD40, a transmembrane receptor of the tumor necrosis factor (TNF) gene superfamily, is expressed on a variety of cells, such as monocytes, B-cells, antigen-presenting cells, endothelial, smooth muscle cells and fibroblasts, and implicated in chronic inflammatory and autoimmune diseases (Citation20–23). The interaction between CD40 and CD40 ligand (CD40L) enhances the expression of cytokines, chemokines, matrix metalloproteinases, growth factors, and adhesion molecules, mainly through stimulation of nuclear factor kappa B (NF-κB) (Citation24). CD40 has been observed to be expressed on T-cells and pancreatic cells and implicated in the activation of pro-inflammatory pathways that may have a significant role in beta-cell destruction and islet graft rejection (Citation25–27). We have previously shown that CD40 possibly contributes in the low-grade inflammatory process in type 1 diabetic patients (Citation28), whereas little research has focused on the determination of CD40 circulating levels (Citation29) and their correlation with the systemic levels of other cytokines in type 1 diabetes. Moreover, CD40L has been shown to be elevated both in type 1 and type 2 diabetic patients and associated with the development of diabetic complications (Citation7,Citation29,Citation30).
Broad-based proteomic screening methods allow the simultaneous study of a large number of cytokines and chemokines, offering the opportunity 1) to enhance our understanding of the complex regulatory networks of these analytes, 2) to fill the gaps concerning their role in the pathogenesis of autoimmune diabetes, and 3) to add novel markers to follow up disease progress. Therefore, taking into consideration that only few studies provide extensive knowledge on the pro- and anti-inflammatory mediators’ profile in type 1 diabetic patients (Citation31), the aim of this study was to explore a broad panel of inflammatory and anti-inflammatory cytokines, in order to evaluate whether they could effectively mirror the inflammatory status of T1DM patients or mark some of its features. We also aimed to investigate possible differences in cytokine levels or in the way they are connected into distinct networks between patients with disease duration of less than or more than 6 months, so as to pin-point the potential factors that mediate the destruction of the remaining beta-cells, which still exist at the time of diagnosis.
Materials and methods
Patients
The present study was approved by the Ethics Committee of Athens University Medical School, and informed consent was given from the parents of both diabetic and healthy subjects, in accordance with the principles expressed in the Helsinki Declaration. A total of 44 type 1 diabetic patients and 22 healthy controls (HCs) participated in this study. The patients were chosen, so as to create two arithmetically equal and age-matched groups, which differed in their subjects’ duration of diabetes. In the first group, patients had diabetes duration ≤6 months after diagnosis, while in the second group patients had disease duration of more than 6 months. As we have mentioned in the introduction, according to Chase et al., the maximum remission period in all age groups of type 1 diabetic patients is reached at about 2–4 months after diagnosis (Citation3). In order to include this period in our first group (group of remission period), we decided that this group would embody patients with diabetes duration of less than 6 months but more than 5 days after diagnosis and treatment initiation, due to the bad glycemic control of these patients at the time of diagnosis. The control group was selected to match type 1 diabetic patients for age, sex, and body mass index (±1 kg/m2), considering that they had not received any medication in the previous 3 months. In the group of patients, 26 were treated conventionally (two doses daily of rapid or short and intermediate-acting insulin, mean dose 0.7 IU/kg/day), and 18 were under intensive treatment (long-acting insulin injection at bedtime and three pre-meal injections of rapid-acting insulin, mean dose 0.8 IU/kg/day). Patients had no other disease apart from type 1 diabetes and were not taking any medications other than insulin. On the day of testing, all patients were free of any clinical or biological signs of infection. Moreover, they had no clinically defined complications such as retinopathy (excluded by fundoscopy) or nephropathy (excluded by urine albumin excretion <30 mg/day). Blood from HCs was collected from children who reported to the clinic for routine check-up.
Common laboratory procedures
Blood samples were collected under fasting conditions and immediately centrifuged at 4°C (Citation32). Serum and plasma samples were stored at −80°C until analysis. Biochemical blood measurements were determined by standard laboratory procedures. C-reactive protein (CRP) levels were measured by nephelometry (Dade Behring, Marburg, Germany), and the intra- and inter-assay coefficients of variation (CV) were 2.4% and 4.4%, respectively. HbA1c was measured by a high-performance liquid chromatography analysis (HPLC) (Citation33). The normal range was 4.2%–6.0%, with an inter-assay CV of 3%.
Detection of plasma CD40, MCP-1, and IFN- γ by ELISA
Commercially available enzyme-linked immunosorbent assay (ELISA) kits were used to determine plasma levels of CD40 (Bender Medsystems, Vienna, Austria), monocyte chemotactic protein (MCP)-1, and IFN-γ (RayBiotech, Georgia, USA) according to the manufacturer's instructions. The inter- and intra-assay coefficients of variation (CV) for CD40 were ≤7% and ≤4%, respectively, and for both MCP-1 and IFN-γ ≤12% and ≤10%, respectively.
Protein micro-array
Plasma levels of 18 inflammatory and anti-inflammatory cytokines and chemokines (IL-1α, -1b, -2, -4, -5, -6, -8, -10, -12, -13, granulocyte-macrophage colony-stimulating factor (GM-CSF), growth-regulated oncogene (GRO), macrophage inflammatory protein (MIP)-1a, MIP-1b, RANTES (regulated on activation normal T-cell expressed and secreted), TNF-α, matrix metalloproteinase (MMP)-9, and vascular endothelial growth factor (VEGF)) were measured using a commercially available protein array slide kit according to the manufacturer's instructions (RayBiotech, Georgia, USA). Slides were scanned with the confocal scanner ArrayScanner Express (Packard Biosciences, Meriden, CT, USA) equipped with a laser that measures Cy3 wavelength (excitation wavelength of 554 nm and the emission of 565 nm). Images were generated using a resolution of 10 μm and pmt value of 60 to 80 depending on the chip. The obtained image of each array was analyzed for the identification of the arrayed spots and the measure of the fluorescence intensities for each element. For this purpose the instrument utilizes its own software that handles image processing (ScanArray, Packard Biosciences). Quantification of data was performed with the respective software QuantArray (Packard Biosciences) using the histogram method (signal 80%–95% of the light intensity, background 5%–20% of the light intensity). Intensity values for each element were then loaded to Human CYT-1 Q-Analyzer v3.5 software (RayBiotech, Georgia, USA), based on Excel, for their transformation to concentration (pg/mL).
Statistical analysis
In this study we determined the levels of CD40 and 20 inflammatory and anti-inflammatory cytokines and chemokines in type 1 diabetic patients. Data analysis was performed with the Statistical Package for Social Sciences (SPSS) for Windows (version 16.0). Parametric variables were expressed as means ± standard error of mean. A Student's t test was used to compare the mean values of the examined parameters between patient and control groups (, ). For subgroup analysis, firstly, one-way ANOVA test was used to determine whether significant differences in the tested parameters between groups existed or not and if a significant overall F-test was obtained, Tukey's honestly significant difference (HSD) test was used for post hoc comparison to analyze differences among groups (). The Pearson rank correlation test was performed to examine the associations between parameters tested. Confidence interval and significance levels were chosen as 95% and <0.05, respectively.
Table I. Characteristics of the healthy subjects and type 1 diabetic patients.
Table II. Plasma levels of inflammatory and anti-inflammatory cytokines and chemokines.
Cluster analysis
Hierarchical clustering was performed to identify the homogeneous subgroups of cytokines in the examined diabetic and healthy subjects.
Hierarchical cluster analyses are generally sensitive to the input order of the data (Citation34), thus we used the Statistical Package for Social Sciences (SPSS, version 11.03) add-on PermuCLUSTER (Citation35) in order to compare the cluster solutions obtained from 100 random permutations of the input order. The cluster solutions were identical for all permutations performed, indicating that no cluster ties were present and that the input order of the data did not affect the clustering procedure (Citation34). As grouping algorithms were tested the UPGMA (unweighted pair-group method arithmetic average), single linkage, and complete linkage. The distance measure used to quantify the distance between the values of two cytokines was Pearson's correlation coefficient, and the between-groups linkage was used as the linking method to determine the clusters that were best suited to the found cytokines values. The cophenetic correlation coefficient (CPCC) (Citation36) for each of the grouping algorithms was computed to compare the similarity matrix. The clustering method with the lower normalized sum of squared differences (SSDifN) and the higher CPCC was chosen. The cytokines were sorted according to the series obtained by the chosen hierarchical cluster analysis, and then the re-sorted distance matrix was plotted using the filled contour plot graph type (SigmaPlot 11.0), with colors corresponding to the coefficients’ values of cytokines pair in the form of a heat map.
Moreover, we used stepwise discriminant function analysis (DFA) with stepwise selection to reveal which of the variables best discriminated among the examined between T1DM patients and healthy controls and T1DM patients with disease duration of less than or more than 6 months from the diagnosis. We used Wilks’ lambda to calculate the usefulness of a given variable and F-ratio that defines quantum of variation between the examined groups and the significant level of the variance (F = 3.84 to enter, and F = 2.71 to remove).
Results
Subjects’ characteristics
Demographic, biochemical, and metabolic characteristics of both patients and healthy controls are presented in . Diabetic patients presented significantly elevated triglycerides, HbA1c, and CRP levels than did healthy controls.
Mean values of CD40 and cytokines are shown in , while percentage alterations of CD40 and significantly elevated cytokines in diabetics are presented in . Plasma CD40 was significantly higher in diabetic patients than in healthy controls (109.98 ± 17.39 pg/mL versus 54.92 ± 3.09 pg/mL, respectively, P = 0.003) () and correlated positively with HbA1c (rs = 0.435, P = 0.01). In addition, patients showed significantly elevated levels of IL-1a (P = 0.041), IL-2 (P = 0.009), IL-4 (P = 0.034), IL-5 (P = 0.01), IL-10 (P = 0.045), GM-CSF (P = 0.017), MIP-1a (P = 0.042), MIP-1b (P = 0.001), RANTES (P = 0.001), and MMP-9 (P = 0.005) than did healthy controls, and a trend to higher IL-6 (P = 0.057), whereas IL-1b, IL-8, IL-12, IL-13, GRO, TNF-α, IFN-γ, MCP-1, and VEGF showed no difference between the two groups.
Figure 1. Percentage alteration of cytokine levels in type 1 diabetic patients compared to healthy controls. The figure includes only cytokines that significantly differ between diabetic patients and healthy controls, where P ≤ 0.05 was considered significant.
Figure 2. Plasma soluble CD40 (sCD40) and RANTES in healthy controls (HCs) and type 1 diabetes mellitus (T1DM) patients. Soluble CD40 and RANTES were identified as the significant contributors to the discrimination between diabetic and healthy subjects. Data are presented as bars, where bar length represents mean value for each group, with error bars depicting standard error of mean. P ≤ 0.05 was considered significant. *P = 0.003 versus HCs. **P = 0.001 versus HCs.
By running a stepwise DFA to 21 variables of 66 subjects (44 patients and 22 controls) RANTES and sCD40 were identified as the significant contributors to the discrimination between diabetic and healthy subjects. The model presented a good fit for the data, with RANTES as the predictor (F = 8.702, P = 0.006) or with both RANTES and sCD40 as the only significant predictors (F = 11.395, P < 0.001), and constitutes the best predictive model (Wilks’ lambda = 0.54, chi-square = 16.523, df = 2, P < 0.001). This discriminant function correctly classified 75.5% of the subjects (73% of diabetics, 81.2% of healthy subjects).
Comparison of cytokine levels among diabetic patients with variation in disease duration
Patients (n = 44) were divided into two groups based on disease duration, taking diabetes duration of 6 months (after diagnosis) as cut-off, as follows: group 1(n = 22, diabetes duration ≤6 months), and group 2 (n = 22, diabetes duration > 6 months). Group 1 patients showed significantly higher MCP-1 (90.31 ± 8.76 pg/mL versus 49.16 ± 5.14 pg/mL, P < 0.001) and a trend (P = 0.071) to higher TNF-α levels than those of group 2 (). No significant alterations were observed in the rest of the cytokines and chemokines between the two patients’ groups. By running a stepwise DFA to the 22 variables of both patients groups differing in disease duration, MCP-1 (F = 5.054, P = 0.038) was identified as the significant contributor to the discrimination between groups and constitutes the best predictive model (Wilks’ lambda = 0.798, chi-square = 4.394, df = 1, P = 0.036). This discriminant function correctly classified 82.1% of the diabetic subjects (77.3% of diabetic patients of group 1 and 88.2% of diabetic patients of group 2).
Figure 3. Plasma MCP-1 levels between diabetic patients with disease duration of more than and less than 6 months. MCP-1 was found as the most discriminant factor between patients with disease duration of more than and less than 6 months. Data are presented as bars, where bar length represents mean value for each group, with error bars depicting standard error of mean. P ≤ 0.05 was considered significant. *P < 0.001 versus patients with disease duration of more than 6 months.
Moreover, when we subdivided group 1 (patients with disease duration 0–6 months) to subgroup 1a (n = 7) with disease duration <1 month and subgroup 1b (n = 15) with disease duration 1–6 months, we found that the levels of sCD40, MCP-1, TNF-α, and RANTES showed a biphasic pattern of alteration with a peak during the period of the first 6 months. The levels of sCD40, MCP-1, and TNF-α tended to be higher while the levels of RANTES lower in patients of subgroup 1b when compared with those of subgroup 1a as well as of group 2 (patients with disease duration of more than 6 months) ().
Table III. Effects of time passed from the diagnosis of type 1 diabetes on the levels of soluble CD40, MCP-1, TNF-α, and RANTES.
Hierarchical cluster analysis of cytokines profile
To resolve the 21 differentially expressed cytokines into sets based on the alterations among individuals within a population in a correlated manner, we used unsupervised hierarchical clustering algorithm, using Pearson's correlation coefficient as the distance matrix. Three clustering algorithms, namely UPGMA, single linkage, and complete linkage, were used to generate the dendrograms. The cophenetic correlation and SSDifN were calculated to test the goodness of fit of the different clustering algorithms (Supplementary Table). UPGMA was chosen as the clustering method since this method presented the lower normalized sum of squared differences (SSDifN) and the higher CPCC for all the examined groups and subgroups (Supplementary Table), indicating the best fit between the dendrogram and the original distance matrix. The resulting distance matrix of each of the examined groups, where cytokines were presented in the order found by the specific hierarchical clustering algorithms (HCA) of each group, was plotted in contour plots in the form of heat maps utilizing color mapping of correlation coefficients in order to offer visual representation of the correlated values. Cytokines with positive correlations are represented in graded shades of red and negative correlations in graded shades of blue, while absence of correlation or non-significant correlations are represented in graded shades of green ( and ).
Figure 4. Hierarchical clustering comparing T1DM patients and healthy controls. A heat map representation of the correlational coefficients is graphed. Cytokines with positive correlations are represented in graded shades of red and negative correlations in graded shades of blue. Representation of the level of correlations is listed on the side of the graph. The dendrograms on the left are presented as the result of hierarchical cluster analysis with the use of Pearson's correlation coefficients, using the UPGMA method (unweighted pair-group method arithmetic average). The actual distances between clusters are rescaled to numbers between 0 and 25.
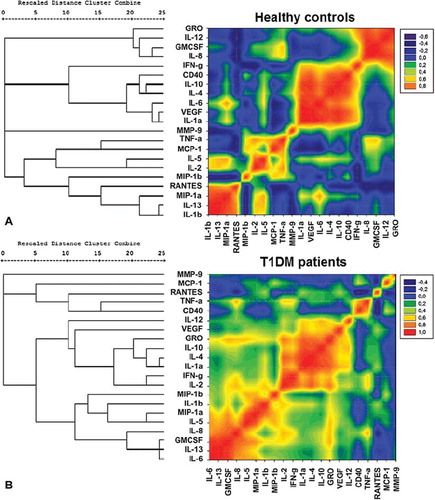
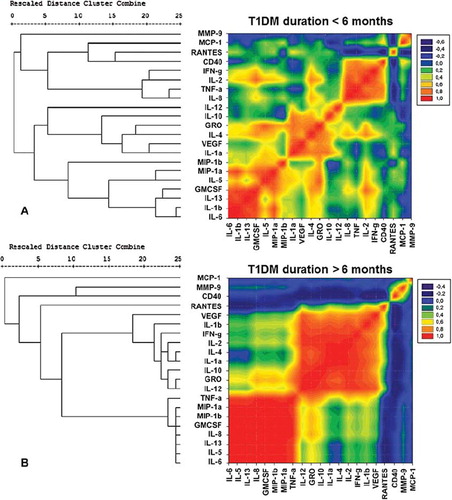
Figure 5. Hierarchical clustering comparing T1DM patients with disease duration of more than and less than 6 months. A heat map representation of the correlational coefficients is graphed. Cytokines with positive correlations are represented in graded shades of red and negative correlations in graded shades of blue. Representation of the level of correlations is listed on the side of the graph. The dendrograms on the left are presented as the result of hierarchical cluster analysis with the use of Pearson's correlation coefficients, using the UPGMA method (unweighted pair-group method arithmetic average). The actual distances between clusters are rescaled to numbers between 0 and 25.
Besides the significant differences that were found for most of the examined cytokines between diabetic patients and healthy subjects, the use of hierarchical clustering and color mapping could reveal which of them were additionally connected to clusters, suggesting the possible co-regulated sets of cytokines. The heat maps of diabetic patients and healthy subjects showed different patterns. In diabetic patients, cytokines and chemokines were reorganized into three sufficiently distinct clusters that are co-expressed and could therefore have a possible regulatory link among them. The first cluster consisted of cytokines IL-6, IL-13, IL-5, IL-8, and IL-1b, as well as MIP-1a, MIP-1b, and GM-CSF; the second consisted of IL-1a, IL-2, IL-4, IL-10, IL-12, IFN-γ, GRO, and VEGF; and the third small cluster consisted of sCD40, TNF-α, MCP-1, and RANTES.
Moreover, differences in cytokines’ heat maps were revealed between diabetic patients differing in disease duration. Diabetic patients of group 1 revealed three distinct clusters of cytokines with high positive correlation: first cluster containing MCP-1, RANTES, CD40, IFN-γ, IL-2, TNF-α, and IL-8; the second containing IL-12, IL-10, GRO, IL-4, VEGF, and IL-1a; and the third with MIP-1a, MIP-1b, IL-5, GM-CSF, IL-13, IL-1b, and IL-6. Diabetic patients of group 2 revealed two distinct clusters of cytokines with high positive correlation, the first containing TNF-α, MIP-1a, MIP-1b, GM-CSF, IL-8, IL-13, IL-5, and IL-6, and the other containing IL-12, IL-10, IL-1a, IL-4, IL-2, IFN-γ, IL-1b, VEGF, and GRO.
Discussion
Recent advances in T1DM suggested that the process of inflammation might play an essential role during all the stages of type 1 diabetes, from its induction to the later stages of disease. Inflammatory processes might contribute to beta-cells’ destruction, while inflammatory mediators contribute to insulitis amplification, prolonged suppression and death of beta-cells, modulation of beta-cell regeneration, and insulin resistance (Citation37) and are also implicated in the development of the various forms of diabetic complications (Citation7,Citation37). The mechanism of action as well as the pattern through which various cytokines are linked to sets to control inflammation at every phase of diabetes is only partially understood. Most of the available studies report changes in the circulating concentrations of a small number of cytokines in type 1 diabetic patients (Citation15,Citation18,Citation38,Citation39) or provide cell-based approaches of cytokines’ production (Citation40–43). In this study we examined the differences in the pattern of a broad spectrum of the circulating levels of 20 inflammatory and anti-inflammatory interleukins and chemokines and of sCD40, between healthy individuals and diabetic juveniles, pin-pointing also the clusters of special cytokines that characterize T1DM patients in the early phase of the disease compared with those of patients with long-lasting disease.
Th1-type lymphocytes through their cytokines such as IL-2, IFN-γ, IL-12, and TNF-α orchestrate the destruction of beta-cells in T1DM, while Th2-type lymphocytes with the help of their cytokines such as IL-4, IL-5, IL-6, IL-10, and IL-13 counteract Th1-cell function, offering protection to pancreatic beta-cells (Citation43–45). Recently, the extent of beta-cell destruction has been assumed to be dependent on the shift of the balance between autoreactive Th1 and anti-inflammatory T-regulatory (Treg) cells towards Th1-autoreactive cells (Citation46). Moreover, according to Fisman et al., IL-1, IL-2, and IL-6 play a noxious, IL-4 and IL-10 a protective, and IL-5 a neutral role in the development of diabetic cardiovascular complications (Citation47). Among the examined cytokines of this study, IL-1a, IL-2, IL-4, IL-5, and IL-10 were significantly elevated and IL-6 showed a trend to higher levels in the diabetic patients, compared with healthy controls, indicating the parallel elevation of both inflammatory and anti-inflammatory cytokines.
As happens with interleukins, previous studies indicate a Th1 versus Th2 cells polarization both in the expression of chemokines and also in the responsiveness to different chemokines probably due to the differential expression of their receptors (Citation48). According to Bradley et al., lymphotactin, MCP-1, MIP-1a, RANTES, and cytokine responsive gene (CRG)-2/IP-10 were produced by Th1, while MIP-1b was produced by both Th1 and Th2 CD4+ subsets (Citation48). In this study we found elevated levels of chemokines MMP-9, MIP-1a, MIP-1b, RANTES, and GM-CSF in T1DM patients compared with healthy subjects. Increased levels of MMP-9 in type 1 diabetes have been previously observed even in patients without obvious signs of complications and were associated with an increased risk of these patients to develop micro-and macro-angiopathy, since this proteolytic enzyme is involved in the remodeling of the extracellular matrix, cell migration, and alteration of the biological activities of many mediators such as cytokines and chemokines (Citation49–51). Additionally, GM-CSF was considered as a cytokine that expands a population of tolerogenic dendritic cells (DCs) and CD4+CD25+ Tregs in vivo which produce high amounts of IL-10 (Citation52), providing significant protection against autoimmune diseases like autoimmune thyroiditis or diabetes (Citation53,Citation54). Furthermore, MIP-1a and MIP-1b, mainly produced by macrophages and lymphocytes, have the capacity to attract a plethora of white cells, fostering thus a variety of pro-inflammatory procedures (Citation55). The results of this study are consistent with previous findings in diabetic patients and diabetic animal models, associating the elevated levels of MIP-1a, MIP-1b (Citation56,Citation57), and RANTES (Citation57) with immune-mediated diabetes. Besides, RANTES, a known chemotactic factor, together with soluble CD40, a mediator member of TNF receptor family with a critical role in immunoregulation and the pathophysiology of inflammation (Citation28), were defined in this study as the key molecules that discriminate diabetic from healthy subjects. Moreover, soluble CD40, which is generated either through alternative splicing or through proteolytic cleavage of membrane CD40 (Citation58), can inhibit CD40/CD40L signaling either acting as a CD40 antagonist (Citation59–62) or by binding to the membrane receptor, thus forming a non-functional dimer, which is afterwards degraded intracellularly (Citation63). Thus, increased levels of sCD40 could be used as a way to estimate the homeostatic response of the body to autoimmune and inflammatory signals.
T1DM is characterized by a first period known as honeymoon phase in which, through a poorly understood underlying mechanism, a partial or complete remission of the disease is usually observed with maximum remission rates usually achieved in the first 1–4 months after diagnosis (Citation64,Citation65). According to the opinion of von Herrath et al., T1DM could be thought as a relapsing–remitting disease due to spreading of antigenic determinants, or beta-cell proliferation, or the actions of regulatory T-cells which cause the increase in the immunological severity of the disease over time with the emergence of more targeting of beta-cells (Citation66). In our study, MCP-1 levels were obviously higher in the group of patients with diabetes duration of less than 6 months, and MCP-1 was revealed as the most discriminant factor between groups differing in disease duration, suggesting a potential role of this cytokine in the destruction of the remaining beta-cells in the newly diagnosed T1DM patients. In other studies, an increase in the circulating MIP-1a and MIP-1b levels and a decrease in RANTES levels in the newly diagnosed patients have been reported (Citation56), while MIP-1b has been found to be associated with the decrease in beta-cell stress in remitters (Citation57). In an additional analysis of our results, patients with disease duration of less than 1 month were excluded from the group of the newly diagnosed patients (disease duration ≤6 months), in order to make our patient group comparable with that of Pfleger et al. We found then that the levels of RANTES were lower in patients with disease duration of 1–6 months, when compared with those of disease duration of less than 1 month or more than 6 months (P < 0.001, respectively; P = 0.05, respectively). On the other hand, sCD40 was higher in patients with disease duration 1–6 months compared both with that of patients with disease duration <1 month (P = 0.05) or >6 months (P = 0.026). The higher sCD40 levels could be thought of as a successful compensatory effect to autoimmune and inflammatory signals, suggesting that T1DM patients in the first 6 months of the disease (after treatment initiation) enter a period characterized by lower inflammation confirmed by the lower RANTES. Further studies of a larger sample size are needed to confirm the existence of such a biphasic behavior of these cytokines.
The observed parallel elevation of anti-inflammatory cytokines and chemokines, which accompanies the increase in inflammatory and cytotoxic ones, consist probably of an homeostatic but unsuccessful effort of the organism to fight the inflammatory state that characterizes type 1 diabetes. Thus, mapping both cytotoxic and cytoprotective chemokines and cytokines into sets of co-associated ones could better specify the way these cytokines were co-regulated into sets in T1DM patients compared with healthy subjects. The multivariate hierarchical clustering analysis validated by permutation showed that in T1DM patients with disease duration of more than 6 months, the cytokines and chemokines were organized into two distinct co-regulated sets of analytes. The first set consisted of the well correlated among the cytokines, IL-12, IL-10, IL-1a, IL-4, IL-2, IFN-γ, IL-1b, VEGF, and GRO, and the second set consisted of IL-6, IL-5, IL-8, GM-CSF, MIP-1b, MIP-1a, and TNF-α. However, in the newly diagnosed T1DM patients with duration of up to 6 months, cytokines and chemokines were organized into two clusters of cytokines with the exception of sCD40, and the Th1-related TNF-α, IFN-γ, IL-2, IL-8, MCP-1, and RANTES, which were separated and co-regulated in a distinct cluster of cytokines apart from the others, suggesting an essential role of these molecules in the destruction of the remaining beta-cells during the first period of the disease. Specifically for MCP-1, the most discriminant factor between patients differing in disease duration in our study, data from NOD mice suggest that at diabetes onset, it is associated more closely with the early non-destructive than with destructive insulitis (Citation56,Citation67). However, evidence which strengthens the hypothesis of MCP-1-mediated beta-cell destruction is that levels of MCP-1 showed strong positive correlation with those of IL-2, which has a key role in the destruction of beta-cells (Citation68), and MIP-1b, which is a chemoattractant of multiple pro-inflammatory cells (Citation55). More targeted studies are needed to evaluate the role of MCP-1 in the destruction of beta-cells and the ability of its inhibition in newly diagnosed patients, in order to prevent the destruction of the remaining beta-cells.
In addition to the implication of Th1 and Th2 effector cells in autoimmunity, T helper cells differentiate also to Th17 cells which secrete inflammatory cytokines (TNF-α, IL-6), chemokines (IL-8, MCP-1, GM-CSF), and metalloproteinases and are prominently involved in both inflammation and autoimmunity. On the other hand, Treg cells regulate the activity of the effector T-cells and play a central role in immune regulation and tolerance (Citation69,Citation70). Taking into account which cytokines and chemokines we found to be elevated in T1DM patients and the way they were organized in distinct clusters, we could suggest that cytokines and chemokines were co- regulated into mainly two sets: 1) a cluster consisting of a set of cytokines mainly under the supervision of Th17 that had escaped from the immunosuppressive effect of Treg cells, as evidenced by the elevation in MIP-1a, MIP-1b, IL-5, and GM-CSF, and 2) a cluster consisting of Th1/Th2 cytokines which escaped Treg cells’ suppressive effect, as evidenced by the elevation of IL-1a, IL-2, IL-4, and IL-10. In the newly diagnosed patients sCD40 and Th1-related cytokines and chemokines (TNF-α, IFN-γ, IL-2, IL-8, MCP-1, and RANTES) were connected into a third distinct cluster.
Taken together, the results of this study suggest that Th1-related cytokines together with Th1 chemokine, MCP-1, play the pivotal role in the first period of the disease and are associated to the continued beta-cell destruction in the first months after diabetes diagnosis. The inability of Treg cells’ cytokines to compensate for Th17, Th1, and Th2-related cytokines and chemokines, and of sCD40 to compensate for CD40/CD40L signaling in combination with RANTES inflammatory function, drives T1DM patients to the chronic subclinical inflammation that characterizes the disease. In conclusion, the measurement of both inflammatory and anti-inflammatory molecules using protein array technology gives us the opportunity to estimate the dynamic balance between pro- and anti-inflammatory components in the T1DM patients as well as to distinguish the representative ones that could be targeted for therapeutic interventions in both the newly diagnosed and those with longer disease duration. Long-term studies of a larger sample size are needed to define the therapeutic value of the possible anti-inflammatory therapy which must be specific for each stage of T1DM, aimed to inhibit or delay disease establishment at the early stage or to inhibit or delay disease complications at the later stage.
Table showing collated results
Download PDF (165.3 KB)Acknowledgements
The skillful technical assistance of Mrs A. Andreou is gratefully acknowledged.
Declaration of interest: This study was supported by funds from the University of Athens and by Special Accounts for Research Grants.
References
- Daneman D. Type 1 diabetes. Lancet. 2006;367:847–58.
- Roep BO. The role of T-cells in the pathogenesis of Type 1 diabetes: from cause to cure. Diabetologia. 2003;46:305–21.
- Chase HP, MacKenzie TA, Burdick J, Fiallo-Scharer R, Walravens P, Klingensmith G, . Redefining the clinical remission period in children with type 1 diabetes. Pediatr Diabetes. 2004;5:16–19.
- The effect of intensive treatment of diabetes on the development and progression of long-term complications in insulin-dependent diabetes mellitus. The Diabetes Control and Complications Trial Research Group. N Engl J Med. 1993;329:977–86.
- Nathan DM, Cleary PA, Backlund JY, Genuth SM, Lachin JM, Orchard TJ, . Intensive diabetes treatment and cardiovascular disease in patients with type 1 diabetes. N Engl J Med. 2005;353:2643–53.
- Schalkwijk CG, Poland DC, van Dijk W, Kok A, Emeis JJ, Drager AM, . Plasma concentration of C-reactive protein is increased in type I diabetic patients without clinical macroangiopathy and correlates with markers of endothelial dysfunction: evidence for chronic inflammation. Diabetologia. 1999;42:351–7.
- Devaraj S, Glaser N, Griffen S, Wang-Polagruto J, Miguelino E, Jialal I. Increased monocytic activity and biomarkers of inflammation in patients with type 1 diabetes. Diabetes. 2006;55:774–9.
- Schram MT, Chaturvedi N, Schalkwijk CG, Fuller JH, Stehouwer CD. Markers of inflammation are cross-sectionally associated with microvascular complications and cardiovascular disease in type 1 diabetes—the EURODIAB Prospective Complications Study. Diabetologia. 2005;48: 370–8.
- Devaraj S, Cheung AT, Jialal I, Griffen SC, Nguyen D, Glaser N, . Evidence of increased inflammation and microcirculatory abnormalities in patients with type 1 diabetes and their role in microvascular complications. Diabetes. 2007;56:2790–6.
- Lin J, Glynn RJ, Rifai N, Manson JE, Ridker PM, Nathan DM, . Inflammation and progressive nephropathy in type 1 diabetes in the diabetes control and complications trial. Diabetes Care. 2008;31:2338–43.
- Kim EY, Moudgil KD. Regulation of autoimmune inflammation by pro-inflammatory cytokines. Immunol Lett. 2008;120:1–5.
- Rotondi M, Chiovato L, Romagnani S, Serio M, Romagnani P. Role of chemokines in endocrine autoimmune diseases. Endocr Rev. 2007;28:492–520.
- Almawi WY, Tamim H, Azar ST. Clinical review 103: T helper type 1 and 2 cytokines mediate the onset and progression of type I (insulin-dependent) diabetes. J Clin Endocrinol Metab. 1999;84:1497–502.
- Rabinovitch A, Suarez-Pinzon WL. Role of cytokines in the pathogenesis of autoimmune diabetes mellitus. Rev Endocr Metab Disord. 2003;4:291–9.
- Targher G, Zenari L, Bertolini L, Muggeo M, Zoppini G. Elevated levels of interleukin-6 in young adults with type 1 diabetes without clinical evidence of microvascular and macrovascular complications. Diabetes Care. 2001;24:956–7.
- Mohamed-Ali V, Armstrong L, Clarke D, Bolton CH, Pinkney JH. Evidence for the regulation of levels of plasma adhesion molecules by proinflammatory cytokines and their soluble receptors in type 1 diabetes. J Intern Med. 2001;250:415–21.
- Esposito K, Nappo F, Marfella R, Giugliano G, Giugliano F, Ciotola M, . Inflammatory cytokine concentrations are acutely increased by hyperglycemia in humans: role of oxidative stress. Circulation. 2002;106:2067–72.
- Gordin D, Forsblom C, Ronnback M, Parkkonen M, Waden J, Hietala K, . Acute hyperglycaemia induces an inflammatory response in young patients with type 1 diabetes. Ann Med. 2008;40:627–33.
- Haller MJ, Schatz DA. Cytokines and type 1 diabetes complications: casual or causal association? Pediatr Diabetes. 2008;9:1–2.
- van Kooten C, Banchereau J. CD40-CD40 ligand. J Leukoc Biol. 2000;67:2–17.
- Schonbeck U, Libby P. The CD40/CD154 receptor/ligand dyad. Cell Mol Life Sci. 2001;58:4–43.
- Rizvi M, Pathak D, Freedman JE, Chakrabarti S. CD40-CD40 ligand interactions in oxidative stress, inflammation and vascular disease. Trends Mol Med. 2008;14:530–8.
- Toubi E, Shoenfeld Y. The role of CD40-CD154 interactions in autoimmunity and the benefit of disrupting this pathway. Autoimmunity. 2004;37:457–64.
- Lutgens E, Lievens D, Beckers L, Donners M, Daemen M. CD40 and its ligand in atherosclerosis. Trends Cardiovasc Med. 2007;17:118–23.
- Vosters O, Beuneu C, Nagy N, Movahedi B, Aksoy E, Salmon I, . CD40 expression on human pancreatic duct cells: role in nuclear factor-kappa B activation and production of pro-inflammatory cytokines. Diabetologia. 2004;47:660–8.
- Barbe-Tuana FM, Klein D, Ichii H, Berman DM, Coffey L, Kenyon NS, . CD40-CD40 ligand interaction activates proinflammatory pathways in pancreatic islets. Diabetes. 2006;55:2437–45.
- Wagner DH Jr, Vaitaitis G, Sanderson R, Poulin M, Dobbs C, Haskins K. Expression of CD40 identifies a unique pathogenic T cell population in type 1 diabetes. Proc Natl Acad Sci U S A. 2002;99:3782–7.
- Chatzigeorgiou A, Lembessis P, Mylona-Karagianni C, Tsouvalas E, Diamanti-Kandarakis E, Kamper EF. CD40 expression and its association with low-grade inflammation in a Greek population of type 1 diabetic juveniles: evidence for differences in CD40 mRNA isoforms expressed by peripheral blood mononuclear cells Exp Clin Endocrinol Diabetes. 2010;118:38–46.
- Jinchuan Y, Zonggui W, Jinming C, Li L, Xiantao K. Upregulation of CD40–CD40 ligand system in patients with diabetes mellitus. Clin Chim Acta. 2004;339:85–90.
- Chiarelli F, Giannini C, Verrotti A, Mezzetti A, Mohn A. Increased concentrations of soluble CD40 ligand may help to identify type 1 diabetic adolescents and young adults at risk for developing persistent microalbuminuria. Diabetes Metab Res Rev. 2008;24:570–6.
- Rosa JS, Flores RL, Oliver SR, Pontello AM, Zaldivar FP, Galassetti PR. Sustained IL-1alpha, IL-4, and IL-6 elevations following correction of hyperglycemia in children with type 1 diabetes mellitus. Pediatr Diabetes. 2008;9:9–16.
- Mylona-Karayanni C, Gourgiotis D, Bossios A, Kamper EF. Oxidative stress and adhesion molecules in children with type 1 diabetes mellitus: a possible link. Pediatr Diabetes. 2006;7:51–9.
- Khuu HM, Robinson CA, Goolsby K, Hardy RW, Konrad RJ. Evaluation of a fully automated high-performance liquid chromatography assay for hemoglobin A1c. Arch Pathol Lab Med. 1999;123:763–7.
- Podani J. On the sensitivity of ordination and classification methods to variation in the input order of data. Journal of Vegetation Science. 1997;8:153–6.
- van der Kloot WA, Spanns AMJ, Heiser WJ. Instability of hierarchical cluster analysis due to the input order of the data: The PermuCLUSTER solution. Psychol Methods. 2005;10:468–76.
- Sokal RR, Rohlf FJ. The comparison of dendrograms by objective methods. Taxon. 1962;11:33–41.
- Eizirik DL, Colli ML, Ortis F. The role of inflammation in insulitis and beta-cell loss in type 1 diabetes. Nat Rev Endocrinol. 2009;5:219–26.
- Basu S, Larsson A, Vessby J, Vessby B, Berne C. Type 1 diabetes is associated with increased cyclooxygenase- and cytokine-mediated inflammation. Diabetes Care. 2005; 28:1371–5.
- Dogan Y, Akarsu S, Ustundag B, Yilmaz E, Gurgoze MK. Serum IL-1beta, IL-2, and IL-6 in insulin-dependent diabetic children. Mediators Inflamm. 2006;2006:59206.
- Shanmugam N, Reddy MA, Guha M, Natarajan R. High glucose-induced expression of proinflammatory cytokine and chemokine genes in monocytic cells. Diabetes. 2003;52:1256–64.
- Foss-Freitas MC, Foss NT, Donadi EA, Foss MC. Effect of the glycemic control on intracellular cytokine production from peripheral blood mononuclear cells of type 1 and type 2 diabetic patients. Diabetes Res Clin Pract. 2008;82:329–34.
- Alexandraki KI, Piperi C, Ziakas PD, Apostolopoulos NV, Makrilakis K, Syriou V, . Cytokine secretion in long-standing diabetes mellitus type 1 and 2: associations with low-grade systemic inflammation. J Clin Immunol. 2008; 28:314–21.
- Opal SM, DePalo VA. Anti-inflammatory cytokines. Chest. 2000;117:1162–72.
- Stechova K, Bohmova K, Vrabelova Z, Sepa A, Stadlerova G, Zacharovova K, . High T-helper-1 cytokines but low T-helper-3 cytokines, inflammatory cytokines and chemokines in children with high risk of developing type 1 diabetes. Diabetes Metab Res Rev. 2007;23:462–71.
- Bachmann MF, Oxenius A. Interleukin 2: from immunostimulation to immunoregulation and back again. EMBO Rep. 2007;8:1142–8.
- Tisch R, McDevitt H. Insulin-dependent diabetes mellitus. Cell. 1996;85:291–7.
- Fisman EZ, Adler Y, Tenenbaum A. Biomarkers in cardiovascular diabetology: interleukins and matrixins. Adv Cardiol. 2008;45:44–64.
- Bradley LM, Asensio VC, Schioetz LK, Harbertson J, Krahl T, Patstone G, . Islet-specific Th1, but not Th2, cells secrete multiple chemokines and promote rapid induction of autoimmune diabetes. J Immunol. 1999;162:2511–20.
- Maxwell PR, Timms PM, Chandran S, Gordon D. Peripheral blood level alterations of TIMP-1, MMP-2 and MMP-9 in patients with type 1 diabetes. Diabet Med. 2001;18:777–80.
- Xue M, Thompson PJ, Clifton-Bligh R, Fulcher G, Gallery ED, Jackson C. Leukocyte matrix metalloproteinase-9 is elevated and contributes to lymphocyte activation in type I diabetes. Int J Biochem Cell Biol. 2005;37:2406–16.
- Jacqueminet S, Ben Abdesselam O, Chapman MJ, Nicolay N, Foglietti MJ, Grimaldi A, . Elevated circulating levels of matrix metalloproteinase-9 in type 1 diabetic patients with and without retinopathy. Clin Chim Acta. 2006;367:103–7.
- Gaudreau S, Guindi C, Menard M, Besin G, Dupuis G, Amrani A. Granulocyte-macrophage colony-stimulating factor prevents diabetes development in NOD mice by inducing tolerogenic dendritic cells that sustain the suppressive function of CD4+CD25+ regulatory T cells. J Immunol. 2007;179:3638–47.
- Gangi E, Vasu C, Cheatem D, Prabhakar BS. IL-10-producing CD4+CD25+ regulatory T cells play a critical role in granulocyte-macrophage colony-stimulating factor-induced suppression of experimental autoimmune thyroiditis. J Immunol. 2005;174:7006–13.
- Krakowski M, Abdelmalik R, Mocnik L, Krahl T, Sarvetnick N. Granulocyte macrophage-colony stimulating factor (GM-CSF) recruits immune cells to the pancreas and delays STZ-induced diabetes. J Pathol. 2002;196:103–12.
- Maurer M, von Stebut E. Macrophage inflammatory protein-1. Int J Biochem Cell Biol. 2004;36:1882–6.
- Lohmann T, Laue S, Nietzschmann U, Kapellen TM, Lehmann I, Schroeder S, . Reduced expression of Th1-associated chemokine receptors on peripheral blood lymphocytes at diagnosis of type 1 diabetes. Diabetes. 2002;51:2474–80.
- Pfleger C, Kaas A, Hansen L, Alizadeh B, Hougaard P, Holl R, . Relation of circulating concentrations of chemokine receptor CCR5 ligands to C-peptide, proinsulin and HbA1c and disease progression in type 1 diabetes. Clin Immunol. 2008;128:57–65.
- Chatzigeorgiou A, Lyberi M, Chatzilymperis G, Nezos A, Kamper E. CD40/CD40L signaling and its implication in health and disease. Biofactors. 2009;35:474–83.
- Contin C, Pitard V, Delmas Y, Pelletier N, Defrance T, Moreau JF, . Potential role of soluble CD40 in the humoral immune response impairment of uraemic patients. Immunology. 2003;110:131–40.
- van Kooten C, Gaillard C, Galizzi JP, Hermann P, Fossiez F, Banchereau J, . B cells regulate expression of CD40 ligand on activated T cells by lowering the mRNA level and through the release of soluble CD40. Eur J Immunol. 1994;24:787–92.
- Sharma MD, Leite de Moraes M, Zavala F, Pontoux C, Papiernik M. Induction and inhibition of CD40-CD40 ligand interactions: a new strategy underlying host-virus relationships. J Immunol. 1998;161:5357–65.
- Eshel D, Toporik A, Efrati T, Nakav S, Chen A, Douvdevani A. Characterization of natural human antagonistic soluble CD40 isoforms produced through alternative splicing. Mol Immunol. 2008;46:250–7.
- Contin C, Pitard V, Itai T, Nagata S, Moreau JF, Dechanet-Merville J. Membrane-anchored CD40 is processed by the tumor necrosis factor-alpha-converting enzyme. Implications for CD40 signaling. J Biol Chem. 2003;278: 32801–9.
- Chase HP, Cooper S, Osberg I, Stene LC, Barriga K, Norris J, . Elevated C-reactive protein levels in the development of type 1 diabetes. Diabetes. 2004;53:2569–73.
- Ludvigsson J. Immune intervention at diagnosis—should we treat children to preserve beta-cell function? Pediatr Diabetes. 2007;8 Suppl 6:34–9.
- von Herrath M, Sanda S, Herold K. Type 1 diabetes as a relapsing-remitting disease? Nat Rev Immunol. 2007;7:988–94.
- Cameron MJ, Arreaza GA, Grattan M, Meagher C, Sharif S, Burdick MD, . Differential expression of CC chemokines and the CCR5 receptor in the pancreas is associated with progression to type I diabetes. J Immunol. 2000;165: 1102–10.
- Chistiakov DA, Voronova NV, Chistiakov PA. The crucial role of IL-2/IL-2RA-mediated immune regulation in the pathogenesis of type 1 diabetes, an evidence coming from genetic and animal model studies. Immunol Lett. 2008; 118:1–5.
- Eisenstein EM, Williams CB. The T(reg)/Th17 cell balance: a new paradigm for autoimmunity. Pediatr Res. 2009; 65:26R–31R.
- Boissier MC, Assier E, Biton J, Denys A, Falgarone G, Bessis N. Regulatory T cells (Treg) in rheumatoid arthritis. Joint Bone Spine. 2009;76:10–14.