Abstract
Background. Urinary angiotensinogen (AGT) was reported as a marker of renal injury in chronic kidney disease patients. However, the main source of urinary AGT is unknown in proteinuric patients because the disrupted filtration barrier might cause AGT filtration. We investigated the origin and the clinical importance of urinary AGT in proteinuric IgA nephropathy (IgAN) patients.
Methods. In patients with biopsy-proven IgAN, urinary and plasma AGT was measured using a sandwich ELISA and compared with intrarenal AGT expression. The patients were followed up for 3 years.
Results. Natural logarithm of the urinary AGT/creatinine (ln (urinary AGT/Cr)) was positively correlated with intrarenal expression of AGT (ln (urinary AGT/Cr) versus AGT/β-actin, r = 0.620, P < 0.0001; ln (urinary AGT/Cr) versus AGT density, r = 0.452, P = 0.007). Ln (urinary AGT/Cr) showed a positive correlation with urinary protein/creatinine ratio (PCR) but a negative correlation with estimated glomerular filtration rate (eGFR). Regression analyses showed that ln (urinary AGT/Cr) was a significant determinant of urinary PCR and eGFR 3 years after biopsy.
Conclusions. Urinary AGT reflects intrarenal AGT expression and correlates with the extent of proteinuria and renal function. Our study indicates the intrarenal compartment as the main source of urinary AGT, suggesting its clinical implication as an important biomarker in proteinuric IgAN patients.
| Abbreviations | ||
| ACEI | = | angiotensin-converting enzyme inhibitor |
| AGT | = | angiotensinogen |
| ARB | = | angiotensin receptor blocker |
| AngII | = | angiotensin II |
| CKD | = | chronic kidney disease |
| eGFR | = | estimated glomerular filtration rate |
| ELISA | = | enzyme-linked immunosorbent assay |
| IgAN | = | immunoglobulin A (IgA) nephropathy |
| Ln (or ln) | = | natural logarithm |
| MAP | = | mean arterial pressure |
| PCR | = | protein-to-creatinine ratio |
| RAS | = | renin–angiotensin system |
| TGF-β | = | transforming growth factor (TGF)-β |
Key messages
Urinary angiotensinogen (AGT) excretion directly reflects intrarenal AGT expression measured with renal tissue and shows a positive correlation with urinary protein-to-creatinine ratio and a negative correlation with estimated glomerular filtration rate in biopsy-proven IgA nephropathy patients with various degrees of proteinuria.
Our study indicates the intrarenal compartment as the main source of urinary AGT in IgA nephropathy patients with various degrees of proteinuria and shows the potential clinical value of urinary AGT as an important biomarker that predicts major short-term outcomes.
Introduction
Angiotensinogen (AGT), which has a positive feedback with angiotensin II (AngII), is an important marker of the activity of the renin–angiotensin system (RAS). Enhanced intrarenal AGT expression is associated with the development of AngII-dependent hypertension in a murine hypertension model (Citation1–3) and early renal injury in spontaneously hypertensive rats (Citation4). A report showing that urinary AGT excretion reflects intrarenal AGT production stimulated further studies on methods for precisely and consistently measuring urinary AGT level, as urine samples are easily obtained (Citation5). A sandwich enzyme-linked immunosorbent assay (ELISA) for urinary AGT was recently introduced (Citation6,Citation7). Although urinary AGT excretion was reported to reflect intrarenal AGT production in an animal model of AngII-dependent hypertension (Citation5), the main source of urinary AGT is unknown, especially in proteinuric patients. Urinary AGT excretion was reported to be positively correlated with urinary albumin/creatinine ratio in chronic kidney disease patients, but this does not constitute direct evidence that urinary AGT excretion reflects intrarenal AGT production in proteinuric patients (Citation8). In proteinuric patients, it is unclear whether urinary AGT originates from intrarenal AGT production or whether it is filtered from the systemic circulation, because the glomerular filtration barrier is usually disrupted in proteinuric patients.
The aim of this study was to elucidate the main source and the clinical significance of urinary AGT as a biomarker and a prognostic factor in proteinuric IgA nephropathy (IgAN) patients. We used IgAN patients because activation of the intrarenal RAS is known to be involved in the pathogenesis of IgAN (Citation9–11). Intrarenal AGT expression is enhanced in IgAN patients, and it has been suggested that it is involved in local AngII production and causes glomerular injury in IgAN (Citation12). Because intrarenal AGT production reflects the activity of the intrarenal RAS and is implicated in the pathogenesis of IgAN, we tested the hypotheses that urinary AGT excretion directly reflects intrarenal AGT expression, and that urinary AGT excretion is a biomarker that is correlated with important clinical parameters in proteinuric IgAN patients. First, we measured urinary AGT excretion using a sandwich ELISA and compared the results with Western blotting and immunohistochemical estimates of intrarenal AGT expression, estimates of the extent of proteinuria, and estimated glomerular filtration rate (eGFR). We found that urinary AGT level normalized to creatinine level reflected intrarenal AGT expression in proteinuric IgAN patients and correlated positively with the urinary protein-to-creatinine ratio (PCR), but correlated negatively with eGFR. We then followed up the extent of proteinuria, renal function, and blood pressure for 3 years and found that initial urinary AGT excretion is a significant determinant of the extent of proteinuria and renal function 3 years thereafter.
Patients and methods
Patient selection and sample collection
Biopsy-proven IgAN patients who were diagnosed between 2003 and 2006 at Samsung Medical Center were included after obtaining approval from the institutional review board. Of the 76 patients diagnosed with biopsy-proven IgAN, data from 64 patients with proteinuria were analyzed. Eight patients who only had asymptomatic urinary abnormality (microscopic hematuria with urinary PCR less than 0.2) and four patients who received corticosteroid treatment were excluded. Demographic factors and clinical data including age, sex, family history, blood pressure, and medication history were collected before sample collection. Plasma and urine samples were collected immediately before the kidney biopsy. After embedment of biopsy tissue, the remaining renal tissue was collected and used for Western blotting. Urinary and plasma AGT, and intrarenal AGT expression were measured with a sandwich ELISA and Western blotting/immunohistochemistry, respectively, using samples collected at the time of kidney biopsy.
Clinical parameters such as urinary PCR, eGFR, and blood pressure were followed up every 1 or 2 months for 3 years. Average of mean arterial pressure (MAP) and mean urinary PCR were estimated from median values over a 6-month period. The eGFR was calculated using serum creatinine level and the Modification of Diet in Renal Disease formula.
AGT ELISA of plasma and urine samples
The AGT ELISA was developed using recombinant human AGT protein. First, the full-length human AGT (34-485 amino acids) gene, except for the signal peptide (amino acids 1-33) portion, was amplified using the polymerase chain reaction and the following primers: sense 5′-CAT GGA TCC GAC CGG GTG TAC ATA CA-3′, and antisense 5′-GAT CTC GAG TCA TGC TGT GCT CAG C-3′. This fragment was inserted into a pET28a expression vector (Novagen, Madison, WI, USA) with a polyhistidine tag using restriction enzymes BamH I and Xho I (New England Biolabs, Ipswich, MA, USA). The recombinant products were transferred into a competent Escherichia coli cell (DH5alpha) using heat shock. Transformed E. coli cells were harvested for protein purification after large-scale (10 L) bacterial culture with isopropyl-β-D-thiogalactopyranoside. Two types of antibodies for recombinant human AGT, a mouse monoclonal antibody (Ab) and a rabbit polyclonal Ab, were prepared for the ELISA.
The ELISA plates were coated with rabbit polyclonal Ab against recombinant human AGT at 4°C overnight. The plates were washed with phosphate-buffered saline (PBS) and blocked with SuperBlock blocking solution (Pierce, Rockford, IL, USA) in PBS at 37°C for 1 hour. The plates were washed three times with PBST (PBS containing 0.05% Tween20). Standard, plasma samples (1:200–1:400 dilution in PBST containing 1% bovine serum albumin; 100 µL), and urine samples (1:2–1:8 dilution in PBST containing 1% bovine serum albumin; 100 µL) were added to each well and incubated at 37°C for 90 min. Then, the plates were incubated with mouse monoclonal Ab against human AGT at 37°C for 90 min. After the plates were washed three times with PBST, they were incubated with horseradish peroxidase (HRP)-labeled rabbit polyclonal IgG Ab against mouse monoclonal Ab at 37°C for 1 hour. The plates were washed five times with PBST. Then, the plates were incubated with 3,3’-5,5’-tetramethylbenzidine solution under light-protected conditions at room temperature for 10 min. The reaction was stopped by adding stop solution (Sigma, St Louis, MO, USA). Absorbance was measured at 450 nm.
Highly purified human AGT (Calbiochem, Beeston, UK) was used as a standard. The standard curve of this ELISA system exhibited a high degree of linearity for absorbance values from 0.51 to 2.02 (concentration range 0.00–64.00 ng/mL; n = 9 for each concentration). The correlation coefficient was greater than 0.99. The lowest sensitivity of this ELISA system was 0.9 ng/mL, which was determined according to the National Committee for Clinical Laboratory Standard's evaluation protocols. Recovery rate, measured using human AGT standards, was more than 78% for plasma and more than 84% for urine. The intra- and interassay coefficients of variation ranged from 1.9% to 6.0% and from 0.34% to 4.16%, respectively.
Blood and urine samples were centrifuged at 2,500 rpm for 15 min at 4°C. The supernatants were stored at −70°C. Urine samples were thawed and centrifuged once at 13,000 rpm for 2 min at 4°C immediately before the AGT ELISA.
Western blotting
Western blots of proteins extracted from renal tissue samples were performed using a mouse anti-human anti-AGT Ab (R&D Systems, Minneapolis, MN, USA) and an anti-human anti-β-actin antibody (Santa Cruz Biotechnology, Santa Cruz, CA, USA) as previously described (Citation3,Citation5,Citation13). AGT protein density was divided by β-actin protein density for normalization.
Immunohistochemistry
Immunohistochemical staining of AGT was performed on formalin-fixed paraffin-processed kidney tissues using a mouse anti-human anti-AGT Ab (R&D Systems). Sections (4 µm) were deparaffinized with xylene and rehydrated in a graded alcohol series, before they were placed in a citrate buffer solution (pH 6.0). The slides were placed in a pressure cooker and heated with microwave for 10 min to enhance antigen retrieval. After cooling, sections were immersed in 3% hydrogen peroxide for 10 min to block endogenous peroxidase and were then treated with PBST containing 4% bovine serum albumin (MP Biomedicals, Solon, OH, USA) and dextran (Sigma) to block non-specific binding. After washing, the slides were incubated with a 1:50 dilution of monoclonal mouse anti-human antibody to AGT for 1 hour at room temperature. After two washes, the slides were incubated with a HRP-conjugated goat anti-mouse IgG secondary Ab (R&D Systems) for 30 min at room temperature. DAB (3, 3’-diaminobenzidine tetrahydrochloride; DAKO, Carpinteria, CA, USA) was applied to the slides to develop the brown stain. Counterstaining was done using hematoxylin (Sigma). The entire stained field was evaluated. Images were captured, and the area of AGT-positive staining was analyzed using Image-Pro Plus version 7.0 software (Media Cybernetics, Silver Spring, MD, USA). The density of AGT-positive tubules per cm2 that exceeded a predetermined intensity threshold was determined and expressed as an arbitrary unit (AU).
Statistical analysis
All data are expressed as the mean ± standard deviation (SD) or standard error of mean (SEM) as appropriate. AGT levels were compared after logarithmic conversion because AGT levels did not follow normal distribution. Group means were compared using the t test. Pearson and Spearman correlation analyses were used for parametric and non-parametric data, respectively. Logistic regression, simple linear regression, and multiple linear regression analyses were used to identify factors associated with urinary PCR and eGFR after 3 years. All computations were performed using PASW Statistics 18.0 (SPSS Inc., Chicago, IL, USA) and GraphPad Prism version 4 (GraphPad Software, San Diego, CA, USA). Statistical significance was determined when the P value was less than 0.05.
Results
Baseline characteristics
A total of 64 patients (41 males and 23 females) with biopsy-proven IgAN and proteinuria were included. The baseline demographic and clinical characteristics of the patients are summarized in . The mean ± SD age was 36 ± 12.0 years (16–61 years). The random urinary PCR was 1.57 ± 0.14 mg/mg (range 0.2–5.1). The mean eGFR was 71.33 ± 3.53 mL/min/1.73 m2, and 49 patients (76.6% of all patients) had an eGFR less than 90 mL/min/1.73 m2. There was no difference in the extent of proteinuria or renal function (eGFR) within the sexes. Among the 64 patients, 39 patients (60.9%) were taking angiotensin receptor blockers (ARBs) or angiotensin-converting enzyme inhibitors (ACEIs) at the time of the sample collection. Those patients had been taking various kinds and doses of ARBs and ACEIs for various periods of time before sample collection.
Table I. Baseline characteristics of patients.
Urinary AGT/Cr levels reflected intrarenal AGT expression
Logarithmically converted urinary AGT/creatinine (ln (urinary AGT/Cr)) levels were compared with AGT/β-actin levels and with AGT densities measured using Western blotting of renal tissue protein extracts and immunohistochemistry, respectively. The ln (urinary AGT/Cr) level was significantly correlated with AGT/β-actin level and AGT density (). AGT staining was positive on tubules, mainly proximal tubules, in renal tissues. The strongest correlation was between ln (urinary AGT/Cr) and AGT/β-actin level. However, there was no correlation between ln (plasma AGT) and ln (urinary AGT/Cr), AGT/β-actin level, or AGT density (). There were no differences in ln (plasma AGT), ln (urinary AGT/Cr), AGT/β-actin level, or AGT density between patients without medication and patients who were taking ARBs or ACEIs at the time of sample collection (no medication versus ARBs or ACEIs, 1.58 ± 0.11 versus 1.37 ± 0.19 in ln (plasma AGT); 3.38 ± 0.24 versus 3.35 ± 0.30 in ln (urinary AGT/Cr); 1.03 ± 0.13 versus 1.02 ± 0.20 in AGT/β-actin; 29.3 ± 3.05 versus 25.65 ± 4.17 in AGT density (AU)). There was also no difference in the extent of proteinuria (no medication versus ARBs or ACEIs 1.27 ± 0.14 versus 1.65 ± 0.20 in urinary PCR).
Figure 1. The urinary excretion of AGT reflected renal AGT expression. A: Ln (urinary AGT/Cr) was significantly and positively correlated with AGT/β-actin measured using Western blotting (n = 63). B: Ln (urinary AGT/Cr) was significantly and positively correlated with kidney AGT density measured using immunohistochemistry (n = 35). C: There was a significant positive correlation between AGT/β-actin and kidney AGT density (n = 35). D: Representative Western blots and tissue sections showing AGT expression. Arrows indicate the AGT-stained tubules. (a) High expression of AGT; (b) intermediate expression of AGT; (c) low expression of AGT; magnification ×200 (AU = arbitrary unit).
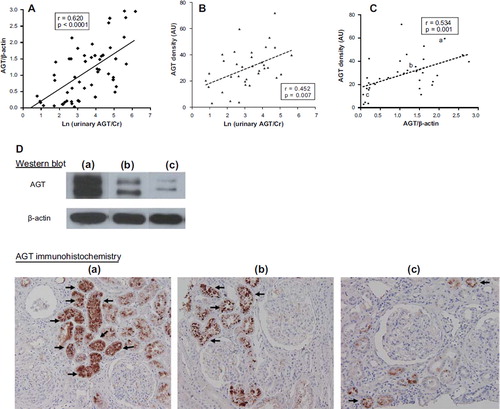
Figure 2. Plasma AGT level was not correlated with urinary AGT excretion or renal AGT expression. A: Ln (urinary AGT/Cr) was not correlated with ln (plasma AGT) (n = 64). B: There was no correlation between ln (plasma AGT) and AGT/β-actin (n = 63). C: There was no correlation between ln (plasma AGT) and kidney AGT density (n = 35) (AU = arbitrary unit).
Urinary AGT/Cr level was positively correlated with the extent of proteinuria and negatively correlated with eGFR
The extent of proteinuria and renal function were evaluated according to estimates of urinary PCR and eGFR, respectively, at the time of the kidney biopsy. There was a significant positive correlation between ln (urinary AGT/Cr) and random urinary PCR in all patients (r = 0.740; P < 0.0001) ().
Figure 3. Urinary AGT excretion was positively correlated with urinary PCR and negatively correlated with eGFR. A: Ln (urinary AGT/Cr) was significantly and positively correlated with urinary PCR (n = 64). B: Ln (urinary AGT/Cr) was negatively correlated with eGFR (n = 64). C: There was no correlation between ln (plasma AGT) and urinary PCR (n = 64). D: There was no correlation between ln (plasma AGT) and eGFR (n = 64).
The eGFR was negatively correlated with ln (urinary AGT/Cr) in all patients (r = −0.517; P < 0.0001) (). Ln (plasma AGT) was not correlated with urinary PCR or eGFR (). Ln (urinary AGT/Cr) was higher in patients with more advanced glomerulosclerosis and interstitial fibrosis (3.05 ± 0.20 in grade 1, 3.93 ± 0.31 in grade 2, 4.59 ± 0.47 in grade 3 of glomerulosclerosis, P < 0.05; 3.05 ± 0.25 in grade 1, 3.47 ± 0.28 in grade 2, 4.12 ± 0.31 in grade 3 of interstitial fibrosis, P < 0.05).
Urinary AGT/Cr level was predictive of the extent of proteinuria and eGFR after 3 years of follow-up
Altogether 52 patients were followed up for 3 years. ARBs or ACEIs were administered to all patients during the follow-up period. The mean value of random urinary PCR after 3 years was 1.10, which was lower than the mean value of initial urinary PCR, 1.57. The correlation analysis showed that ln (urinary AGT/Cr) was significantly and positively correlated with urinary PCR 3 years later (). A total of 22 patients (42.3%) had persistent overt proteinuria (random urinary PCR greater than 1.0 mg/mg). Logistic regression analysis showed that high ln (urinary AGT/Cr) correlated with persistent overt proteinuria ().
Figure 4. Urinary AGT excretion was positively correlated with urinary PCR 3 years later and negatively correlated with % change of eGFR for 3 years. A: Urinary PCR measured after 3 years of follow-up was positively correlated with ln (urinary AGT/Cr) (n = 52). B: Ln (urinary AGT/Cr) correlated negatively with percent change of eGFR for 3 years (n = 52).
Table II. Logistic regression analysis for patients with persistent overt proteinuria after 3 years.
The mean eGFR decreased from 71.33 to 51.12 mL/min/1.73 m2 after 3 years. Ln (urinary AGT/Cr) correlated negatively with percent change of eGFR for 3 years (). There was a significant negative correlation between ln (urinary AGT/Cr) and eGFR after 3 years (r = −0.599; P < 0.0001). Regression analyses were performed to confirm that ln (urinary AGT/Cr) affects eGFR after 3 years. Simple linear regression analysis indicated that age, initial urinary PCR, initial eGFR, ln (urinary AGT/Cr), and average MAP over 3 years were associated with eGFR after 3 years. Multiple linear regression analysis identified initial eGFR as a significant determinant of eGFR after 3 years ().
Table III. Determinants of renal function (eGFR) after 3 years.
Discussion
Our study shows that urinary AGT level directly reflects intrarenal AGT expression independent of systemic AGT level and is positively correlated with urinary PCR and negatively correlated with eGFR in proteinuric IgAN patients. Urinary AGT level was also correlated with urinary PCR and eGFR measured after 3 years of follow-up. Regression analyses showed that urinary AGT level was a significant determinant of urinary PCR and eGFR after 3 years. Our study demonstrates that urinary AGT mainly originates from intrarenal AGT in proteinuric IgAN patients and is a potential biomarker for predicting short-term outcomes in these patients.
Under normal physiologic conditions, AGT is not filtrated from the systemic circulation because the molecular weight of AGT is 52–64 kDa, similar to albumin. However, in patients with overt proteinuria, the main source of urinary AGT is uncertain because AGT may be filtrated from the systemic circulation due to disruption of the glomerular filtration barrier. One of the significances of our study is that we showed the intrarenal compartment, not the systemic pool, as the main source of urinary AGT in patients with overt proteinuria. In order to elucidate the main source of urinary AGT in proteinuric patients, we scrutinized the expression of intrarenal AGT with renal tissues and systemic AGT with plasma samples. The expression of intrarenal AGT was examined using two methods: Western blotting and immunohistochemistry. Ln (urinary AGT/Cr) was significantly and positively correlated with intrarenal AGT expression measured using either method. The strongest correlation was between ln (urinary AGT/Cr) and AGT/β-actin measured using Western blotting. Although previous studies reported that intrarenal RAS activation, including enhanced AGT expression, was central to the pathogenesis of IgAN, these studies were performed using animals or renal tissues from a small number of patients (Citation9–11,Citation14). RAS activation has also been reported to be involved in the pathogenesis of several other diseases including hypertension and chronic kidney disease (Citation15,Citation16). Urinary excretion of AGT measured using an ELISA or a radioimmunoassay was increased in hypertension and chronic kidney disease (Citation8,Citation16,Citation17). As patients showing significant proteinuria were excluded from these studies, it was unclear whether the urinary AGT level of proteinuric patients reflects intrarenal AGT production. Our study shows that an elevated urinary AGT level reflects intrarenal AGT expression in proteinuric IgAN patients. Urinary AGT levels of minimal-change disease patients were similar with those of healthy controls, and this report is compatible with our results showing that urinary AGT mainly originated from the intrarenal compartment rather than the systemic pool in proteinuric patients (Citation8). A recent paper analyzed urinary AGT, intrarenal AngII, and intrarenal mRNA expression of AGT in 11 patients with IgAN. However, the number of patients was too small to conclude the main source of urinary AGT, and the follow-up period was too short to evaluate the possible role of urinary AGT as a biomarker (Citation18).
Urinary AGT excretion was significantly and positively correlated with urinary PCR and negatively correlated with eGFR in our study, implying that urinary AGT excretion reflects not only intrarenal RAS activation but also the degree of renal injury in IgAN. Although activation of the intrarenal RAS was already reported to contribute to the pathogenesis of IgAN (Citation9–12), the main source and the clinical value of urinary AGT were not fully elucidated in IgAN patients. In pediatric IgAN patients, both intrarenal AGT expression and AngII production were enhanced, and transforming growth factor (TGF)-β expression was subsequently increased, which caused glomerular injury in IgAN (Citation12). Production of ROS and RAS activation were recently suggested to be important pathogenic factors in a murine IgAN model (Citation10,Citation14). The proinflammatory effect of AngII may also contribute to renal injury because chronic AngII infusion increased monocyte chemotactic protein-1 and TGF-β levels, resulting in sustained renal interstitial macrophage infiltration (Citation19). Although we did not find any direct evidence of increased expression of ROS or macrophage infiltration in our patients’ samples, our data on the grading of renal injury showed that urinary AGT excretion is associated with the severity of glomerulosclerosis and interstitial fibrosis, suggesting that urinary AGT excretion is a potential surrogate marker of the extent of renal injury in IgAN.
Regression analyses showed that urinary AGT level is a significant determinant of proteinuria and renal function 3 years later. Age, initial urinary PCR, initial eGFR, and average MAP over 3 years were also significant determinants of renal function 3 years later. These results are in agreement with those of previous studies, in which initial renal function, proteinuria, and hypertension were prognostic factors in IgAN patients (Citation20–22). Our data show that urinary AGT excretion is associated with the extent of proteinuria and with renal function 3 years thereafter, suggesting that the enhanced intrarenal AGT expression may contribute to the progression of renal injury. These results could be interpreted such that more aggressive treatment and frequent follow-ups may be required for IgAN patients with higher urinary AGT levels even if their renal function is not impaired at the time of diagnosis.
A few limitations to our study deserve consideration. First, we did not elucidate the underlying mechanism of intrarenal AGT production in IgAN patients or factors that increase it because urinary AGT excretion was measured only at the time of the kidney biopsy. Animal studies have reported that factors such as sodium homeostasis and glucose level influence intrarenal AGT expression (Citation23–25). Environmental and genetic factors that affect intrarenal AGT production in IgAN patients need to be evaluated to improve the clinical outcomes of patients in the future. Second, the effects of specific drugs on urinary AGT excretion in proteinuric IgAN patients were not investigated in our study. Patients who received corticosteroid treatment were excluded because the glucocorticoid responsive element is located in the promoter region of the human AGT gene (Citation26,Citation27) and corticosteroids may affect plasma and/or urinary AGT levels. RAS-blocking agents were reported to attenuate the augmentation of urinary AGT excretion in hypertension and chronic glomerulonephritis patients (Citation17,Citation28). A recent report showed that in 13 patients with hypertensive diabetic nephropathy, both urinary AGT excretion and the extent of albuminuria were decreased 16 weeks after ARB treatment (Citation29). On the same line of thought, we expected that urinary AGT excretion would be lower in IgAN patients taking RAS-blocking agents. In our study, the extent of proteinuria and the levels of urinary AGT excretion were not lower in patients who were taking RAS-blocking agents at the time of sample collection. However, this does not imply that RAS-blocking agents do not reduce intrarenal AGT production, because urinary AGT levels before and after initiating RAS-blocking agents were not compared due to the following reasons. First, urine and plasma samples for AGT ELISA were collected once at the time of kidney biopsy because the primary aim of our study was to investigate the main origin of urinary AGT in proteinuric IgAN patients. Some patients of our study were already taking RAS-blocking agents at the time of sample collection. In clinical practice, RAS-blocking agents are frequently prescribed for patients with overt proteinuria, especially those who have heavier proteinuria, even before kidney biopsy. Second, several different ARBs or ACEIs of variable doses and duration were administered before kidney biopsy in patients with heavy proteinuria. Therefore, it was not feasible to evaluate the effects of RAS-blocking agents on urinary AGT excretion. Third, the extent of proteinuria in patients who were taking RAS-blocking agents was similar to that in patients who were not. These data imply that patients who were taking RAS-blocking agents at the time of sample collection had heavier proteinuria and higher levels of urinary AGT before taking RAS-blocking agents compared to patients who were not. We believe that intrarenal AGT production was attenuated with RAS-blocking agents but was not fully suppressed in patients who seemed to have more enhanced intrarenal AGT production and consequently heavier proteinuria.
Conclusion
In conclusion, our study shows that urinary AGT excretion measured using a sandwich ELISA reflects intrarenal AGT expression, indicating the intrarenal compartment as the main origin of urinary AGT in proteinuric IgAN patients. In addition, urinary AGT correlates with the degree of proteinuria and with renal function after 3 years, suggesting the clinical importance of urinary AGT as a prognostic factor in these patients.
Acknowledgements
The authors thank Kyung Hee Choi and Yoon Jin Seo for technical assistance.
Declaration of interest: The authors report no conflicts of interest.
References
- Schunkert H, Ingelfinger JR, Jacob H, Jackson B, Bouyounes B, Dzau VJ. Reciprocal feedback regulation of kidney angiotensinogen and renin mRNA expressions by angiotensin II. Am J Physiol. 1992;263:E863–9.
- Gonzalez-Villalobos RA, Seth DM, Satou R, Horton H, Ohashi N, Miyata K, . Intrarenal angiotensin II and angiotensinogen augmentation in chronic angiotensin II-infused mice. Am J Physiol Renal Physiol. 2008;295:F772–9.
- Kobori H, Harrison-Bernard LM, Navar LG. Enhancement of angiotensinogen expression in angiotensin II-dependent hypertension. Hypertension. 2001;37:1329–35.
- Kobori H, Ozawa Y, Suzaki Y, Nishiyama A. Enhanced intrarenal angiotensinogen contributes to early renal injury in spontaneously hypertensive rats. J Am Soc Nephrol. 2005; 16:2073–80.
- Kobori H, Harrison-Bernard LM, Navar LG. Urinary excretion of angiotensinogen reflects intrarenal angiotensinogen production. Kidney Int. 2002;61:579–85.
- Suzaki Y, Ozawa Y, Kobori H. Quantification of human angiotensinogen by a novel sandwich ELISA. Peptides. 2006;27: 3000–2.
- Katsurada A, Hagiwara Y, Miyashita K, Satou R, Miyata K, Ohashi N, . Novel sandwich ELISA for human angiotensinogen. Am J Physiol Renal Physiol. 2007;293: F956–60.
- Kobori H, Ohashi N, Katsurada A, Miyata K, Satou R, Saito T, . Urinary angiotensinogen as a potential biomarker of severity of chronic kidney diseases. J Am Soc Hypertens. 2008;2:349–54.
- Del Prete D, Gambaro G, Lupo A, Anglani F, Brezzi B, Magistroni R, . Precocious activation of genes of the renin-angiotensin system and the fibrogenic cascade in IgA glomerulonephritis. Kidney Int. 2003;64:149–59.
- Ohashi N, Katsurada A, Miyata K, Satou R, Saito T, Urushihara M, . Activation of reactive oxygen species and the renin-angiotensin system in IgA nephropathy model mice. Clin Exp Pharmacol Physiol. 2009;36:509–15.
- Kobori H, Katsurada A, Ozawa Y, Satou R, Miyata K, Hase N, . Enhanced intrarenal oxidative stress and angiotensinogen in IgA nephropathy patients. Biochem Biophys Res Commun. 2007;358:156–63.
- Takamatsu M, Urushihara M, Kondo S, Shimizu M, Morioka T, Oite T, . Glomerular angiotensinogen protein is enhanced in pediatric IgA nephropathy. Pediatr Nephrol. 2008;23:1257–67.
- Kobori H, Nishiyama A, Harrison-Bernard LM, Navar LG. Urinary angiotensinogen as an indicator of intrarenal angiotensin status in hypertension. Hypertension. 2003;41: 42–9.
- Ohashi N, Katsurada A, Miyata K, Satou R, Saito T, Urushihara M, . Role of activated intrarenal reactive oxygen species and renin-angiotensin system in IgA nephropathy model mice. Clin Exp Pharmacol Physiol. 2009;36:750–5.
- Kobori H, Prieto-Carrasquero MC, Ozawa Y, Navar LG. AT1 receptor mediated augmentation of intrarenal angiotensinogen in angiotensin II-dependent hypertension. Hypertension. 2004;43:1126–32.
- Yamamoto T, Nakagawa T, Suzuki H, Ohashi N, Fukasawa H, Fujigaki Y, . Urinary angiotensinogen as a marker of intrarenal angiotensin II activity associated with deterioration of renal function in patients with chronic kidney disease. J Am Soc Nephrol. 2007;18:1558–65.
- Kobori H, , Alper AB JrShenava R, Katsurada A, Saito T, Ohashi N, . Urinary angiotensinogen as a novel biomarker of the intrarenal renin-angiotensin system status in hypertensive patients. Hypertension. 2009;53:344–50.
- Nishiyama A, Konishi Y, Ohashi N, Morikawa T, Urushihara M, Maeda I, . Urinary angiotensinogen reflects the activity of intrarenal renin-angiotensin system in patients with IgA nephropathy. Nephrol Dial Transplant. 2011;26:170–7.
- Ozawa Y, Kobori H, Suzaki Y, Navar LG. Sustained renal interstitial macrophage infiltration following chronic angiotensin II infusions. Am J Physiol Renal Physiol. 2007; 292:F330–9.
- Radford MG Jr, Donadio JV Jr, Bergstralh EJ, Grande JP. Predicting renal outcome in IgA nephropathy. J Am Soc Nephrol. 1997;8:199–207.
- Lemley KV, Lafayette RA, Derby G, Blouch KL, Anderson L, Efron B, . Prediction of early progression in recently diagnosed IgA nephropathy. Nephrol Dial Transplant. 2008; 23:213–22.
- Goto M, Wakai K, Kawamura T, Ando M, Endoh M, Tomino Y. A scoring system to predict renal outcome in IgA nephropathy: a nationwide 10-year prospective cohort study. Nephrol Dial Transplant. 2009;24:3068–74.
- Kobori H, Nishiyama A, Abe Y, Navar LG. Enhancement of intrarenal angiotensinogen in Dahl salt-sensitive rats on high salt diet. Hypertension. 2003;41:592–7.
- Lantelme P, Rohrwasser A, Gociman B, Hillas E, Cheng T, Petty G, . Effects of dietary sodium and genetic background on angiotensinogen and renin in mouse. Hypertension. 2002;39:1007–14.
- Hsieh TJ, Zhang SL, Filep JG, Tang SS, Ingelfinger JR, Chan JS. High glucose stimulates angiotensinogen gene expression via reactive oxygen species generation in rat kidney proximal tubular cells. Endocrinology. 2002;143:2975–85.
- Jain S, Li Y, Patil S, Kumar A. A single-nucleotide polymorphism in human angiotensinogen gene is associated with essential hypertension and affects glucocorticoid induced promoter activity. J Mol Med. 2005;83:121–31.
- Jain S, Li Y, Patil S, Kumar A. HNF-1alpha plays an important role in IL-6-induced expression of the human angiotensinogen gene. Am J Physiol Cell Physiol. 2007;293: C401–10.
- Urushihara M, Kondo S, Kagami S, Kobori H. Urinary angiotensinogen accurately reflects intrarenal renin-angiotensin system activity. Am J Nephrol.2010;31:318–25.
- Ogawa S, Kobori H, Ohashi N, Urushihara M, Nishiyama A, Mori T, . Angiotensin II type 1 receptor blockers reduce urinary angiotensinogen excretion and the levels of urinary markers of oxidative stress and inflammation in patients with type 2 diabetic nephropathy. Biomark Insights. 2009;4:97–102.