Abstract
Context and objective. Lipoproteins are involved in the pathophysiology of several metabolic diseases. Here we focus on the interplay between lipoprotein metabolism and adiponectin with the extension of alcohol intake. Design and subjects. Eighty-three low-to-moderate and 80 heavy alcohol drinkers were studied. Plasma adiponectin, other biochemical and extensive lipoprotein data were measured. Self-organizing maps were applied to characterize lipoprotein phenotypes and their interrelationships with biochemical measures and alcohol consumption. Results. Alcohol consumption and plasma adiponectin had a strong positive association. Heavy alcohol consumption was associated with decreased low-density lipoprotein cholesterol (LDL-C). Nevertheless, two distinct lipoprotein phenotypes were identified, one with elevated high-density lipoprotein cholesterol (HDL-C) and decreased very-low-density lipoprotein triglycerides (VLDL-TG) together with low prevalence of metabolic syndrome, and the other vice versa. The HDL particles were enlarged in both phenotypes related to the heavy drinkers. The low-to-moderate alcohol drinkers were characterized with high LDL-C and C-enriched LDL particles. Conclusions. The analyses per se illustrated the multi-faceted and non-linear nature of lipoprotein metabolism. The heavy alcohol drinkers were characterized either by an anti-atherogenic lipoprotein phenotype (with also the highest adiponectin concentrations) or by a phenotype with pro-atherogenic and metabolic syndrome-like features. Clinically this underlines the need to distinguish the differing individual risk for lipid-related metabolic disturbances also in heavy alcohol drinkers.
| Abbrevation | ||
| ALP | = | alkaline phosphatase |
| ALT | = | alanine aminotransferase |
| apoA-I | = | apolipoprotein A-I |
| apoB | = | apolipoprotein B |
| AST | = | aspartate aminotransferase |
| BMI | = | body mass index |
| C | = | cholesterol |
| CDT | = | carbohydrate-deficient transferrin |
| CE | = | cholesteryl esters |
| CETP | = | cholesteryl ester transfer protein |
| CHD | = | coronary heart disease |
| CI | = | confidence interval |
| EDTA | = | ethylenediaminetetraacetic acid |
| FC | = | free cholesterol |
| GT | = | γ-glutamyltransferase |
| HDL | = | high-density lipoprotein |
| hsCRP | = | high-sensitivity C-reactive protein |
| IDL | = | intermediate-density lipoprotein |
| IR | = | interquartile range |
| LDL | = | low-density lipoprotein |
| MetS | = | metabolic syndrome |
| PL | = | phospholipids |
| SOM | = | self-organizing map |
| TG | = | triglycerides |
| VLDL | = | very-low-density lipoprotein |
Key messages
Self-organizing map analysis can distinguish lipoprotein phenotypes and their interrelationships with biochemical measures in a purely data-driven manner and thereby genuinely uncover the multifaceted and non-linear nature of lipoprotein metabolism.
Heavy alcohol drinkers can be characterized either by an anti-atherogenic lipoprotein phenotype (with high adiponectin concentrations) or by a phenotype with pro-atherogenic features and increased prevalence of metabolic syndrome.
Clinical attention should be paid to recognizing differing individual risks for lipidrelated metabolic disturbances also in heavy alcohol drinkers; although they are likely to have rather low plasma LDL-C, their HDL-C and triglyceride concentrations as well as lipoprotein particle compositions may vary considerably.
Introduction
Lipoprotein metabolism is a complex cross-talk between lipoprotein particles, lipid transfer proteins, and various enzymes. Alcohol intake modulates lipoprotein metabolism, for example, by raising high- density lipoprotein cholesterol (HDL-C), altering the composition of lipoprotein particles and the plasma concentrations of lipid transfer proteins (Citation1). Adiponectin, a cytokine secreted by adipocytes, has also recently been noted to affect HDL metabolism, e.g. by increasing the synthesis of apolipoprotein (apo) A-I, the assembly of HDL particles, and the expression of ATP-binding cassette transporter A1 in the liver cells (Citation2). In fact, plasma HDL-C and adiponectin concentrations are reported to have a positive metabolic correlation (Citation3). Although low HDL-C concentration is related to increased coronary heart disease (CHD) risk (Citation4), the expected association between low adiponectin and increased CHD risk (Citation5,Citation6) has not been observed in some studies (Citation7,Citation8).
There are indications that alcohol consumption increases adiponectin levels (Citation9,Citation10). However, the complex associations between lipoprotein metabolism, adiponectin, and alcohol consumption are not yet clear. Furthermore, alcohol studies are often restricted in case-control research settings, and, therefore, the overall metabolic patterns with respect to alcohol consumption are often not analyzed. In complex situations like this, the metabolic processes also depend on several factors which most likely are non-linearly interrelated. Therefore, conventional correlation analysis looking at linear associations between two chosen metabolic measures is only able to give a limited view on the interactions or may even completely fail to identify non-linear multi-metabolic phenomena.
We have recently introduced a methodology, based on self-organizing maps, to characterize lipoprotein phenotypes and multi-metabolic interrelationships (Citation11). The self-organizing map (SOM) is an unsupervised pattern recognition technique (Citation12) that organizes the input data according to given similarity criteria. The end-result is a two-dimensional map, where mutually similar input data profiles are placed next to each other and on which all the measures can be easily visualized, compared, and statistically evaluated (Citation13). This new data-driven holistic approach was also chosen here to obtain a comprehensive view on the metabolic interrelationships between lipoprotein metabolism, adiponectin, and alcohol intake.
Subjects and methods
Subjects and blood samples
All study subjects were men. Heavy alcohol drinkers were recruited from subjects admitted as inpatients for withdrawal therapy at the Alcoholism Treatment Unit of Oulu, Finland. Low-to-moderate drinkers were recruited mainly based on the population register of the Oulu area with inclusion criteria of 20–65 years or from the employees of the Stora Enso company (produces paper and wood products). The Ethical Committee of the Northern Ostrobothnia Hospital District, Oulu, Finland approved the study in accordance with the Declaration of Helsinki. Written informed consent was obtained from all the subjects. The exclusion criteria for the study were previous pancreatitis or hepatitis, or aspartate aminotransferase (AST) to alanine aminotransferase (ALT) ratio > 2 (Citation14). According to these criteria 13 heavy alcohol drinkers and 2 low-to-moderate drinkers were excluded from the study. In addition, one low-to-moderate drinker with a previous history of alcohol abuse was excluded. A total of 80 heavy alcohol drinkers and 83 low-to-moderate drinkers were included in the study.
Alcohol intake of the study subjects during the previous 14 days was documented by interviews and expressed as grams of pure alcohol per day. Seventeen (21%) of the low-to-moderate drinkers were either teetotalers or had not used any alcohol during the previous two weeks. Eighteen (22%) of the low-to-moderate drinkers and 62 (78%) of the heavy drinkers were smokers. Three of the 80 (3.8%) heavy alcohol drinkers and 6 of the 83 (7.2%) low-to-moderate drinkers had diabetes. None of the low-to-moderate drinkers and only two of the heavy drinkers had used illicit drugs during the previous two weeks.
Blood samples were taken after an overnight fast. Plasma or serum samples were obtained by centrifugation at 1500 × g for 15 min at + 4°C. Clinical variables for liver and renal function were analyzed in the Laboratory of the Oulu University Hospital by standard methods. Detailed clinical characteristics of the study subjects are shown in .
Table I. Clinical characteristics of the study subjects.
Analysis of plasma lipid and lipoprotein concentrations and determination of metabolic syndrome
Lipoproteins were isolated from plasma by sequential ultracentrifugation using density ranges of < 1.006 g/mL for very-low-density lipoprotein (VLDL), 1.006–1.019 g/mL for intermediate-density lipoprotein (IDL), 1.019–1.063 g/mL for low-density lipoprotein (LDL), and 1.063–1.210 g/mL for HDL (Citation15,Citation16). The concentrations of plasma total cholesterol and triglycerides (TG) as well as total cholesterol, free cholesterol (FC), TG, phospholipids (PL), and proteins in the isolated lipoprotein fractions were determined as described previously (Citation15,Citation16). The concentrations of cholesteryl esters (CE) were calculated as total cholesterol minus FC. Lipoprotein concentrations were expressed as mmol/L in plasma for lipids and mg/dL for proteins. The loss of lipoproteins in the ultracentrifugation procedure was corrected as described previously (Citation17). The prevalence of metabolic syndrome (MetS) was calculated according to NCEP ATP III criteria (Citation18).
Analysis of adiponectin, CDT, hsCRP, and CETP
Plasma cholesteryl ester transfer protein (CETP) activity was measured as described previously (Citation19,Citation20). High-sensitivity C-reactive protein (hsCRP) and the amount of carbohydrate-deficient transferrin (CDT) in proportion to total transferrin were determined in serum samples by immunonephelometric methods. Plasma adiponectin concentration was measured by ELISA using a kit from Millipore (Billerica, MA, USA) with wavelengths of 450 nm and 650 nm.
Estimation of diameters of lipoprotein particles
Diameters of lipoprotein particles were estimated as described earlier (Citation21). Briefly, the numbers of various lipid molecules in the lipoprotein particles were calculated based on their measured amounts including the total protein measurements. The total volumes of the lipoprotein particles were obtained by summing the volumes of all the lipid and protein molecules. The diameter of each lipoprotein particle was estimated assuming a spherical shape.
Basic statistical analysis
The IBM SPSS statistical software (version 19) (SPSS Inc., Chicago, IL, USA) was used for the statistical analyses. Normal distribution was checked by one-sample Kolmogorov–Smirnov test or by looking at histograms of parameters. For normally distributed variables, the statistical significance between the heavy alcohol drinkers and the low-to-moderate drinkers was assessed by Student's t test. The Mann–Whitney U test was used to assess the statistical significance when data were not normally distributed. The statistical significance between the heavy alcohol and the low-to-moderate drinkers in adiponectin concentration was analyzed by ANCOVA with adjustment for logarithmically transformed BMI and in the distribution of metabolic syndrome by Pearson's chi-square test. Data are expressed as mean with 95% confidence interval (CI) or as median with interquartile range (IR). P values ≤ 0.05 were considered statistically significant.
Self-organizing map analysis
The SOM analysis was performed as described earlier (Citation11). Briefly, the map is organized in the space of the input variables by an unsupervised algorithm, placing individuals with similar input variable profiles close to each other on the map and individuals with dissimilar profiles being placed far away from each other (Citation12). Here, the SOM input variables were the lipoprotein (VLDL, IDL, LDL, and HDL) plasma concentration values for TG, PL, FC, and CE and lipoprotein compositional variables expressed for all lipoproteins as lipoprotein lipids (TG, PL, FC, and CE) per total protein (mmol/g). This yielded in total 32 input variables: 16 concentration as well as 16 compositional measures. In the organized SOM, each individual is assigned a best-matching map unit that represents the most similar model for the individual's profile, i.e. a so-called model individual (Citation11). A map unit can hold multiple individuals, and the map aims to represent a holistic generalization of the entire input data set. A pseudo-colored component plane illustrating the distribution of a variable on the map can be drawn for each of the input variables. The component planes are directly comparable, since they all visualize the same self-organized map with exactly the same distribution of the individuals.
Previously, we have also developed a way for visualizing variables that are not used to organize the map (Citation22). Following the SOM training, the best-matching unit locations of each individual are used to tie these variables to the map, and based on this a smoothed component plane is computed. This also allows calculation of the statistical dependence of these variable distributions on the map; a low P value from the statistical test implies a significant organization of the variable (with the given inputs) that would be improbable to arise by chance. The dynamic range of the component plane colors is also determined by this process, enabling fast visual comparison of the planes; bright colors indicate higher statistical significance than pale colors. Statistical significance of the dependencies between the input variables were determined by training multiple self-organizing maps, one for each input, by removing the corresponding input from the training set (denoted by q values to clarify the difference to P values). In some cases multiple inputs were removed from the training set due to their inherent dependence on the interrogated variable (e.g. HDL-C versus HDL-FC and HDL-CE). The P and q values were not adjusted for multiple hypothesis testing.
A Gaussian neighborhood function with a radius of 1.18 and a hexagonal map grid of size 5 × 7 was used in the SOM algorithm. Each input variable was rank-transformed prior to the map training. The significance calculations were based on 10,000 simulations. The SOM implementation in the Melikerion software package for Matlab/Octave was used (this in-house software is freely available online at www.computationalmedicine.fi/software) (Citation22).
Results and discussion
The SOM analysis based on the lipoprotein concentration and composition measures revealed a distinct metabolic grouping of the study subjects. Generally, individuals with high alcohol intake are located in the eastern region and those with low-to-moderate alcohol intake in the western region of the SOM (). Thus, alcohol consumption is clearly associated with different lipoprotein characteristics. The main results of the SOM analysis are illustrated in , and an overall metabolic summary is given in . Each individual is located exactly in the same place in each of the SOM component planes, allowing direct comparisons of the planes in all the Figures. Since VLDL-TG, IDL-C, LDL-C, and HDL-C concentrations give a good estimate for the concentrations of these lipoprotein fractions in plasma, the other fraction-specific lipid concentrations are shown in Supplementary Figure 1 available online at http://www.informahealthcare.com/abs/doi/10.3109/15622975.2011.611529.
Figure 1. Self-organizing map (SOM) component planes of alcohol consumption, plasma adiponectin concentration, variables related to lipoprotein metabolism and to the metabolic syndrome and its components (details in Subjects and methods, Analysis of plasma lipid and lipoprotein concentrations and determination of the metabolic syndrome). Colorings from reddish through white to bluish denote whether the value of the variable is above (red) or below (blue) the average level of the variable (white). The maps were organized according to plasma concentrations of lipoprotein lipids and the composition of lipoprotein particles (for details see Subjects and methods, Self-organizing map analysis). The numbers in the hexagonal units of the SOM planes denote the mean value of the variable in this particular unit. (CETP = plasma cholesteryl ester transfer protein; C = cholesterol; TG = triglycerides; VLDL, IDL, LDL, and HDL = very-low-, intermediate-, low-, and high-density lipoproteins, respectively; BMI = body mass index; MetS = the metabolic syndrome; BP = blood pressure).
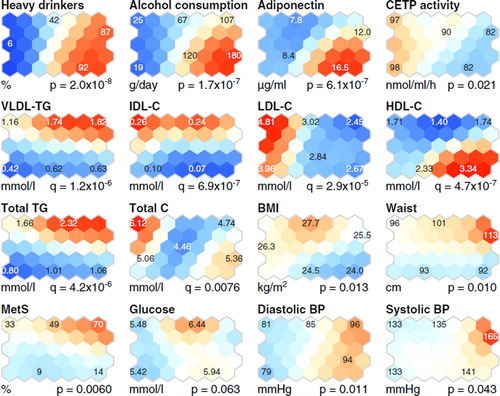
Figure 2. Self-organizing map (SOM) component planes of the in-silico characterization of lipoprotein particles (Citation11). Four lipid concentration measures per lipoprotein fraction were determined, namely triglycerides (TG), phospholipids (PL), free cholesterol (FC), and cholesterolesters (CE), and the corresponding compositional measures (marked with an asterisk) were calculated by scaling the concentration measures with the measured total protein amount in each fraction. Also estimated particle diameters are shown (Citation21). Allother details are as given in the caption for .
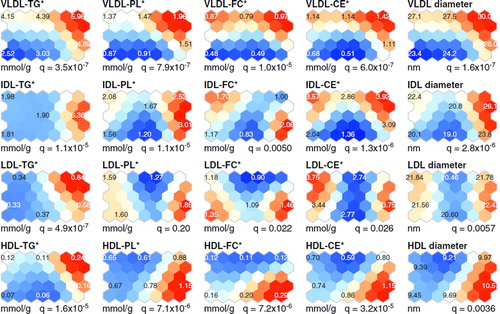
Figure 3. Selected clinical characteristics of the study subjects in the self-organizing map (SOM) analysis. (CDT = percentage of carbohydrate-deficient transferrin from total transferrin; ALT = alanine aminotransferase activity; ALP = alkaline phosphatase activity; AST = aspartate aminotransferase activity; GT = γ-glutamyltransferase activity; hsCRP = high-sensitivity C-reactive protein. All other details are as given in the caption for ).
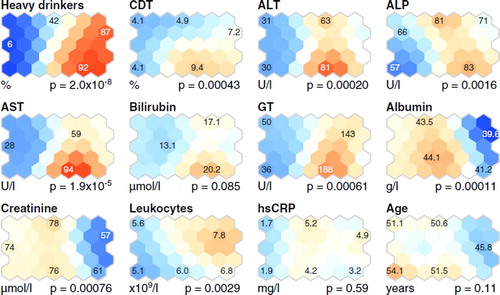
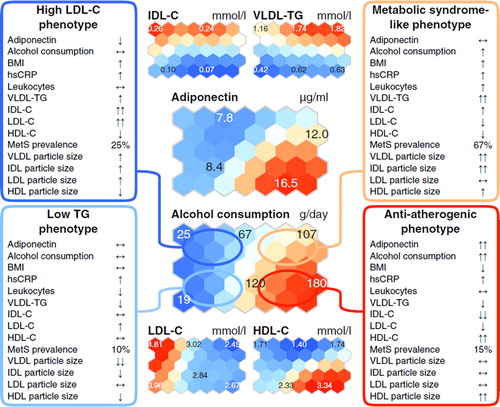
Figure 4. Summary of the metabolic and clinical characteristics in the study population of 80 heavy alcohol drinkers and 83 low-tomoderate drinkers (). The overall metabolic characteristics of the phenotypes, arisen from the SOM analysis of the lipoprotein data per se (for details see Subjects and methods, Self-organizing map analysis), are summarized within the boxes. Two downward (one downward, one upward, two upward) arrows indicate that the mean value for the group of individuals lies within the lowest (second lowest, second highest, highest) 20% of the values of all the individuals. Mean values that lie within the 20% of values around the median are indicated with horizontal arrows. All other details are as given in the caption for .
Clinical characteristics of the study subjects
Heavy alcohol intake was associated with elevated levels of CDT and high liver enzyme activities (AST, ALT, alkaline phosphatase, and γ-glutamyltransferase) (, and the south-east–eastern region of the SOM, ), in line with previous studies (Citation23). The blood leukocyte count was also high in most alcohol-addicted subjects (the north-east region of the SOM, ), as expected (Citation24). Albumin and creatinine concentrations were slightly decreased in the heavy alcohol drinkers, and bilirubin did not differ between the study subjects (, and the eastern region of the SOM, ). Plasma total cholesterol and glucose concentration did not differ between the subjects, but the heavy alcohol drinkers had lower plasma IDL-C and LDL-C than the low-to-moderate drinkers (). For the HDL-C the situation was the opposite (). Age did not differ between the heavy alcohol drinkers and the low-to-moderate drinkers, but body mass index was lower in the heavy than in the low-to-moderate drinkers (, and ). Serum hsCRP concentration was higher in the heavy than in the low-to-moderate drinkers () but did not differ in the SOM analysis ().
Heavy alcohol intake is associated with high plasma adiponectin concentration
Subjects with chronic alcohol abuse have been reported to have elevated serum adiponectin concentrations that decline during alcohol withdrawal (Citation10,Citation25). In the present study, alcohol-addicted subjects had higher plasma adiponectin concentrations than the low-to-moderate drinkers (), and the subjects with the highest alcohol consumption had the highest adiponectin concentrations (, the south-east corner of the SOM). However, the SOM analysis revealed also some heavy drinkers who had relatively low plasma adiponectin concentrations (, the north-east region of the SOM).
Heavy drinkers with high adiponectin levels had high plasma concentrations of HDL-C and low concentrations of apoB-containing lipoproteins, while heavy drinkers with lower adiponectin concentration had low HDL-C and high plasma TG and VLDL-TG concentrations. These results are in agreement with previous studies in non-alcoholic subjects, since adiponectin is positively correlated with HDL-C concentration (Citation3,Citation26) and negatively with plasma TG levels (Citation27). In addition, reduced adiponectin has been linked to reduced catabolism of apoB-containing lipoproteins (Citation27).
Low CETP activity with heavy alcohol consumption is associated with two different HDL particle compositions
One of the key physiological functions of CETP is the equimolar heteroexchange of CE from HDL particles to TG from apoB-containing lipoprotein particles (Citation28). In the present study, low plasma CETP activity was coherently related to high alcohol intake (), as previously described (Citation1,Citation16). Interestingly, two different HDL particle compositions were detected in the heavy drinkers. Heavy drinkers with high HDL-C concentration had CE-enriched and relatively TG-poor HDL particles (the south-east region of the SOM, and ), in accordance with previous studies showing that low CETP activity is linked to high concentrations of HDL-C (Citation29) and CE-rich and TG-poor HDL particles (Citation29). In contrast, heavy drinkers with low HDL-C concentration had HDL particles that were TG-enriched and relatively CE-poor (the north-east region of the SOM, and ). A likely rationale for these findings is that the subjects with low HDL-C have high plasma concentration of VLDL-TG (), with enlarged TG-enriched VLDL particles (), and thereby CETP action promotes the TG-enrichment of HDL (Citation30).
The overall metabolic picture
The results from the lipoprotein-based SOM analysis of the study subjects and the associations of the metabolic variables in this context can be evaluated through four characteristic metabolic profiles as presented in . As expected (Citation2), heavy alcohol drinkers differ from low-to-moderate drinkers based on plasma LDL-C levels (). Thus, the heavy drinkers quite clearly separate to the eastern part of the SOM, characterized with the lowest LDL-C concentrations in the study population, and the low-to-moderate drinkers to the opposite side of the SOM, characterized with the highest LDL-C ( and ). However, with respect to the majority of other lipoprotein lipid measures, the heavy drinkers separate to two distinct phenotypes, namely a favorable lipoprotein phenotype (e.g. low apoB and high HDL) and a phenotype with features typical to the metabolic syndrome (high TG and IDL combined with low HDL). Notably, the latter phenotype was characterized by the highest prevalence of MetS ( and ).
Heavy drinkers with high HDL-C and low LDL-C as well as PL-enriched large HDL particles have a favorable lipoprotein phenotype linked to decreased CHD risk (Citation4,Citation16,Citation31). This phenotype was also related to the highest concentrations of adiponectin, in line with a recent study that demonstrates the association of adiponectin with favorable lipoprotein profile (Citation3). Notably, LDL particles in this phenotype were less TG-enriched than those in the metabolic syndrome-like phenotype, in which, in addition to LDL, also VLDL and HDL particles were enriched in TG (the south-east and north-east areas of the SOM, respectively, in and ). The TG-enrichment of lipoprotein particles is known to relate to the metabolic syndrome (Citation32) and is considered pro-atherogenic, as these kinds of particles may possess functional abnormalities as well as alter cholesterol delivery and removal pathways (Citation33). These features typical to the metabolic syndrome are also related to lower plasma adiponectin concentration than detected in the heavy drinkers with low prevalence of MetS. Recent studies have shown that heavy alcohol consumption can also relate to the metabolic syndrome (Citation34,Citation35). In the present study two characteristic phenotypes were found for the heavy alcohol drinkers: one with high prevalence of metabolic syndrome and its components (e.g. high waist circumference, high blood pressure, low HDL-C, and elevated triglycerides) (, the north-east region of the SOM) and the other with low prevalence of metabolic syndrome and lipoprotein characteristics associated with decreased CHD risk.
The low-to-moderate drinkers in this study population were typically characterized with higher plasma LDL-C concentrations than the heavy drinkers (). However, clear phenotypic differences are seen in the VLDL-TG and IDL-C concentrations ( and ). There are indications that IDL associates with the progression of atherosclerosis better than LDL or VLDL (Citation36); thereby, for the low-to-moderate drinkers, the phenotype related to the north-west corner in the SOM represents a more unfavorable lipoprotein phenotype than that in the south-west corner (). In line with an unfavorable lipoprotein profile, the prevalence of metabolic syndrome is also higher in the north-west region of the SOM than in the south-west region ().
In conclusion, the SOM analysis enabled a holistic combination of plasma lipoprotein concentrations and the corresponding compositional features of the particles. Complex associations between lipoprotein metabolism, adiponectin, and alcohol intake were revealed, and distinct lipoprotein phenotypes were discovered with respect to alcohol consumption. The two distinctive lipoprotein phenotypes for the heavy alcohol drinkers were an anti-atherogenic phenotype (large PL-enriched and TG-poor HDL particles, high HDL-C, and low VLDL-TG and IDL-C) associated with high adiponectin and a phenotype with opposite lipoprotein characteristics (TG-enriched lipoprotein particles, low HDL-C, and high VLDL-TG) with relatively low adiponectin and high prevalence of MetS. These and other metabolic issues arose from the SOM analysis of the lipoprotein data per se, clearly illustrating the potential of data-driven holistic analysis in identifying complex metabolic phenomena. We believe it would be beneficial to address explicitly this complexity in future studies. Clinically, it is notable that although the heavy alcohol drinkers are likely to have rather low plasma LDL-C concentrations, their HDL-C and TG levels as well as lipoprotein particle compositions may vary considerably, indicating that their individual risk for lipid-related metabolic disturbances may also differ significantly.
http://www.informahealthcare.com/abs/doi/10.3109/07853890.2011.611529
Download PDF (261.4 KB)Declaration of interest: The authors state no conflict of interest and have received no payment in preparation of this manuscript.
Acknowledgements
We thank Sari Pyrhönen, Marja-Leena Kytökangas, and Saara Korhonen for their skillful technical assistance and the staff of the Alcoholism Treatment Unit of Oulu for their valuable help. In addition, all the study subjects are warmly thanked. This study received funding from the Aarne Koskelo Foundation (M.L.H.), the Academy of Finland research funding (M.J.S.), the Academy of Finland's Responding to Public Health Challenges Research Programme (SALVE) (M.J.S., M.A.K.), the Finnish Cardiovascular Research Foundation (S.M.K., M.J.S., M.L.H., M.A.K.), the Finnish Cultural Foundation (S.M.K., V.P.M.), the Finnish Foundation for Alcohol Studies (M.J.S.), the Jenny and Antti Wihuri Foundation (S.M.K., V.P.M.), the Maud Kuistila Memorial Foundation (S.M.K.), the North Ostrobothnia Regional Fund of the Finnish Cultural Foundation (M.L.H.), the Orion-Farmos Research Foundation (S.M.K.), the Paavo Nurmi Foundation (M.L.H.), and the Sigrid Jusélius Foundation (S.M.K., M.J.S., M.L.H.).
References
- Hannuksela ML, Rämet ME, Nissinen AET, Liisanantti MK, Savolainen MJ. Effects of ethanol on lipids and atherosclerosis. Pathophysiology. 2004;10:93–103.
- Matsuura F, Oku H, Koseki M, Sandoval JC, Yuasa-Kawase M, Tsubakio-Yamamoto K, . Adiponectin accelerates reverse cholesterol transport by increasing high density lipoprotein assembly in the liver. Biochem Biophys Res Commun. 2007;358:1091–5.
- Magge SN, Stettler N, Koren D, Levitt Katz LE, Gallagher PR, Mohler ER 3rd, . Adiponectin is associated with favorable lipoprotein profile, independent of BMI and insulin resistance, in adolescents. J Clin Endocrinol Metab. 2011;96:1549–54.
- Lin Y, Mousa S, Elshourbagy N, Mousa S. Current status and future directions in lipid management: emphasizing low-density lipoproteins, high-density lipoproteins, and triglycerides as targets for therapy. Vasc Health Risk Manag. 2010;6:73–85.
- Rana JS, Arsenault BJ, Després J, Côté M, Talmud PJ, Ninio E, . Inflammatory biomarkers, physical activity, waist circumference, and risk of future coronary heart disease in healthy men and women. Eur Heart J. 2011;32:336–44.
- Kizer JR, Barzilay JI, Kuller LH, Gottdiener JS. Adiponectin and risk of coronary heart disease in older men and women. J Clin Endocrinol Metab. 2008;93:3357–64.
- Karakas M, Zierer A, Herder C, Baumert J, Meisinger C, Koenig W, . Leptin, adiponectin, their ratio and risk of coronary heart disease: results from the MONICA/KORA Augsburg Study 1984–2002. Atherosclerosis. 2010;209: 220–5.
- Sattar N, Wannamethee G, Sarwar N, Tchernova J, Cherry L, Wallace AM, . Adiponectin and coronary heart disease: a prospective study and meta-analysis. Circulation. 2006; 114:623–9.
- Beulens JWJ, van Loon LJC, Kok FJ, Pelsers M, Bobbert T, Spranger J, . The effect of moderate alcohol consumption on adiponectin oligomers and muscle oxidative capacity: a human intervention study. Diabetologia. 2007;50: 1388–92.
- Buechler C, Schäffler A, Johann M, Neumeier M, Köhl P, Weiss T, . Elevated adiponectin serum levels in patients with chronic alcohol abuse rapidly decline during alcohol withdrawal. J Gastroenterol Hepatol. 2009;24:558–63.
- Kumpula LS, Mäkelä SM, Mäkinen V, Karjalainen A, Liinamaa JM, Kaski K, . Characterization of metabolic interrelationships and in silico phenotyping of lipoprotein particles using self-organizing maps. J Lipid Res. 2010;51:431–9.
- Kohonen T. Self-organizing maps. Berlin: Springer; 2001.
- Hyvönen MT, Hiltunen Y, El-Deredy W, Ojala T, Vaara J, Kovanen PT, . Application of self-organizing maps in conformational analysis of lipids. J Am Chem Soc. 2001;123: 810–6.
- Hannuksela ML, Liisanantti MK, Nissinen AET, Savolainen MJ. Biochemical markers of alcoholism. Clin Chem Lab Med. 2007;45:953–61.
- Liinamaa MJ, Kervinen K, Hannuksela ML, Kesäniemi YA, Savolainen MJ. Effect of apolipoprotein E phenotype on plasma lipids and lipoproteins in alcohol abusers. Alcohol Clin Exp Res. 1997;21:606–12.
- Mäkelä SM, Jauhiainen M, Ala-Korpela M, Metso J, Lehto TM, Savolainen MJ, . HDL2 of heavy alcohol drinkers enhances cholesterol efflux from raw macrophages via phospholipid-rich HDL 2b particles. Alcohol Clin Exp Res. 2008;32:991–1000.
- Niemi J, Mäkinen V, Heikkonen J, Tenkanen L, Hiltunen Y, Hannuksela ML, . Estimation of VLDL, IDL, LDL, HDL2, apoA-I, and apoB from the Friedewald inputs-apoB and IDL, but not LDL, are associated with mortality in type 1 diabetes. Ann Med. 2009;41:451–61.
- Grundy SM, Brewer HBJ, Cleeman JI, Smith SCJ, Lenfant C. Definition of metabolic syndrome: report of the National Heart, Lung, and Blood Institute/American Heart Association conference on scientific issues related to definition. Arterioscler Thromb Vasc Biol. 2004;24:e13–18.
- Groener JE, Pelton RW, Kostner GM. Improved estimation of cholesteryl ester transfer/exchange activity in serum or plasma. Clin Chem. 1986;32:283–6.
- Hannuksela M, Marcel YL, Kesäniemi YA, Savolainen MJ. Reduction in the concentration and activity of plasma cholesteryl ester transfer protein by alcohol. J Lipid Res. 1992;33:737–44.
- Kumpula LS, Kumpula JM, Taskinen M, Jauhiainen M, Kaski K, Ala-Korpela M. Reconsideration of hydrophobic lipid distributions in lipoprotein particles. Chem Phys Lipids. 2008;155:57–62.
- Mäkinen V, Forsblom C, Thorn LM, Wadén J, Gordin D, Heikkilä O, . Metabolic phenotypes, vascular complications, and premature deaths in a population of 4,197 patients with type 1 diabetes. Diabetes. 2008;57:2480–7.
- Liinamaa MJ, Hannuksela ML, Kesäniemi YA, Savolainen MJ. Altered transfer of cholesteryl esters and phospholipids in plasma from alcohol abusers. Arterioscler Thromb Vasc Biol. 1997;17:2940–7.
- Nakanishi N, Yoshida H, Okamoto M, Matsuo Y, Suzuki K, Tatara K. Association of alcohol consumption with white blood cell count: a study of Japanese male office workers. J Intern Med. 2003;253:367–74.
- Hillemacher T, Weinland C, Heberlein A, Gröschl M, Schanze A, Frieling H, . Increased levels of adiponectin and resistin in alcohol dependence -possible link to craving. Drug Alcohol Depend. 2009;99:333–7.
- Ryo M, Nakamura T, Kihara S, Kumada M, Shibazaki S, Takahashi M, . Adiponectin as a biomarker of the metabolic syndrome. Circ J. 2004;68:975–81.
- Das S, Shahmanesh M, Stolinski M, Shojaee-Moradie F, Jefferson W, Jackson NC, . In treatment-naïve and antiretroviral-treated subjects with HIV, reduced plasma adiponectin is associated with a reduced fractional clearance rate of VLDL, IDL and LDL apolipoprotein B-100. Diabetologia. 2006;49:538–42.
- Qiu X, Mistry A, Ammirati MJ, Chrunyk BA, Clark RW, Cong Y, . Crystal structure of cholesteryl ester transfer protein reveals a long tunnel and four bound lipid molecules. Nat Struct Mol Biol. 2007;14:106–13.
- Matsuura F, Wang N, Chen W, Jiang X, Tall AR. HDL from CETP-deficient subjects shows enhanced ability to promote cholesterol efflux from macrophages in an apoE- and ABCG1-dependent pathway. J Clin Invest. 2006;116:1435–42.
- Castle CK, Kuiper SL, Blake WL, Paigen B, Marotti KR, Melchior GW. Remodeling of the HDL in NIDDM: a fundamental role for cholesteryl ester transfer protein. Am J Physiol. 1998;274:E1091–8.
- Asztalos BF, Collins D, Cupples LA, Demissie S, Horvath KV, Bloomfield HE, . Value of high-density lipoprotein (HDL) subpopulations in predicting recurrent cardiovascular events in the Veterans Affairs HDL Intervention Trial. Arterioscler Thromb Vasc Biol. 2005;25: 2185–91.
- de Souza JA, Vindis C, Hansel B, Nègre-Salvayre A, Therond P, Serrano CV, . Metabolic syndrome features small, apolipoprotein A-I-poor, triglyceride-rich HDL3 particles with defective anti-apoptotic activity. Atherosclerosis. 2008; 197:84–94.
- Skeggs JW, Morton RE. LDL and HDL enriched in triglyceride promote abnormal cholesterol transport. J Lipid Res. 2002;43:1264–74.
- Jarvis CM, Hayman LL, Braun LT, Schwertz DW, Ferrans CE, Piano MR. Cardiovascular risk factors and metabolic syndrome in alcohol- and nicotine-dependent men and women. J Cardiovasc Nurs. 2007;22:429–35.
- Baik I, Shin C. Prospective study of alcohol consum- ption and metabolic syndrome. Am J Clin Nutr. 2008;87: 1455–63.
- Hodis HN, Mack WJ, Dunn M, Liu C, Liu C, Selzer RH, . Intermediate-density lipoproteins and progression of carotid arterial wall intima-media thickness. Circulation. 1997;95:2022–6.