Abstract
Background. Dysfunction of adipose tissue is one of the major factors leading to insulin resistance. Altered adipokine concentration is an early sign of adipose tissue dysfunction. The aim of this study was to assess the impact of exercise intervention on adipokine profile, glycemic control, and risk factors of the metabolic syndrome (MeS) in men with impaired glucose regulation (IGR).
Methods. Overweight and obese men with IGR (n =144) aged 40–65 years were studied at baseline and at 12 weeks in a randomized controlled multicenter intervention study. BMI varied from 25.1 to 34.9. The subjects were randomized into one of three groups: 1) a control group (C; n =47), 2) a Nordic walking group (NW; n =48), or 3) a resistance training group (RT; n =49).
Results. Leptin concentrations decreased in the NW group compared to both other groups. Both types of exercise intervention significantly decreased serum chemerin concentrations compared to the C group. In the NW group also body fat percentage, fatty liver index (FLI), and total and LDL cholesterol concentrations decreased compared to the RT group.
Conclusions. Nordic walking intervention seems to decrease chemerin and leptin levels, and subjects in this intervention group achieved the most beneficial effects on components of MeS.
Key messages
Nordic walking intervention has positive effects on aerobic performance capacity, body composition, FLI index, and lipid profile without dietary modification.
Nordic walking intervention can be easily implemented. There is no evidence about acute or overuse sports injuries induced by supervised Nordic walking training.
Introduction
Altered adipokine serum concentration is an early sign of adipose tissue dysfunction which is one of the primary defects in obesity and may link it to an increased risk of type 2 diabetes (T2D), fatty liver, and cardiovascular disease (Citation1). In T2D subjects, elevated concentrations have been reported of various adipokines including chemerin, leptin, retinol-binding protein 4 (RBP4), and cytokines including interleukin 6 (IL-6) and tumor necrosis factor alpha (TNF-α), as well as elevated high-sensitivity CRP (Citation1–4). During exercise IL-6 increases glucose uptake (Citation5), but sustained high levels of IL-6 can be an indicator of low-grade inflammation and subsequently insulin resistance (Citation6).
Increased blood leptin concentrations have been found both in obese subjects with T2D and obese subjects without diabetes compared to healthy lean controls (Citation7). Decreased adiponectin and increased chemerin and RBP4 are already detectable in prediabetic states (Citation1,Citation8). Tönjes et al. (Citation1) found that serum chemerin and RBP4 were significantly higher in T2D subjects than in subjects having impaired fasting glucose (IFG), but there was no difference in the corresponding values between T2D subjects and subjects having impaired glucose tolerance (IGT).
Expression of chemerin has been found in a number of tissues, e.g. in liver, pancreas, lung, and adipose tissues (Citation9). Chemerin induces insulin resistance in adipocytes and skeletal muscle cells in vitro (Citation10). It is also associated with several components of the metabolic syndrome like body mass index (BMI), high-density lipoprotein (HDL)-cholesterol, hypertension, and triglycerides (TG) (Citation11,Citation12). Yang and co-workers (Citation13) showed by using multiple regression analysis that waist circumference, diastolic blood pressure, 2-hour plasma insulin during an oral glucose tolerance test (OGTT), and glycated hemoglobin (HbA1c) were independently related variables reflecting plasma chemerin levels. Serum chemerin and leptin concentrations are also increased in patients having non-alcoholic fatty liver disease (NAFLD) (Citation9,Citation14).
Physical exercise is known to decrease adipokine release from fat tissue and cytokine release from skeletal muscles, endothelial cells, and immune system (Citation4) and to reduce risk of cardiovascular diseases, metabolic syndrome, and type 2 diabetes (Citation15).
In type 2 diabetes, aerobic and resistance exercise have different effects on adipokines (Citation4). High-intensity resistance training has been found to reduce TNF-α concentrations (Citation16), whereas aerobic exercise has not modified TNF-α (Citation17), though physical exercise usually reduces inflammation markers (Citation18,Citation19). Data obtained from some other studies suggest that physical activity is not associated with a reduction in inflammation markers (Citation20,Citation21). Because of inconsistence in the physiological effects of physical activity or various types of exercise training, more knowledge of their regulatory effects on adipokine and cytokine metabolism as well as their importance for glucose homeostasis is needed, especially among subjects having impaired glucose regulation (IGR). In particular, the role in glucose regulation of the newly discovered adipokine, chemerin, needs to be studied.
The primary aims of this study were to determine whether aerobic and/or resistance exercise training without dietary-induced weight loss improves impaired glucose regulation, the components of metabolic syndrome, and markers of low-grade inflammation in middle-aged men with IGR. The hypothesis was that the supervised exercise could have positive effects on adipokine patterns, glycemic control, and risk factors for the metabolic syndrome (MeS) in middle-aged men with IGR.
Material and methods
Study subjects
Overweight or obese male volunteers (40–65 years) who did not exercise regularly and who were interested in participating the study and eligible to screening (n =313) were recruited through newspaper advertisements and advertisements in local occupational health care institutes in both Helsinki and Turku. After a telephone interview, 267 of them were recruited to participate in the screening tests.
Their health status and suitability for the study were checked by a health and lifestyle questionnaire, physical examinations, and a 75 g OGTT. Inclusion criteria were male sex, age 40–65 years, BMI 25.1–34.9, and fasting plasma glucose 5.6–6.9 mmol/L and/or 2-hour plasma glucose 7.8–11.0 mmol/L. Exclusion criteria were earlier detection of IGT and engagement in prescribed diet or exercise programs, engagements in regular and physically very vigorous activities, and usage of medication affecting glucose balance (e.g. peroral corticosteroid medication). Use of medication affecting serum lipids and hypertension were allowed, and there was no difference between groups ().
Table I. Baseline characteristics of middle-aged men with impaired glucose regulation in three randomized groups. Data are given as means (SD).
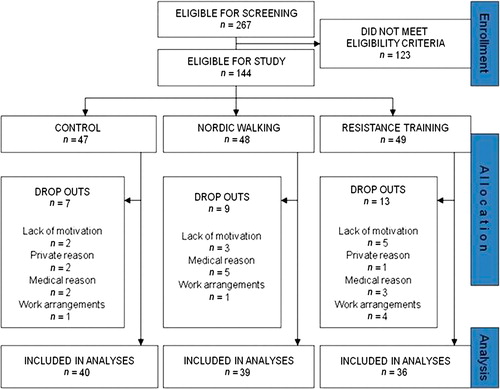
Finally, 144 volunteers were eligible for the study (Trial no: ISRCTN97931118). They were equally randomized into one of three groups both in Helsinki and in Turku: 1) a control group (C group; n =47), 2) a Nordic walking group (NW group; n = 48), or 3) a resistance training group (RT group; n =49). During the intervention period, some of the subjects dropped out due to private or medical reasons or difficulties in work arrangements and eventually some also due to lack of or deteriorating motivation. As a result, 115 subjects received intervention as assigned (). The characteristics of the subjects are shown in . There was no difference in smoking habits after multiple comparisons. According to answers on health and lifestyle questions, no differences in work-load or physical activity levels during the past year before the study were observed between the three groups. The Ethical Committee of the Hospital District of Helsinki and Uusimaa in Finland approved the protocol of the study, and all the study subjects gave written informed consent.
Figure 1. Flow chart of the subjects who received intervention as assigned and included in the analyses.
The minimum sample size was determined with analysis of variance test (StatTools software). Our aim was to have 80% power to detect a difference of 0.2 mmol/L in mean fasting glucose between the two intervention groups and the control group, using a significance level of 0.05. Assuming that the mean difference is 0.2 mmol/L and standard deviation is 0.3, the number of subjects required to achieve this difference having the mentioned statistical power is 34 persons in each group.
Applying the same minimum sample size to chemerin concentrations would correspond to a mean difference of 8 μg/mL and SD 12, and in relation to leptin a mean difference of 4 μg/mL and SD 6.
Intervention
Participants were advised not to change their habitual diet or their other lifestyle habits during the intervention. If they had been physically active during their leisure time, they were asked to continue these habits. The aim of the intervention program was to be an additional, not compensatory, program, and the time for that should be taken from the inactive leisure time.
The control group, that had no supervised exercise during the intervention period, was advised, however, about the health benefits of exercise during the first test day. Both intervention groups trained three times per week for 60 minutes per session during 12 weeks according to special exercise programs in which both the exercise intensity and load were increased so that the strain of the subjects was progressively increased after every 4 weeks of training. Training sessions were supervised by at least by two physical education instructors.
The programs in the Nordic walking group consisted of warm-up exercises including walking for 5 minutes and stretching of main muscle groups in addition to walking with poles. The programs were individually designed in detail, but they started with learning sessions advising how to walk with walking poles. The aerobic exercise sessions were carried out at strain levels increasing from 55% to 75% of heart rate reserve (weeks 1–4 at 55%, weeks 5–8 at 65%, and weeks 9–12 at 75%). Individual target heart rates were calculated by using measured resting heart rate and the maximal heart rate estimated with the formula 210 – (0.65 × age in years) (Citation22). Heart rate was monitored during training with Polar F4 (Polar Electro Oy, Kempele, Finland) heart rate monitors, and target heart rate range was progressively increased as mentioned. Walking speed was increased, or a degree of uphill was added, so that the intended target heart rate was achieved. After the pole walking, the main muscle groups were stretched for 5 minutes for cool-down.
The resistance training sessions were started with warm-up exercises including cycling or rowing with ergometer for 5 minutes and stretching of main muscle groups. After that the main part of program was performed by using regular resistance equipment, and training focus was on strength and power exercises of the lower extremities and trunk; but also muscles of the upper extremities were trained. Muscle contractions were performed with maximal or high velocity, and external loads were 50%–85% from exercise-specific maximal strength, which was determined by the five-repetition maximum (5RM) test according to the formula [(–4.18 × RM-value of load) + 103] (Citation23). For each subject external loads were individually prescribed, and progression was controlled by 5RM strength measurements during the seventh training week. At the end of every session, subjects cooled down by cycling or rowing with the ergometer for 5 minutes and by stretching the main muscle groups.
Blood samples
Blood samples were drawn after an overnight fast (12 h) from the brachial vein of subjects before the intervention and after the 12-week intervention period. The study subjects were instructed to avoid alcohol, intensive exercise, and painkillers for 2 days before sample collection, and the amount of dietary carbohydrates should be the usual for 3 days before sample collection. Plasma, serum, and glucose tubes were centrifuged at 2200 × g for 10 min.
Physical measurements and clinical analyses
Body composition was determined by a bioimpedance method (Inbody 3.0, Biospace, Seoul, Korea). The subjects were instructed to empty bladder 30 minutes before the measurement. Body weight of barefoot subjects wearing light indoor clothing was recorded to the nearest 0.1 kg by calibrated weighing scales, and total body fat mass, fat-free mass, and fat percentage were calculated from impedance values. Body height was recorded to the nearest 0.5 cm. Waist circumference was measured midway between spina iliaca superior and the lowest rib margin. Blood pressure was measured in duplicate using the automated Omron M4-I device (Omron Healthcare Europe BV, Hoofddorp, The Netherlands) in accordance with standard procedures. Maximum oxygen uptake was estimated with a 2-km UKK walk test. The test was performed on an indoor 200 meter athletic track. The UKK fitness index was used to predict V02max using gender-specific equations (Citation24).
Adiponectin was measured from the plasma samples with Millipore's Human CVD1-kit (HCVD1-67AK) and leptin, TNF-α, as well as IL-6 with a Millipore's Human Serum Adipokine kit (Panel B, HADK2-61K-B) (Millipore, Billerica, MA) using a BioRad Bio-Plex 200 System (Bio-Rad Laboratories, Espoo, Finland) (Citation25). Chemerin and RBP4 were measured from serum samples with Millipore's Human Chemerin kit (EZHCMRN-57K) and Human RBP-4 kit (EZHRBP-4-18K) (Millipore, Billerica, MA) using a Thermo Multiskan (Thermo Clinical Labsystems Oy, Konelab, Finland).
Coefficient of variation for intra-assay replicate samples was less than 6.5% and for inter-assay samples less than 9.0% using ELISA (chemerin and RBP4).
Gamma glutamyltransferase (γ-GT), total cholesterol, HDL cholesterol, low-density lipoprotein (LDL) cholesterol, triacylglycerols, and uric acid were measured from plasma samples by enzymatic photometric methods with commercial kits (Thermo Clinical Labsystems Oy, Espoo, Finland) using a Konelab 20i analyser (Citation25). Plasma glucose was analyzed by enzymatic photometric method using Konelab Glucose HK as reagent. Glycated hemoglobin (HbA1c) and serum hs-CRP based on immunoturbidimetry were analyzed with routine standardized methods using a Konelab 20i analyser (Thermo Clinical Labsystems Oy, Konelab, Finland). Serum insulin was analyzed by chemiluminescence-immunoassay using an Immulite 1000 analyser (Siemens Medical Solutions, Espoo, Finland).
Homeostasis model assessment for insulin resistance (HOMA-IR) was calculated as follows: HOMA-IR = fasting serum insulin (μU/mL) × fasting plasma glucose (mmol/L) / 22.5 (Citation26). Fatty liver index (FLI) was calculated according to the equation of Bedogni et al. (Citation27):

When expe = exponent of e value, triglycerides as (mg/dL), BMI = body mass index as body weight (kg) / body height (m)2, γ-GT = gamma-glutamyltransferase as (U/L), waist circumference as (cm).
Questionnaires and diaries
After being accepted into the study, the subjects filled in a health and lifestyle questionnaire modified from the FINRISK Physical Activity Questionnaire (Citation28). During the whole intervention period, the subjects filled in a diary in which they wrote down all physical activity lasting for 30 min or longer (). Both before, in the middle of (data not shown), and after the intervention period they were asked to keep 3-day food diaries (Citation29,Citation30). Dietary intakes were assessed using a special analysis program developed by the National Public Health Institute (Citation31).
Table II. Exercise activity during the 12-week intervention. All physical activity lasting for 30 min or longer was recorded by the participants. Volunteers were randomized to one of three groups: control group (C), Nordic walking group (NW), or resistance training group (RT).
Statistical analyses
Data have been reported as means ± standard deviations (SD) or standard errors (SE). Because most variables did not distribute normally and also sizes of groups were rather small, the non-parametric Kruskal–Wallis test was used to assess differences between all three groups in variables at baseline and their changes during the intervention period. If statistical significance existed, Mann–Whitney test was used for pair-wise analyses with a Bonferroni adjustment. Difference within group was tested by the Wilcoxon signed-rank or paired t test. The normality of variables was tested by Shapiro–Wilk test. In addition, we applied analysis of covariance (ANCOVA) that was adjusted for baseline values and body fat percentage to compare the change in total cholesterol and LDL cholesterol, chemerin, fatty liver index, and leptin. The variables were rank-transformed for analysis, because of non-normal distribution of the data. Statistical significance was indicated by P <0.05. Statistical analyses were performed with SPSS 17.0.
Results
Characteristics of subjects
Baseline characteristics were similar in the study groups except that the UKK fitness index and carbohydrate intakes ( and ) were lower and BMI was higher in the RT group (P <0.05) than in the C group (). Of the subjects, 93% in the C group, 97% in the NW group, and 92% in the RT group reported exercising 0–3 times/week during their leisure time in the previous year, mostly without accelerated breathing or sweating. In the past year before the intervention they exercised weekly approximately 137 minutes in the C group, 134 minutes in the NW group, and 141 minutes in the RT groups according to answers on health and lifestyle questions. Most of the subjects were working in sedentary occupations (85% in the C group, 87% in the NW group, and 92% in the RT group were sedentary) before and during the intervention period. Those participants who reported working in a physically demanding occupation were working in the construction industry.
Table III. Glucose, fat, and liver metabolisms as well as their regulation at baseline and the changes in variables due to intervention in three randomized groups. Data are given as means (SE). Differences between groups for baseline values and their changes were tested with Kruskal–Wallis test.
Table IV. ANCOVA modela of adipokines, fatty liver index, and lipids for the changes in variables due to intervention.
Attendance for exercise intervention
The overall mean attendance rates were 64% in the NW group and 67% in the RT group. The proportion of participants whose adherence corresponded to ≥ 66.7% attendance rate (2 out of 3) was 49% in the NW and 63% in RT group. For most participants who had low attendance rates, the reasons for their absence were work-related. In some cases (one subject in NW and two subjects in the RT group) illness in the musculoskeletal system, independent of the intervention, affected participation rates (). Five participants (four from the NW group and one from the RT group) were excluded from the analyses because they were not able to practice during the last 5 weeks and/or did not participate in the physical performance test because of asthma (new medication), chronic bronchitis, groin injury, and prolapse in the NW group and vein thrombosis in the RT group.
The amount of endurance-type of exercise was obviously greater in the NW group than in the C and RT groups (P <0.001), and the amount of resistance exercise was greater in the RT group than in the other two groups (P <0.001) during the intervention period (). The exercise frequency and time (data not shown) were similar in both supervised training groups, and total physical activity was the same level in all groups (). The subjects trained for an average of 15.5 ± 0.5 MET-hours (METh × wk-1) in the NW group and for an average of 10.5 ± 0.3 MET-hours (METh × wk-1) in the RT group.
Glucose, lipid, and liver markers
At baseline, fasting insulin (P < 0.01) and HOMA-IR levels (P < 0.05) were higher in the NW and RT groups compared to the C group. Also 2-hour insulin concentrations were higher in the NW group than in the C group (P <0.05), and LDL cholesterol (P <0.05) compared to RT group. The primary variables of glucose metabolism, fasting glucose, 2-hour glucose, insulin, 2-hour insulin, HbA1c, and HOMA-IR, did not change significantly in the NW group or in the RT group compared to the C group (). In the NW group, total cholesterol and LDL cholesterol decreased compared to the RT group during intervention (). After adjusting total cholesterol and LDL cholesterol with baseline values and body fat percentage, a statistically significant difference was found between the NW group and the C and RT groups (). No statistically significant differences in HDL cholesterol or triacylglycerol concentrations were found between groups. Also plasma levels of γ-GT after Bonferroni correction (P = 0.054) and uric acid were unchanged in each group. FLI decreased in the NW group compared to the RT group (P <0.01), although the changes were not significant after Bonferroni correction (P = 0.129) compared to the C group (), but the NW group differed significantly after adjusting FLI with baseline value and body fat percentage from both other groups ().
Regulatory markers
At baseline IL-6 concentrations were higher in the NW group (P <0.01) compared to the C group. Both types of exercise significantly decreased serum chemerin concentrations compared to the control group (P <0.05) (). In addition, plasma leptin concentration decreased in the NW group (P <0.001) (). The difference was similar after the analyses were adjusted for baseline values and body fat percentage in both chemerin and leptin analyses (). No significant changes in the circulating adiponectin, IL-6, RBP4 and TNF-α concentration were found between the groups ().
Fitness, body composition, and blood pressure
During intervention, body fat percentage decreased in the NW group compared to the RT and C groups, and also the UKK fitness index improved compared to the C group (). Weight as well as BMI (data not shown) decreased in the NW group compared to the other groups (). No differences were found in fat-free mass between the groups. Systolic blood pressure (BP) tended to decrease within the NW group (–6.7 ± 1.8 mmHg), but in comparison to the C and RT groups (–2.9 ± 2.0 and –4.1 ± 2.4 mmHg, respectively), it did not reach statistical significance. The decreases in diastolic pressure (–2.7, –2.8, and –3.8 mmHg, respectively) did not differ between the groups ().
. Results for anthropometry, blood pressure and dietary intakes at baseline and the changes in variables due to intervention in three randomised groups. Data is given as means (SD). Differences between groups for baseline values and their changes were tested with Kruskall–Wallis test.
Discussion
The novel finding of this study was that both Nordic walking and resistance training decreased serum chemerin concentrations. Both types of exercise seemed to have regulatory effects on circulating chemerin also, an adipokine which is highly expressed in the adipose tissue and liver (Citation32) and which is also strongly associated with markers of inflammation (hs-CRP, IL-6, and TNF-α) (Citation12). Chemerin has been shown to increase in body tissues and fluids in inflammatory conditions and to regulate adipogenesis and adipocyte metabolism (Citation33). Increased serum chemerin in obesity and T2D seems to be associated with inflammation rather than BMI (Citation34).
Nordic walking caused significant reduction of central obesity; in both exercise groups, waist circumferences were reduced about 2 cm. It is known that during weight loss the size of adipocytes reduces and the secretion of inflammatory cytokines (Citation35) and also of adipokines (Citation36) decreases. Thus, in the NW group one reason behind the reduction of serum chemerin levels could be decreased size of adipocytes (loss of fat mass), which has been found to correlate with the decrease of adipokines (Citation36). On the other hand, plasma adiponectin, IL-6, and TNF-α concentration which also correlate with adipocyte size (Citation37) did not change in any of the groups. However, it has been shown that a small weight loss (4%–5%) decreases leptin levels but not adiponectin, IL-6, or RBP4 levels (Citation38). No group differences were found in the changes of circulating RBP4 concentration. Increased serum RBP4 levels have been found in IGT and T2D subjects (Citation39). Furthermore, it is known that significant weight loss achieved by physical exercise also decreases serum RBP4 levels which predicts improvements in insulin sensitivity (Citation40). In our study there was no difference in insulin sensitivity between groups (McAuley index; data not shown).
A decreased chemerin concentration could be a sign of reduced hepatic insulin resistance (Citation3). Sell and co-workers found increased chemerin concentrations in morbidly obese patients with a significant activity score for NAFLD and other markers of liver pathology (Citation3). They also showed that chemerin decreased most prominently in the first 3 months after bariatric surgery when weight and fat mass loss and improvement of insulin sensitivity and inflammatory markers were strongest, in morbidly obese subjects (Citation3). In our study, HOMA-IR levels, reflecting hepatic insulin resistance (Citation41), were unchanged in all groups. Small but not statistically significant decreases in the HOMA-IR values could be seen in NW and RT groups (–0.48 and –0.33, respectively) but not in the C group (+0.26).
Haus (Citation42) and co-workers recently reported that 12 weeks of aerobic training combined with dietary counseling reduced hepatic insulin resistance under basal and hyperinsulinemic conditions in obese individuals with IGT. Hepatic insulin resistance is typical for IFG subjects, while subjects with IGT also have peripheral insulin resistance (Citation43,Citation44). Both IFG and IGT subjects have increased resistance to the lipolytic action of insulin in the adipocytes, but IFG subjects seem to be able compensate for adipocyte insulin resistance by increasing their basal insulin secretion (Citation43). This compensatory effect keeps plasma free fatty acid concentration at the normal level, and IFG subjects also typically have normal muscle insulin sensitivity (Citation45).
Insulin resistance is commonly associated with NAFLD which is also linked to dyslipidemia, obesity, and T2D (Citation46). It has recently been shown that chemerin concentrations are increased in patients with NAFLD compared to healthy controls (Citation9). Subjects in our study had a similar metabolic profile and BMI as the subjects in Kukla's study (Citation9), and both NAFLD patients and our subjects have higher GGT values than controls in the Kukla's study. They suggested that chemerin and insulin resistance may play a role in NAFLD progression. When looking at our FLI results, both aerobic training and resistance training seem to prevent this progression without affecting hepatic insulin resistance ().
High-sensitivity CRP and γ-GT are produced in liver and associated to obesity. It has been shown that hs-CRP is a predictive factor of non-alcoholic steatohepatitis (NASH) in patients with NAFLD (Citation47) and is associated to IFG and IGT (Citation48). However, recently Sun et al. (Citation49) showed that elevated γ-GT, but not CRP, was independently associated with the presence of IFG/IGT in both genders in a Chinese population. In our study serum hs-CRP and γ-GT values differed between the groups. Nevertheless after Bonferroni adjustment there was no statistically significant difference between the NW group and the RT group in relation to hs-CRP. Unfortunately, we cannot estimate the NAFLD score or liver fat by the equation provided by Kotronen and co-workers (Citation50). It would be supportive for our hypothesis that both aerobic training and resistance training may prevent NAFLD progression. FLI decrease during the intervention period in the NW group was comparable to that of the RT but not the C group. Subjects with values of FLI > 60 (in our study FLI > 70) have a more than 78% probability of having fatty liver, but they also have increased risk for insulin resistance, cardiovascular diseases, and atherosclerosis (Citation51).
Chemerin also correlates positively with leptin and hs-CRP (Citation34). Subjects with NAFLD and MeS have increased leptin levels (Citation14,Citation52). We found that Nordic walking decreased plasma leptin levels. This can result in weight loss (in our study 2.4%). Two studies have reported that even mild weight loss (4%–5%) may have beneficial effects on leptin levels (Citation38).
Leptin resistance is believed to be a major factor in the progression of metabolic syndrome, although the mechanism of leptin resistance is still unknown (Citation53). In our study, leptin decreased in the NW group by 27% but not in the other groups. It seems that aerobic exercise training could reduce leptin resistance. It has been shown that leptin decreased by 21% during a 3-month dynamic strength training program (Citation54) and by 14% with a 6-month program combined with a hypocaloric diet and moderate physical activity (Citation55). Reduced leptin resistance could have positive effects on the peripheral fatty acid oxidation protecting tissues from TG accumulation and/or more serious leptin resistance in NAFLD.
In this study, increased endurance-type physical activity, which mostly consisted of supervised Nordic walking training, improved aerobic performance capacity about 20% and decreased weight (2.4%) and body fat percentage (7.5%) without changes in dietary habits. Similar changes did not take place in the C or RT groups, and fat-free mass was unchanged in all three groups. This indicates that the weight loss in the NW group is mainly due to decreased adipose tissue mass (average –1.9 kg) by increased exercise training for endurance because the caloric intake did not change during the intervention.
Despite the positive effects on the body composition and aerobic performance capacity, no differences were found between the two intervention programs on fasting glucose and insulin, HbA1c, and 2-hour glucose and insulin compared to the C group. Two-hour insulin decreased both in the NW (P = 0.026) and C groups (P = 0.045) but not in the RT group. It seems that the short-term aerobic or resistance training is not associated with improvements in glycemic control in middle-aged men with IGR. Our results are consistent with the results of Gram and co-workers (Citation56) who reported that neither 4 months of Nordic walking nor combined aerobic and resistance training of 1.5 times per week on average and with moderate intensity changed HbA1c levels in T2D subjects. However, in a meta-analysis Strasser and co-workers (Citation15) showed that resistance training reduced HbA1c levels on average 0.48% in the 13 randomized controlled trials included in their analyses. Interestingly, in T2D subjects 12 weeks of combined aerobic and resistance training three times a week did not improve glycemic control, but instead the HbA1c values were significantly reduced in the exercise group with creatine supplementation (Citation57). The exercise alone or exercise plus creatine supplementation had no positive effects on the body composition, lipid profile, or physical capacity (Citation57), unlike in our study. However, the baseline levels of HbA1c values were significantly higher than in our study (7.5% versus 5.5%) which may affect the comparison.
We also found that total cholesterol and LDL cholesterol decreased significantly in the NW group compared to the RT group. A recent meta-analysis showed that aerobic exercise with prudent diet reduced total cholesterol, LDL cholesterol, and TG values, but no changes in HDL cholesterol values were observed (Citation58). In those studies in which only resistance training has been used as intervention, this had no effect on lipid profile (Citation15). Of course it is easier to correct an energy imbalance by using aerobic exercises and/or by changing dietary habits than by using resistance exercises, in which the main purpose is to produce anabolic effects in the muscle tissue and through that to prevent sarcopenia. We found similar results to those reported by Kelley and co-workers in their article (Citation58) without any dietary counseling or diet-induced weight changes.
Systolic blood pressure tended to decrease only in the NW group though the changes were decreasing in all groups. The reasons for that were perhaps large standard deviations and the use of medication against blood pressure. Endurance training lowers resting systolic BP in patients with mild to severe hypertension (Citation59), and a recent meta-analysis also showed that RT reduced systolic BP and this effect on RT seemed to be independent of weight loss (Citation60).
In addition to a decrease of serum chemerin and plasma leptin levels, Nordic walking seems to cause the most beneficial effects on components of MeS. To confirm these findings we used rank-transformed data with ANCOVA using baseline values and body fat percentage as covariates, and our results were in line with non-parametric analyses without adjusting baseline differences for the variables and body fat percentage. In addition, Nordic walking was easily implemented, and during the intervention period no sport or strain injuries induced by Nordic walking training were reported in our study. This study has also limitations that should be considered. A high dropout rate in the RT group affected the homogeneity of the randomized groups which can be seen as baseline differences in mean values of weight and VO2max. In addition, sudden illness and adjustment of working hours or place caused difficulty or even prevented some of subjects from participating in guided training at the fixed gym times. These things can be seen as decreased exercise adherence and many dropouts (). Our results suggest that without dietary change or significant weight loss, 12 weeks of aerobic or resistance training (2.1 or 2.3 times per week, respectively) was insufficient to induce improvements in glycemic control in middle-aged men with IGR. This is consistent with the fact that fewer training session are needed to maintain physical fitness levels but higher frequency (≥ 3 times per weeks) is needed to promote substantial improvements (Citation61). Certainly, the optimal frequency for maintaining or improving fitness is also dependent on other variables, including age, training status, physical fitness level, and type, intensity, and volume of the exercise (Citation61).
In conclusion, Nordic walking has positive effects on aerobic performance capacity, body composition, FLI, and lipid profile without dietary modification. It also decreases circulating leptin concentrations in middle-aged men with impaired glucose regulation. Both Nordic walking and resistance training have regulatory effect on circulating chemerin. The results of our study and those of previous studies raise the suggestion that Nordic walking may have positive effects on obesity-induced low-grade inflammation and preventable effects on the non- alcoholic fatty liver disease and lipid profile in overweight or obese men with impaired glucose regulation. But this suggestion needs more research.
Acknowledgements
The authors wish to express their gratitude to Mr Jouni Kettunen and Juha Pyyhtiä for excellent technical assistance especially in adipokine measurements, Senior lecturers Riitta Nikkonen and Marja Kelander for sampling and clinical chemistry students guidance, Johanna Kurtti MSc, Johanna Mäkelä MSc, and Päivi Peltomäki MSc for dietary analysis, all other students from Turku University of Applied Sciences participating in this study, and the physical education instructors for supervising and guiding the training.
Declaration of interest: The study was supported by grants from the Research Council for Physical Education and Sports, the Finnish Ministry of Education, and Turku University of Applied Sciences R&D program. The authors declare that there is no conflict of interest.
References
- Tonjes A, Fasshauer M, Kratzsch J, Stumvoll M, Bluher M. Adipokine pattern in subjects with impaired fasting glucose and impaired glucose tolerance in comparison to normal glucose tolerance and diabetes. PLoS One. 2010;5:e13911.
- Sell H, Eckel J. Chemotactic cytokines, obesity and type 2 diabetes: in vivo and in vitro evidence for a possible causal correlation?Proc Nutr Soc. 2009;68:378–84.
- Sell H, Divoux A, Poitou C, Basdevant A, Bouillot JL, Bedossa P, . Chemerin correlates with markers for fatty liver in morbidly obese patients and strongly decreases after weight loss induced by bariatric surgery. J Clin Endocrinol Metab. 2010;95:2892–6.
- Hopps E, Canino B, Caimi G. Effects of exercise on inflammation markers in type 2 diabetic subjects. Acta Diabetol. 2011;48:183–9.
- Carey AL, Steinberg GR, Macaulay SL, Thomas WG, Holmes AG, Ramm G, . Interleukin-6 increases insulin-stimulated glucose disposal in humans and glucose uptake and fatty acid oxidation in vitro via AMP-activated protein kinase. Diabetes. 2006;55:2688–97.
- Nieto-Vazquez I, Fernández-Veledo S, de Alvaro C, Lorenzo M. Dual role of interleukin-6 in regulating insulin sensitivity in murine skeletal muscle. Diabetes. 2008;57:3211–21.
- Hamed EA, Zakary MM, Ahmed NS, Gamal RM. Circulating leptin and insulin in obese patients with and without type 2 diabetes mellitus: relation to ghrelin and oxidative stress. Diabetes Res Clin Pract. 2011;94:434–41.
- Kloting N, Fasshauer M, Dietrich A, Kovacs P, Schon MR, Kern M, . Insulin-sensitive obesity. Am J Physiol Endocrinol Metab. 2010;299: E506–15.
- Kukla M, Zwirska-Korczala K, Hartleb M, Waluga M, Chwist A, Kajor M, . Serum chemerin and vaspin in non-alcoholic fatty liver disease. Scand J Gastroenterol. 2010;45:235–42.
- Becker M, Rabe K, Lebherz C, Zugwurst J, Goke B, Parhofer KG, . Expression of human chemerin induces insulin resistance in the skeletal muscle but does not affect weight, lipid levels, and atherosclerosis in LDL receptor knockout mice on high-fat diet. Diabetes. 2010;59: 2898–903.
- Bozaoglu K, Segal D, Shields KA, Cummings N, Curran JE, Comuzzie AG, . Chemerin is associated with metabolic syndrome phenotypes in a Mexican-American population. J Clin Endocrinol Metab. 2009;94:3085–8.
- Lehrke M, Becker A, Greif M, Stark R, Laubender RP, von Ziegler F, . Chemerin is associated with markers of inflammation and components of the metabolic syndrome but does not predict coronary atherosclerosis. Eur J Endocrinol. 2009;161:339–44.
- Yang M, Yang G, Dong J, Liu Y, Zong H, Liu H, . Elevated plasma levels of chemerin in newly diagnosed type 2 diabetes mellitus with hypertension. J Investig Med. 2010;58:883–6.
- Xu D, Huang XD, Yuan JP, Wu J, Fan Y, Luo HS, . Impaired activation of phosphatidylinositol 3-kinase by leptin is a novel mechanism of hepatic leptin resistance in NAFLD. Hepatogastroenterology. 2011;58: 1703–7.
- Strasser B, Siebert U, Schobersberger W. Resistance training in the treatment of the metabolic syndrome: a systematic review and meta-analysis of the effect of resistance training on metabolic clustering in patients with abnormal glucose metabolism. Sports Med. 2010;40: 397–415.
- Flack KD, Davy KP, Hulver MW, Winett RA, Frisard MI, Davy BM. Aging, resistance training, and diabetes prevention. J Aging Res. 2010; 2011:127315.
- Kadoglou NP, Iliadis F, Angelopoulou N, Perrea D, Ampatzidis G, Liapis CD, . The anti-inflammatory effects of exercise training in patients with type 2 diabetes mellitus. Eur J Cardiovasc Prev Rehabil. 2007;14:837–43.
- You T, Nicklas BJ. Chronic inflammation: role of adipose tissue and modulation by weight loss. Curr Diabetes Rev. 2006;2:29–37.
- Sixt S, Beer S, Bluher M, Korff N, Peschel T, Sonnabend M, . Long- but not short-term multifactorial intervention with focus on exercise training improves coronary endothelial dysfunction in diabetes mellitus type 2 and coronary artery disease. Eur Heart J. 2010;31: 112–9.
- Nicklas BJ, Ambrosius W, Messier SP, Miller GD, Penninx BW, Loeser RF, . Diet-induced weight loss, exercise, and chronic inflammation in older, obese adults: a randomized controlled clinical trial. Am J Clin Nutr. 2004;79:544–51.
- Andersson J, Jansson JH, Hellsten G, Nilsson TK, Hallmans G, Boman K. Effects of heavy endurance physical exercise on inflammatory markers in non-athletes. Atherosclerosis. 2010;209:601–5.
- Jones NL. Clinical exercise testing. 3rd ed. Philadelphia: WB Saunders; 1988.
- McDonagh MJN, Davies CTM. Adaptive response of mammalian skeletal muscle to exercise with high loads. Eur J Appl Occup Physiol. 1984;52:139–55.
- Laukkanen RM, Kukkonen-Harjula TK, Oja P, Pasanen ME, Vuori IM. Prediction of change in maximal aerobic power by the 2-km walk test after walking training in middle-aged adults. Int J Sports Med. 2000;21:113–6.
- Lehtonen HM, Suomela JP, Tahvonen R, Vaarno J, Venojarvi M, Viikari J, . Berry meals and risk factors associated with metabolic syndrome. Eur J Clin Nutr. 2010;64:614–21.
- Matthews DR, Hosker JP, Rudenski AS, Naylor BA, Treacher DF, Turner RC. Homeostasis model assessment: insulin resistance and beta-cell function from fasting plasma glucose and insulin concentrations in man. Diabetologia. 1985;28:412–9.
- Bedogni G, Bellentani S, Miglioli L, Masutti F, Passalacqua M, Castiglione A, . The Fatty Liver Index: a simple and accurate predictor of hepatic steatosis in the general population. BMC Gastroenterol. 2006;6:33.
- Laatikainen T, Tapanainen H, Alfthan G, Salminen I, Sundvall J, Leiviskä J, . Tutkimuksen toteutus ja tulokset I.Helsinki: Publications of the National Public Health Institute;2007:B7.
- Haapa E, Toponen T, Pietinen P, Rasanen L. Annoskuvakirja. Helsinki: Painokaari Oy; 1985 [in Finnish].
- Pietinen P, Hartman AM, Haapa E, Rasanen L, Haapakoski J, Palmgren J, . Reproducibility and validity of dietary assessment instruments. I. A self-administered food use questionnaire with a portion size picture booklet. Am J Epidemiol. 1988;128:655–66.
- Ovaskainen ML, Valsta LM, Lauronen J. The compilation of food analysis values as a database for dietary studies—the Finnish experience. Food Chem. 1996;57:133–6.
- Ernst MC, Sinal CJ. Chemerin: at the crossroads of inflammation and obesity. Trends Endocrinol Metab. 2010;21:660–7.
- Bondue B, Wittamer V, Parmentier M. Chemerin and its receptors in leukocyte trafficking, inflammation and metabolism. Cytokine Growth Factor Rev. 2011;22:331–8.
- Weigert J, Neumeier M, Wanninger J, Filarsky M, Bauer S, Wiest R, . Systemic chemerin is related to inflammation rather than obesity in type 2 diabetes. Clin Endocrinol (Oxf). 2010;72:342–8.
- Lofgren P, Andersson I, Adolfsson B, Leijonhufvud BM, Hertel K, Hoffstedt J, . Long-term prospective and controlled studies demonstrate adipose tissue hypercellularity and relative leptin deficiency in the postobese state. J Clin Endocrinol Metab. 2005;90: 6207–13.
- Mlinar B, Marc J. Review: new insights into adipose tissue dysfunction in insulin resistance. Clin Chem Lab Med. 2011;49:1925–35.
- Skurk T, Alberti-Huber C, Herder C, Hauner H. Relationship between adipocyte size and adipokine expression and secretion. J Clin Endocrinol Metab. 2007;92:1023–33.
- Klempel MC, Varady KA. Reliability of leptin, but not adiponectin, as a biomarker for diet-induced weight loss in humans. Nutr Rev. 2011;69: 145–54.
- Kotnik P, Fischer-Posovszky P, Wabitsch M. RBP4: a controversial adipokine. Eur J Endocrinol. 2011;165:703–11.
- Graham TE, Yang Q, Bluher M, Hammarstedt A, Ciaraldi TP, Henry RR, . Retinol-binding protein 4 and insulin resistance in lean, obese, and diabetic subjects. N Engl J Med. 2006;354:2552–63.
- Petersen KF, Dufour S, Befroy D, Lehrke M, Hendler RE, Shulman GI. Reversal of nonalcoholic hepatic steatosis, hepatic insulin resistance, and hyperglycemia by moderate weight reduction in patients with type 2 diabetes. Diabetes. 2005;54:603–8.
- Haus JM, Solomon TP, Marchetti CM, Edmison JM, Gonzalez F, Kirwan JP. Free fatty acid-induced hepatic insulin resistance is attenuated following lifestyle intervention in obese individuals with impaired glucose tolerance. J Clin Endocrinol Metab. 2010;95:323–7.
- Abdul-Ghani MA, Molina-Carrion M, Jani R, Jenkinson C, Defronzo RA. Adipocytes in subjects with impaired fasting glucose and impaired glucose tolerance are resistant to the anti-lipolytic effect of insulin. Acta Diabetol. 2008;45:147–50.
- Faerch K, Borch-Johnsen K, Holst JJ, Vaag A. Pathophysiology and aetiology of impaired fasting glycaemia and impaired glucose tolerance: does it matter for prevention and treatment of type 2 diabetes?Diabetologia. 2009;52:1714–23.
- Abdul-Ghani MA, Jenkinson CP, Richardson DK, Tripathy D, DeFronzo RA. Insulin secretion and action in subjects with impaired fasting glucose and impaired glucose tolerance: results from the Veterans Administration Genetic Epidemiology Study. Diabetes. 2006; 55:1430–5.
- Bugianesi E, McCullough AJ, Marchesini G. Insulin resistance: a metabolic pathway to chronic liver disease. Hepatology. 2005;42: 987–1000.
- Fierbinteanu-Braticevici C, Baicus C, Tribus L, Papacocea R. Predictive factors for nonalcoholic steatohepatitis (NASH) in patients with nonalcoholic fatty liver disease (NAFLD). J Gastrointestin Liver Dis. 2011; 20:153–9.
- Lin J, Zhang M, Song F, Qin J, Wang R, Yao P, . Association between C-reactive protein and pre-diabetic status in a Chinese Han clinical population. Diabetes Metab Res Rev. 2009;25:219–3.
- Sun J, Ren J, Pang ZC, Gao WG, Nan HR, Wang SJ, . The association of gamma-glutamyltransferase and C-reactive protein with IFG/IGT in Chinese adults in Qingdao, China. Clin Chim Acta. 2011;412:1658–61.
- Kotronen A, Peltonen M, Hakkarainen A, Sevastianova K, Bergholm R, Johansson LM, . Prediction of non-alcoholic fatty liver disease and liver fat using metabolic and genetic factors. Gastroenterology. 2009; 137:865–72.
- Gastaldelli A, Kozakova M, Højlund K, Flyvbjerg A, Favuzzi A, Mitrakou A, et al.;RISC Investigators. Fatty liver is associated with insulin resistance, risk of coronary heart disease, and early atherosclerosis in a large European population. Hepatology. 2009;49:1537–44.
- Bremer AA, Devaraj S, Afify A, Jialal I. adipose tissue dysregulation in patients with metabolic syndrome. J Clin Endocrinol Metab. 2011;96: E1782–8.
- Unger RH, Scherer PE. Gluttony, sloth and the metabolic syndrome: a roadmap to lipotoxicity. Trends Endocrinol Metab. 2010;21:345–52.
- Klimcakova E, Polak J, Moro C, Hejnova J, Majercik M, Viguerie N, . Dynamic strength training improves insulin sensitivity without altering plasma levels and gene expression of adipokines in subcutaneous adipose tissue in obese men. J Clin Endocrinol Metab. 2006;91:5107–12.
- Monzillo LU, Hamdy O, Horton ES, Ledbury S, Mullooly C, Jarema C, . Effect of lifestyle modification on adipokine levels in obese subjects with insulin resistance. Obes Res. 2003;11:1048–54.
- Gram B, Christensen R, Christiansen C, Gram J. Effects of Nordic walking and exercise in type 2 diabetes mellitus: a randomized controlled trial. Clin J Sport Med. 2010;20:355–61.
- Gualano B, DE Salles Painneli V, Roschel H, Artioli GG, Neves M Jr, De Sa Pinto AL, . Creatine in type 2 diabetes: a randomized, double-blind, placebo-controlled trial. Med Sci Sports Exerc. 2011;43:770–8.
- Kelley GA, Kelley KS, Roberts S, Haskell W. Efficacy of aerobic exercise and a prudent diet for improving selected lipids and lipoproteins in adults: a meta-analysis of randomized controlled trials. BMC Med. 2011;9:74.
- Whelton PK, He J, Appel LJ, Cutler JA, Havas S, Kotchen TA, . Primary prevention of hypertension: clinical and public health advisory from The National High Blood Pressure Education Program. JAMA. 2002;288:1882–8.
- Strasser B, Schobersberger W. Evidence for resistance training as a treatment therapy in obesity. J Obes. 2011;2011. pii:482564.
- Garber CE, Blissmer B, Deschenes MR, Franklin BA, Lamonte MJ, Lee IM, . American College of Sports Medicine. American College of Sports Medicine position stand. Quantity and quality of exercise for developing and maintaining cardiorespiratory, musculoskeletal, and neuromotor fitness in apparently healthy adults: guidance for prescribing exercise. Med Sci Sports Exerc. 2011;43:1334–59.