Abstract
Introduction. Aiming at identifying biomarkers for hypertrophic cardiomyopathy (HCM), the serum proteome was explored through a two-dimensional gel-based proteomic approach (2D-DIGE) coupled with mass spectrometry and database interrogation.
Methods. Serum samples from 20 male HCM patients and their sex- and age-matched controls were cleaned from interfering components. Patients and controls were pooled in five matched groups with the same age, and proteins extracts from each pool were labelled with cyanine dyes. Then, gel images were analysed using a fluorescence scanner and proteins were identified. Tryptic peptides were analysed by capillary reversed-phase liquid chromatography coupled online with tandem mass spectrometry (MS/MS).
Results. Four different proteins were observed to be differentially expressed between HCM patients and their matched controls. Of them, decreases in haptoglobin levels were confirmed to be associated with HCM in an independent set of 181 consecutive HCM patients from our monographic clinic and 114 controls with similar age and sex using a nephelometer-based technique. Moreover, a significant negative correlation was observed between haptoglobin and subaortic gradient, thus highlighting the role of haptoglobin in HCM.
Conclusion. All these observations point out the utility of the 2D-DIGE proteomic strategy for the identification of serum proteins indicative of the presence of cardiac injury.
Key messages
Proteomic technologies (two-dimensional differential gel electrophoresis coupled with liquid chromatography and MS/MS) are very useful to identify new potential serum hypertrophic cardiomyopathy (HCM) biomarkers.
Haptoglobin has been identified as a new potential HCM biomarker and could represent a valuable tool as a diagnostic and response to therapy biomarker.
A significant negative correlation between haptoglobin and subaortic obstruction was observed, resulting from higher haemolysis in HCM patients.
Introduction
Hypertrophic cardiomyopathy (HCM) is morphologically characterized by a marked hypertrophy of the left ventricular wall without inciting factors such as aortic stenosis or hypertension, and microscopically by cardiomyocyte hypertrophy, myofibrillar disarray, and fibrosis (Citation1). Although hypertrophy and fibrosis are common to a variety of cardiovascular diseases, myocyte disarray is considered the pathological hallmark of HCM and often comprises more than 20% of the ventricle (Citation2). HCM is a monogenic cardiac disease with an autosomal dominant pattern of heritability and different penetrance, with a prevalence of 1/ 500 in young individuals (Citation3). However, the prevalence of HCM is likely to be much higher in older subjects, because the penetrance is age-dependent and affected individuals gradually exhibit the phenotype as they get older (Citation4). HCM is the most common cause of sudden cardiac death in youth and a major cause of mortality and morbidity in elderly patients (Citation2). More than 400 mutations have been identified which contribute to the heterogeneity of the disease phenotype (Citation5). Genetic studies, in addition to establishing heterogeneity of the causal genes, have also illustrated considerable allelic heterogeneity (Citation6) and suggest that mutations arise independently and there is no common founder (Citation7).
Similarly to genomic technologies, proteomic approaches allow the discovery of disease-specific targets and biomarkers, providing promising diagnostic and prognostic information. Proteomics can be defined as ‘the knowledge of the structure, function and expression of all proteins in the biochemical or biological contexts of all the organisms’ (Citation8) and is an important approach to unraveling pathophysiology and for early detection of disease. The challenge of proteomics versus genomics resides in the complexity of protein chemistry and multiple potential post-translational functional modifications contrasting with the unique binding nucleotide complementarity on which genomics relies (Citation9). It can be said that while genomics explain the disposition to disease, proteomics give a more accurate reflection of exact disease processes at the time of study.
Two-dimensional gels (2D) and mass/weight spectrometry techniques are ideal approaches for identification purposes. In HCM, two-dimensional differential gel electrophoresis (2D- DIGE) (Citation10) and mass spectrometry techniques (Citation11) have previously been utilized to identify proteins differentially expressed between animal models and controls using cardiac tissues (Citation10,Citation11). However, to the best of our knowledge, fluorescent labelling of serum sample extracts from HCM patients and their matched controls using a 2D-DIGE strategy has not been reported to date.
The advantage of 2D-DIGE relies on defining the statistical significance of proteins identified that were differentially expressed between disease and control specimens. As part of the experimental design (), a combination of proteomic technologies (2D-DIGE and reverse phase liquid chromatography (LC) coupled with mass spectrometry (MS/MS)) was explored as a means to identify differentially expressed proteins in serum extracts of patients with HCM and their matched controls. The presence of proteins differentially expressed in the serum was confirmed later using independent analytical methods.
Figure 1. Experimental design. A: Serum samples handling was optimized by removing salts and other potentially interfering substances. B: DIGE analyses revealed proteins differentially expressed in a significant manner between serum specimens from HCM and control patients. C: Preparative new gels were visualized using Coomassie staining for picking up selected spots. D: Proteins of interest were identified using liquid chromatography coupled with MS/MS. E: Nephelometry served to validate the HCM diagnostic properties of identified proteins on independent series of serum samples.
Clinical and pathological characteristics of HCM could involve a number of diverse mechanisms that include inflammation, endothelial dysfunction, fibrosis, and extracellular matrix degradation (Citation12), as well as coagulation and platelet activation (Citation13). Different molecules involved in the different pathophysiological pathways can be detected in the blood, and the detection of these appropriate biomarkers could potentially provide tools to diagnose and stratify HCM patients (Citation14).
The aim of the present study is to provide new potential biomarkers in patients with HCM, using a combination of proteomic approaches that could give some insights into the pathophysiologic mechanism(s) underlying the typical clinical manifestations of the disease.
Methods
Blood samples
Venous blood samples of patient and control individuals were drawn atraumatically and without stasis into syringes preloaded with trisodium citrate (0.011 mol/L). Information of patients and controls providing serum samples is included in . Serum aliquots were stored at − 80°C until their use. The diagnosis of HCM was based on the presence of unexplained left ventricular hypertrophy, or in accordance with criteria for the diagnosis of familial disease in patients with at least one first-degree relative who has an unequivocal diagnosis.
Table I. Information of patients and controls providing serum samples included for 2D-DIGE analysis.
Serum sample preparation and fluorescence labelling
Serum samples were thawed at 37°C and 50 μL of each sample processed using albumin and IgG Depletion Spin trap (GE Healthcare Europe GmbH, Freiburg, Germany) to reduce their content in these proteins. Demographic and clinical characteristics of patients included in the proteomic analysis can be observed in . Flow-through containing serum-depleted fractions was cleaned using 2D clean-up kit (GE Healthcare Europe GmbH, Freiburg, Germany) and resuspended in rehydration buffer (30 mmol/L Tris basic, 2 mol/L thiourea, 7 mol/L urea, 4% wt/vol CHAPS). Protein concentration was determined with 2Dquant kit (GE Healthcare Europe GmbH, Freiburg, Germany). In order to reduce the biological variation of samples, ten subpools were generated from the 40 serum-depleted samples (Citation15). Briefly, five subpools were obtained from 20 patient samples and other five from 20 matched control samples. Every sample contributes to its subpool with 100 μg of protein. This way, a total of 40 samples were analysed divided in ten subpools, keeping a statistical power of 96%, as was determined according to Zhang et al. (Citation16).
Table II. Demographic and clinical characteristics of patients included in the 2D-DIGE analysis.
The DIGE fluorochromes, N-hydroxysuccinimidyl ester derivatives of the cyanine dyes, Cy3 and Cy5 (GE Healthcare), were prepared using freshly opened N,N-dimethylformamide (Sigma-Aldrich, St Louis, MO, USA). Each pool of samples (50 μg) was labelled with 400 pmol of cyanine dyes in separate tubes on ice for 30 minutes. An internal standard was created by mixing equal amounts of each pool samples and labelling it with Cy5, whereas individual pool samples were labelled with Cy3. We decided to use only two DIGE dyes because a bias of false positive accumulation had been observed when a three-dye DIGE experiment was carried out (Citation17). The bias was shown to arise from correlation in the data from the use of a common internal standard. With a two-dye schema, where each sample has its own internal standard, such bias was removed (Citation17). The labelling reaction was quenched by adding 1 μL of 10 mmol/L lysine.
Two-dimensional DIGE
The immobilized pH gradient strips (pH 4–7; GE Healthcare Europe GmbH, Freiburg, Germany) were actively rehydrated for 12 hours according to the manufacturer's instructions. The Cy5-labelled internal standard of pooled samples was used to minimize experimental gel-to-gel variation and to facilitate cross-gel quantitative analysis. Equal amounts (50 μg protein per dye per gel) of Cy3-labelled individual samples and the Cy5-labelled internal standard were mixed together (100 μg protein per gel) and cup-loaded onto an 18-cm immobilized pH gradient strip (pH 4–7). The proteins were focused in the first dimension for a total of 60,000 Vh in the Ettan IPGphor 3 system (GE Healthcare Europe GmbH, Freiburg, Germany) overnight. The immobilized pH gradient strips were equilibrated first in buffer I (6 mol/L urea, 2% SDS, 50 mmol/L Tris (pH 8.8), 20% glycerol, 2% DTT) for 15 minutes and then in buffer II (same as buffer I plus 2.5% iodoactamide) for 15 minutes and subsequently transferred onto 12.5% SDS-PAGE gels. Proteins were then separated in the second dimension based on their molecular weight in the Ettan DALT six (GE Healthcare Europe GmbH, Freiburg, Germany). A total of 12 gels were run at 5 mA per gel for 2 hours and 2 W per gel for 13 hours with the temperature of the running buffer maintained at 23°C.
Image acquisition and data analysis
Gels were scanned at 532/580 nm and 633/670 nm (excitation/emission wavelengths) for the Cy3 and Cy5 signals, respectively, using a Typhoon 9410 fluorescent scanner (GE Healthcare Europe GmbH, Freiburg, Germany). Raw data of images were analysed with DeCyder 2D software version 7.0 (GE Healthcare Europe GmbH, Freiburg, Germany). Briefly, original images of Cy3 and Cy5 images for each gel were cropped and smoothed to clarify spots. The software was used following the manufacturer's recommendation, and the estimated number of spots was set to 2500. A MatchSet was created for comparing and analysing spots from all ten images, and a master image, which contains the spot data from all the gels in the MatchSet, was then generated. The Cy3 spot data from each gel were normalized on a spot-to-spot basis using respective Cy5 signals of the internal standard from the same gel, and the normalized Cy3 signal was then used for spot intensity comparison. Student's t test with a false discovery rate correction was performed for every matched spot set, comparing the average ratio for a given spot between the control and patient groups. Only those spots with a P value < 0.05 and an average ratio greater than 1.5 or less than 1.5 were considered.
Preparative 2D gels
Preparative gels, containing 350 μg of protein, were prepared for control and patient pool samples using PlusOne™ Bind-Silane following the manufacturer's recommendation (GE Healthcare Europe GmbH, Freiburg, Germany). These gels were fixed and stained with Coomassie blue R-250 (). The images were then captured using the ImageScanner III System (GE Healthcare Europe GmbH, Freiburg, Germany). The desired protein spots were manually picked from the Coomassie-stained gels.
Figure 2. Representative 2D-DIGE staining of proteomic profiling from serum samples. A: Protein extract from HCM patients; and B: proteome extract from sex- and age-matched controls. Spots marked with a number indicate identified proteins whose abundance changes between HCM and control specimens reached statistical significance.
Protein identification
Proteins within gel spots were first reduced and alkylated using DTT and iodoacetamide, respectively, and then digested to peptides by trypsin proteomics grade (Sigma-Aldrich, St Louis, MO, USA) as previously described (Citation18). The tryptic peptides were analysed by capillary reversed-phase liquid chromatography coupled online with MS/MS. The column, BioBasic-18, 5 μm particles, 300 Å pore size, 0.18 mm ID-30 mm L (Thermo, San Jose, CA, USA), was connected to a Surveyor MS Pump Plus (Thermo, San Jose, CA, USA) and then coupled with an ion trap mass spectrometer (LXQ, Thermo, San Jose, CA, USA). The flow rate was set at 100 μL/min but split to a flow rate of 2 μL/min. Mobile phase A was 0.1% formic acid/2% methanol in water, and B was 0.1% formic acid in methanol. The peptide samples were injected and gradient elution was done under the following conditions: 5% B in 2 minutes; a linear increase of 5% to 70% B in 20 minutes; 70% for 10 minutes; 5% B for 10 minutes. The ion trap MS was operated in a data-dependent MS/MS mode where the five most abundant peptide molecular ions in every MS scan were sequentially selected for collision-induced dissociation with a normalized collision energy of 34%. Dynamic exclusion was applied to minimize repeated selection of peptides previously selected for collision-induced dissociation. The capillary temperature and electrospray voltage were set to 200°C and 3.5 kV, respectively. The resulting mass spectra were searched against the NCBI human non-redundant protein database (32,440 sequences, released 19 June 2006) with the Proteome Discoverer 1.0 software (Thermo, San Jose, CA, USA). The following search parameters were applied: default charge states of 2+, 3+, and 4 + were used; a maximum of one missed cleavage was allowed with an average peptide mass tolerance of 1.5 Da. A fragment ion search tolerance of 0.8 Da was permitted. Fixed modification on cysteine was carbamidomethylation, and a variable modification was oxidation of methionine. All data were searched against a decoy database. The peptide level score cut-off for each of the runs was automatically adjusted to ensure a 1% false discovery rate throughout the experiments. A positive identification was assigned when one or more unique peptides were identified.
Nephelometric immunoassay
Serum concentrations of haptoglobin and hemopexin were determined in an automated nephelometer BN ProSpec® System (Siemens Healthcare Diagnostics®). Demographic and clinical characteristics of patients included in the nephelometric immunoassay can be observed in . The principle of nephelometry consists in an 840-nm wavelength light beam passing through a cuvette containing the antigen-antibody complex. Nephelometry measures the amount of light scattering by the antigen-antibody complex. The amount of scattered light is proportional to the concentration of the antigen-antibody complexes in the sample over a wide concentration range. The sample volume required was 10 μL for haptoglobin and 20 μL for hemopexin. The intra-assay coefficients of variation (CV), obtained for serum with N Antisera to Human haptoglobin and hemopexin on the BN System were 2.6% and 1.7%, respectively, and the inter-assay CV was 2.7% for haptoglobin and 2.1% for hemopexin. Internal quality control was carried out on a daily basis for ensuring the accuracy of the results.
Table III. Demographic and clinical characteristics of patients included in the nephelometric immunoassay.
Results
Differential protein expression among HCM patients and controls
Ten independent 2D-DIGE gels were performed comparing the serum proteome of HCM patients and controls. The sample size to find statistically significant differences between the two groups with a 2D-DIGE approach was determined using a tool developed by Zhang et al., in 2005, creating ‘subpools’ to reduce the number of gels (Citation16). In this tool, the biological variance at individual subject level was established at 90%, the threshold P value was determined to be 0.01, and the magnitude of difference between the two populations was established at 1.5. In this way five pools with four HCM patients in each and five pools of age- and sex-matched controls were created, giving a statistical power of more than 95%. An internal standard was created by mixing equal amounts of each pool samples and labelling it with Cy5, whereas individual pool samples were labelled with Cy3. The Cy5-labelled internal standard of pooled samples was used to minimize experimental gel-to-gel variation and to facilitate cross-gel quantitative analysis. Thus, the analysis of the Cy3 and Cy5 gel images was carried out with the BVA module of the DeCyder software revealing the presence of 11 spots changing in a significant manner with statistical variance of the patient versus control spot volume ratios within the 95th confidence level (Student's t test, P < 0.05) ().
Identification of serum proteins after Coomassie staining
Proteins observed by the 2D-DIGE approach to be differentially expressed in a significant manner among HCM patients and controls were excised from preparative Coomassie-stained gels for their identification using mass spectrometry and database interrogation. Description and characteristics of the identified proteins are shown in . Identification numbers in matched those associated to the 2D-DIGE spots shown in . In our study, 11 spots were found to be differentially expressed between serum specimens from HCM patients and controls in a statistically significant manner. Mass spectrometry identified four different proteins, because more than one spot revealed the presence of the same protein (albumin was identified from six different spots) and because we were not able to identify two of the spots with the MS/MS approach due to low abundance (spots 1062 and 1067). illustrates the 3D view corresponding to the pixel volume distribution for the Cy5/Cy3 ratio of the proteins differentially expressed between serum specimens belonging to HCM patients and controls. The following proteins were identified to be overexpressed in the serum specimens belonging to HCM patients: hemopexin, Ig alpha-1 chain C region isoform, and albumin, whereas haptoglobin was underexpressed.
Figure 3. Three-dimensional view of differentially expressed proteins in serum samples from HCM patients compared with controls. Changes in protein expression from HCM and controls are shown by each line. The average ratio of expression for each selected protein grouping in HCM and control specimens as obtained by computational analysis with DeCyder Software is represented by lines marked with a cross. Statistical analysis allowed detection of significant abundance changes (95th confidence level) based on the variance of the mean change within the cohort: A: haptoglobin; B: hemopexin; C: Ig alpha-1 chain C region isoform; D: albumin.
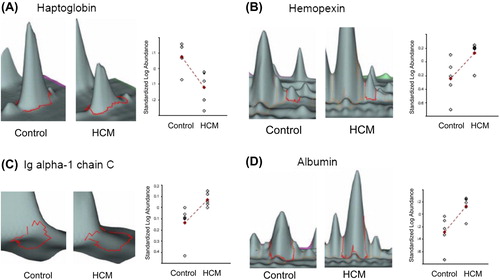
Table IV. Significant differentially expressed proteins identified by reverse-phase liquid chromatography coupled with MS/MS after 2D-DIGE analysis of HCM patients versus control serum samples.
Identified proteins are differentially expressed in a series of independent HCM patients
As a part of validation analyses of the potential relevance of the identified proteins in HCM diagnostics, serum concentrations of haptoglobin (Hp) and hemopexin (Hx) were determined in an automated nephelometer. A decrease in haptoglobin levels was confirmed to be associated with HCM in an independent set of 181 consecutive HCM patients from our monographic clinic (68.5% men, mean age 45.7 ± 15.3) and 114 controls with similar age and sex using a nephelometer-based technique. HCM patients showed a decrease in haptoglobin serum levels when compared with healthy controls (0.909 ± 0.680 g/L versus 1.237 ± 0.441 g/L, P < 0.001) (). Moreover, we observed a significant negative correlation between haptoglobin and subaortic gradient (r = –0.30, P < 0.001), thus highlighting the role of Hp in HCM. However, levels of Hp have not been associated with other clinical parameters such as maximal left ventricular wall thickness (MLVT), presence of atrial fibrillation (AF), or dyspnoea. In addition, the nephelometric immunoassay showed that hemopexin levels were not associated with HCM in the same independent set of 181 consecutive HCM patients from our monographic clinics and 114 controls, thus not confirming the results obtained with the 2D-DIGE technology ().
Table V. Correlation of haptoglobin and hemopexin serum levels with HCM.
Discussion
Several proteins were found to be differentially expressed in a significant manner in serum samples of HCM patients as compared to matched controls and identified by means of 2D-DIGE approach combined with mass spectrometry technology. Variations of haptoglobin and hemopexin levels in HCM patients when compared with age- and sex-matched controls were confirmed by nephelometry in an independent series of patients and controls. Thus, the combination of proteomic approaches has served to identify haptoglobin as a potential novel biomarker differentially expressed in HCM patients.
The main advantage of 2D-DIGE fluorescent labelling relies on the ability to estimate statistically the extent of the differential protein expression between disease and control specimens. The labelling strategy was critical in the discovery process for serum biomarkers using this 2D-DIGE approach. The internal pool generated by combining equal amounts of extracts from all the serum specimens (HCM patients and controls) was included in all gel runs and served to assess inter-assay reproducibility. However, we did not use Cy2 fluorescent dye because it has been associated with a higher rate of false positives (Citation17). Moreover, in this study, we designed several HCM patient and control subpools as suggested by Zhang et al. (Citation16), thus decreasing the biological variations between samples and increasing the number of patients and controls analysed. Nevertheless, it should be assumed that other potentially interesting proteins might not be identified in a significant manner as the abundance changes may be underexpressed or not detected in certain patients and overexpressed in other. This variability justifies the limited number of statistically significant changes found in our series. To cover this variability, all detectable spots observed in each Coomassie image with statistical significance were also selected for tryptic digestion on protein identification.
To evaluate the relevance of these identified novel potential biomarkers in HCM, a nephelometric assay was performed on independent serum samples. Interestingly, a decrease in Hp levels was observed in HCM patients when compared with control serum samples (). Moreover, a significant negative correlation between Hp and subaortic obstruction and an increase of Hp levels in women were also observed. All these results confirm the in silico observations, pointing out the potential importance of Hp determinations for HCM diagnostics and are in concordance with previous observations of haptoglobin decrease in HCM patients (Citation19–22). Although haemolytic anaemia due to intravascular trauma is not uncommon in patients with prosthetic heart valves, some cases of haemolytic anaemia associated with HCM in unoperated patients have been reported (Citation19, Citation20, Citation22). Moreover, the presence of two HCM patients with haemolysis (Citation20) led to a review of medical notes of 27 patients in a 10-year period, showing that 55% of HCM patients had abnormalities in Hp levels. In addition, the anaemia and low levels of Hb and Hp in a 66-year-old woman suggested the diagnosis of HCM, subsequently confirmed after transthoracic echocardiography (Citation22). Interestingly, after treatment with β-blockers and antiarrhythmic drugs these patients showed a reduction in the pressure gradient, thus increasing their Hb and Hp levels (Citation19,Citation20,Citation22).
In vitro analyses have demonstrated that little haemolysis occurs at red cell shearing stress below 3000 dyn/cm2 (Citation20). However, haemolysis is greatly increased above this level. The presence of an outflow tract gradient provides a means of intravascular haemolysis that develops when pressure gradients of > 50 mmHg are present. If Bernoulli's equation is applied when peak systolic pressure gradient is 50 mmHg, red cell shear stress equals 4000 dyn/cm2, exceeding the limit of membrane tensile strength and producing red cell rupture (Citation23).
Although we could not confirm hemopexin as a potential serum biomarker after nephelometric assays (), this issue does not undermine the discriminative ability of the 2D-DIGE approach that is evaluated in the present study. Indeed, hemopexin and haptoglobin are function-related molecules, and an important role of both of them in HCM should not be underestimated. One possible explanation for the discrepancies obtained between the in silico technology and the nephelometric validation assay in the hemopexin analysis can be the differences in patients cohorts. For the 2D-DIGE approach we recruited only young and male patients () to obtain the most homogeneous cohort as possible, and with no other co-morbidities that could mask the role of the biomarkers in HCM, whereas for the confirmation assay we recruited consecutive patients from our HCM clinic ().
Hp is a plasma protein with a very high binding affinity for Hb (Kd ≈ 1 pM). It is expressed mainly in the liver and belongs to the family of acute phase proteins, whose synthesis is induced during inflammatory processes (Citation24). Hb is the most abundant and functionally important protein in erythrocytes; however, under haemolysis conditions it becomes highly toxic because of the oxidative properties of heme, producing reactive oxygen species causing cell injury (Citation25). The toxicity of heme is increased by heme hydrophobicity, allowing it to intercalate into lipid membranes and other lipophilic compartments (Citation26). Interestingly, recent data provide evidence of a proinflammatory role in vivo (Citation27). Usually, low levels of extravascular haemolysis occur causing Hb release into plasma; however, under several pathologic conditions, such as obstruction to left ventricular outflow, large amounts of free Hb are released. Moreover, the prevalence of haemolysis in HCM is probably higher than previously estimated. The presence and severity of red cell fragmentation in this disorder appears to be correlated essentially with the magnitude of the intraventricular pressure gradient (IVPG) (Citation20). In this situation, Hb is rapidly scavenged by Hp, and macrophages take up Hb-Hp complexes and catabolise them (Citation28). This way, the outflow tract gradient promotes red cell intravascular haemolysis, Hb is scavenged by Hp, and both are removed from the circulation by macrophages, decreasing the levels of Hp in HCM patients.
In conclusion, as mechanisms that underlie differences in the presentation and pathophysiological features of HCM are not completely understood, the results obtained in this paper reveal the usefulness of a 2D-DIGE approach to identify proteins from serum samples and suggest the necessity of further analysis to confirm the pathophysiological role of Hp as a potential biomarker of HCM. Moreover, the presence and severity of red cell fragmentation in this disorder appears to be correlated essentially with the magnitude of the pressure gradient. Thus, further studies are necessary to confirm that, in HCM, Hp could represent a valuable tool as a diagnostic and response to therapy biomarker.
Hemopexin MS/MS spectrum data
Download PDF (419.4 KB)Declaration of interest: The authors report no conflicts of interest. Dr Orenes-Piñero is supported by a postdoctoral contract from Fundación para la Formación e Investigación Sanitarias de la Región de Murcia, Murcia, Spain. Dr Hernández-Romero holds a postdoctoral grant (Sara Borrell fellowship) from the Instituto de Salud Carlos III (Spain). This work has been supported by an FIS PS09/00721 project for the Instituto de Salud Carlos III, and partially by Funding FEDER.
References
- Ommen SR, Nishimura RA. Hypertrophic cardiomyopathy. Curr Probl Cardiol. 2004;29:239–91.
- Tsybouleva N, Zhang L, Chen S, Patel R, Lutucuta S, Nemoto S, et al. Aldosterone, through novel signaling proteins, is a fundamental molecular bridge between the genetic defect and the cardiac phenotype of hypertrophic cardiomyopathy. Circulation. 2004;109:1284–91.
- Elliott P, McKenna WJ. Hypertrophic cardiomyopathy. Lancet. 2004;36:1881–91.
- Maron BJ, Niimura H, Casey SA, Soper MK, Wright GB, Seidman JG, et al. Development of left ventricular hypertrophy in adults in hypertrophic cardiomyopathy caused by cardiac myosin-binding protein C gene mutations. J Am Coll Cardiol. 2001;38:315–21.
- Ho CY, Seidman CE. A contemporary approach to hypertrophic cardiomyopathy. Circulation. 2006;113:858–62.
- Marian AJ. Hypertrophic cardiomyopathy: from genetics to treatment. Eur J Clin Invest. 2010;40:360–9.
- Watkins H, Thierfelder L, Anan R, Jarcho J, Matsumori A, McKenna W, et al. Independent origin of identical beta cardiac myosin heavy-chain mutations in hypertrophic cardiomyopathy. Am J Hum Genet. 1993;53:1180–5.
- Kenyon GL, DeMarini DM, Fuchs E, Galas DJ, Kirsch JF, Leyh TS, et al. Defining the mandate of proteomics in the post-genomics era: workshop report. Mol Cell Proteomics. 2002;1:763–80.
- Orenes-Piñero E, Cortón M, González-Peramato P, Algaba F, Casal I, Serrano A, et al. Searching urinary tumor markers for bladder cancer using a two-dimensional differential gel electrophoresis (2D-DIGE) approach. J Proteome Res. 2007;6:4440–8.
- Ares-Carrasco S, Picatoste B, Camafeita E, Carrasco-Navarro S, Zubiri I, Ortiz A, et al. Proteome changes in the myocardium of experimental chronic diabetes and hypertension: role of PPARα in the associated hypertrophy. J Proteomics. 2012;75:1816–29.
- Wei BR, Simpson RM, Johann DJ, Dwyer JE, Prieto DA, Kumar M, et al. Proteomic profiling of H-Ras-G12V induced hypertrophic cardiomyopathy in transgenic mice using comparative LC-MS analysis of thin fresh-frozen tissue sections. J Proteome Res. 2012;11:1561–70.
- Roldán V, Marín F, Gimeno JR, Ruiz-Espejo F, González J, Feliu E, et al. Matrix metalloproteinases and tissue remodeling in hypertrophic cardiomyopathy. Am Heart J. 2008;156:85–91.
- Cambronero F, Marín F, Roldán V, Hernández-Romero D, Valdés M, Lip GY. Biomarkers of pathophysiology in hypertrophic cardiomyopathy: implications for clinical management and prognosis. Eur Heart J. 2009; 30:139–51.
- Moreno V, Hernández-Romero D, Vilchez JA, García-Honrubia A, Cambronero F, Casas T, et al. Serum levels of high-sensitivity troponin T: a novel marker for cardiac remodeling in hypertrophic cardiomyopathy. J Card Fail. 2010;16:950–6.
- Karp NA, Lilley KS. Investigating sample pooling strategies for DIGE experiments to address biological variability. Proteomics. 2009;9:388–97.
- Zhang SD, Gant TW. Effect of pooling samples on the efficiency of comparative studies using microarrays. Bioinformatics. 2005;21:4378–83.
- Karp NA, McCormick PS, Russell MR, Lilley KS. Experimental and statistical considerations to avoid false conclusions in proteomics studies using differential in-gel electrophoresis. Mol Cell Proteomics. 2007;6:1354–64.
- Shevchenko A, Tomas H, Havlis J, Olsen JV, Mann M. In-gel digestion for mass spectrometric characterization of proteins and proteomes. Nat Protoc. 2006;1:2856–60.
- Zezulka A, Shapiro L, Singh S. Chronic haemolytic anaemia in hypertrophic cardiomyopathy. Br Heart J. 1984;52:474–6.
- Lambert M, Bosly E, Boland B, Hainaut P, Vanoverschelde JL. Intravascular haemolysis in hypertrophic cardiomyopathy. Eur Heart J. 1996;17:1601–2.
- Heilmann C, Geisen U, Benk C, Berchtold-Herz M, Trummer G, Schlensak C, et al. Haemolysis in patients with ventricular assist devices: major differences between systems. Eur J Cardiothorac Surg. 2009;36:580–4.
- Kubo T, Kitaoka H, Terauchi Y, Tamura S, Okawa M, Yamasaki N, et al. Hemolytic anemia in a patient with hypertrophic obstructive cardiomyopathy. J Cardiol. 2010;55:125–9.
- Jacobson RJ, Rath CE, Perloff JK. Intravascular haemolysis and thrombocytopenia in left ventricular out-flow obstruction. Br Heart J. 1973;35:849–54.
- Tolosano E, Fagoonee S, Hirsch E, Berger FG, Baumann H, Silengo L, et al. Enhanced splenomegaly and severe liver inflammation in haptoglobin/hemopexin double-null mice after acute hemolysis. Blood. 2002;100:4201–8.
- Watanabe J, Grijalva V, Hama S, Barbour K, Berger FG, Navab M, et al. Hemoglobin and its scavenger protein haptoglobin associate with apoA-1-containing particles and influence the inflammatory properties and function of high density lipoprotein. J Biol Chem. 2009;284: 18292–301.
- Balla J, Jacob HS, Balla G, Nath K, Eaton JW, Vercellotti GM. Endothelial-cell heme uptake from heme proteins: induction of sensitization and desensitization to oxidant damage. Proc Natl Acad Sci U S A 1993;90:9285–9.
- Wagener FA, Eggert A, Boerman OC, Oyen WJ, Verhofstad A, Abraham NG, et al. Heme is a potent inducer of inflammation in mice and is counteracted by heme oxygenase. Blood. 2001;98:1802–11.
- Kristiansen M, Graversen JH, Jacobsen C, Sonne O, Hoffman HJ, Law SK, et al. Identification of the haemoglobin scavenger receptor. Nature. 2001;409:198–201.