Abstract
Background and objectives. Birth size curves are needed for clinical and epidemiological purposes. We constructed birth weight (BW), length (BL), and head circumference (BHC) references, assessed effects of twinness and parity, and defined cut-off points for small, appropriate, and large for gestational age.
Materials and methods. Birth register data of all 753,036 infants born in 1996–2008 in Finland were cleaned to create references reflecting optimal intrauterine growth. The final data included 533,666 singletons and 15,033 twins (median gestation weeks (gws) 40.0 and 37.1, respectively, 41.6% primiparous). Sex-specific BW, BL, and BHC references were constructed from 23 to 43 gws separately for singletons and twins born to primiparous or multiparous mothers. GAMLSS method was used for modelling.
Results. In singletons from 36 gws onwards, increased BW and BL were observed in comparison to previous reference from 1979–1983. Twins diverged from singletons from 30 gws onwards. At 37.0 gws, mean BW was 400 g lower and mean BL 1.2 cm shorter than in singletons. From 30 gws onwards, birth size was larger in infants of multiparous than primiparous mothers.
Conclusions. Population-based birth size references are available for the evaluation of birth size. Accounting for plurality and parity improves the accuracy of birth size evaluation.
Key messages
Regularly updated population-based birth size references are needed for the correct evaluation of newborn infants as small, appropriate, and large for gestational age.
Separate birth size references for singletons and twins of primi- or multiparous mothers improve the accuracy of birth size evaluation.
Introduction
At birth, newborn infants are classified as small, appropriate, or large for gestational age (SGA, AGA, or LGA) according to their birth size. In general, the infant's size at birth is an indicator of prenatal well-being, and its evaluation also provides a simple tool to estimate the risk of abnormal perinatal and long-term outcomes. Correct identification of SGA infants is important since these infants are at an increased risk of perinatal morbidity and mortality and long-term adverse consequences such as neurodevelopmental problems, adult-onset cardiovascular disease, and metabolic alterations (Citation1–3). Comparably to SGA, LGA also increases the risk of perinatal adverse outcomes, obesity, and metabolic syndrome later in life (Citation4–7). In addition, the attained birth size sets a starting-point for childhood growth monitoring: in SGA children, failure to catch up in growth is an indication for growth hormone therapy in most developed countries (Citation2,Citation8).
Up-to-date, population-specific references for birth weight, length, and head circumference are needed to evaluate birth size correctly (Citation9,Citation10), because approximately 50% of birth size is mediated by genetic factors, and average birth size differs when unique populations are studied (Citation9,Citation11). Environmental factors such as number of foetuses, parity, maternal size, medication, smoking, and nutrition also play a significant role in the attainment of a given birth size (Citation12). A secular change due to changes in these environmental factors has been observed in birth size in many countries, parallel to a secular change in adult height (Citation13–15). However, up-to-date population-based birth size references representing optimal foetal growth and based on contemporary large data sets are sparse. In Finland, the existing birth size reference dates back to the years 1979–1983 and is based on a sub-national sample (Citation16). Since then, the average adult height in Finnish women has increased by 1.9 cm (Citation17). Furthermore, there are no separate references for singletons and twins or means for adjusting for parity.
The aim of the present study was to construct population-based sex-specific birth size references (weight, length, head circumference) for correct assessment of birth size in singletons and twins of primiparous or multiparous mothers.
Methods
Study population and data cleaning
The Finnish National Institute for Health and Welfare (THL) has gathered data on all births and newborns in the Medical Birth Register since 1987. Data on the mother and the pregnancy include maternal age, smoking, chronic conditions, parity, assisted fertility treatments, pregnancy-associated conditions, and mode of delivery. Data on the newborn include gestation weeks based on the reported last menstrual period and ultrasound assessment, sex, perinatal mortality and hospitalization, twinning, congenital anomalies, and weight, length, and head circumference (HC) at birth. Virtually all deliveries in Finland take place in well-equipped secondary or tertiary care public hospitals regardless of social status or income level. The newborn measurement equipment and techniques in birth hospitals are standardized by the nationwide educative material (Citation18). The hospitals report the data collected both in primary or secondary care directly to The Finnish National Institute for Health and Welfare, and the coverage of the Medical Birth Register is practically 100%.
For the present study, we used the Birth Register data from 1 January 1996 to 31 December 2008. During the 13-year period, 753,036 infants were born in Finland. Since the aim was to create a birth size reference for singletons and twins with optimum intrauterine growth, we cleaned the data in several phases.
First, the weight, height, and HC observations were checked separately for possible outlier values. The outliers in weight values were scarce, and no weight values were excluded at this phase. In contrast to the weight, there were obvious outliers in length and HC values, probably as a result of measurement errors, typing errors, or true short stature or microcephalic conditions (Supplementary Figure 1 material to be found online at http://informahealthcare.com/doi/abs/10.3109/07853890.2013.803739). We made exclusions of length and HC based on quartiles. The distribution for both length and HC was symmetric with a stable interquartile range. Thus, we used the method which was used in the construction of references (described in the statistical methods) to define mean curves for length and HC as a function of gestational age, and then excluded all values which were 3.7 times the average interquartile range from the mean, which corresponds to five standard deviations from the mean in normal distribution. This excluded 299 length observations and 82 HC observations (Supplementary Figure 1 material to be found online at http://informahealthcare.com/doi/abs/10.3109/07853890.2013.803739). The subsequent data cleaning steps removed altogether 29.1% of the cases of the original birth cohort. First, we excluded all stillborn infants (n = 2659), infants with unknown gestational age (n = 3464), unknown gender (n = 44), triplets (n = 459), and those with missing birth weight (n = 266). In this phase, we had 746,093 infants with gestational age ranging from 21 to 44 weeks; birth length was missing from 0.5%, and HC from 64% of infants. Then, infants born with any congenital anomaly and reported at the perinatal period (2.1%) were excluded. Maternal exclusion criteria included smoking or unknown smoking status during pregnancy (17.2%), in vitro fertilization (0.8%), hypertensive condition (4.7%), or diabetes (4.3%) during pregnancy.
Reference curves for birth size are presented for singletons born between 23 and 43 gestation weeks and for twins born between 23 and 41 gestation weeks. After the cleaning procedures, the final database for the calculation of the birth size reference included 548,699 (51.0% male) infants (72.9% of the whole birth cohort of 1996–2008). Altogether 533,666 infants were singletons and 15,033 twins. The median maternal age was 29.9 years (range 13.0–53.1), the median length of pregnancy in singletons 40.0 weeks, and in twins 37.1 weeks. Of the mothers, 41.6% were primiparous. Altogether 83.6% of infants were delivered vaginally. summarizes the frequency of weight, length, and HC observations in singletons and twins by sex, gestation weeks, and maternal parity.
Table I. Frequencies of birth weight, length, and head circumference (HC) measurements by sex, gestation weeks, and maternal parity in singleton and twin boys (A), and in singleton and twin girls (B).
SGA was defined according to the International Societies of Pediatric Endocrinology and the Growth Hormone Research Society as a birth weight and/or length more than 2 standard deviations (SD) below the sex- and gestational age-specific reference mean (Citation2). LGA was defined as a birth weight and/or length 2 SD above the sex- and gestational age-specific reference mean. The Ethics committee of the Pohjois-Savo Health Care District gave its positive statement for the study. Permissions to use the register data in the study were obtained from the National Institute for Health and Welfare (THL). No contact with the study subjects was considered necessary since the data were analysed anonymously.
Statistical methods and curve validation
In the construction of curves for weight, length, and HC for gestational age, R statistical software and Generalized Additive Models for Location, Scale and Shape (GAMLSS package) was used in the analysis (Citation19). After the extensive cleaning procedure, which removed cases with conditions possibly affecting intrauterine growth, the birth weight, length, and HC were close to normally distributed, and the normal distribution assumption for response variables and cubic splines as a smoothing technique was used.
Two methods for calculation of variation were used. First, standard deviations (SD) were calculated from the weight, length, and HC data in all subgroups (SDd). Despite extensive Medical Birth Register data cleaning, prematurely born individuals are seldom ‘healthy’, and the growth in utero is often altered prior to the premature birth. Thus, the wide variation of the birth size in the low gestation weeks may not represent normal, healthy growth in utero but also pathology in growth. Variation based on the data was also very sensitive to values at the upper and lower limits, especially when the number of observations in the subgroups in low gestation weeks was relatively low ().
The second method for calculation of variation was based on the assumption of constant coefficient of variation (CV; SDc). This method is based on the original observation of Hadlock et al. (Citation20) who followed the foetal growth in 392 healthy pregnant women between 10 and 41 weeks of gestation by ultrasound and showed that, in case of optimal intrauterine environment in healthy mothers, the statistical variation of foetal weight in a given gestation week was a constant fraction of the mean. We adopted Hadlock's formula and calculated the constant CV at median gestational age of 40 weeks of singletons. In twins, the CVs were constantly slightly smaller than in singletons. At 37 gestation weeks (the median length of pregnancy in twins) the CVs both in twins and in singletons were larger than at 40 gestation weeks (for example, CV of birth weight in boys at 37 weeks 0.14 for singletons and twins, and at 40 gestation weeks 0.12 and 0.11, respectively). To avoid larger SDs in twins than in singletons, we chose to use the CV of singletons at 40 weeks in the formula for twins as well.
Validation of the birth size references with either SDd or SDc was performed in the uncleaned Medical Birth Register data. The proportions of SGA for weight at different gestation weeks were compared between the SD definitions. Also, proportions of newborns with SGA or LGA and an adverse neonatal outcome (need for prolonged hospitalization until day 7 of life or neonatal death) were compared. Sensitivity and specificity for the definitions of abnormal birth size (SGA and LGA using either SDd or SDc) in identification of newborns with adverse neonatal outcome were calculated. The Finnish reference curves were also compared to contemporary birth weight references from other populations.
The chi-square test was used for statistical comparisons. SPSS software version 19.0 (SPSS Inc., Chicago, IL) was used for statistical analyses. P values < 0.05 were considered statistically significant.
Results
Validation of the birth size reference
Mean and SDs obtained using variation from the data (SDd) or constant CV (SDc) of birth weight, length, and HC at different gestation weeks are given in Supplementary Tables I and II material to be found online at http://informahealthcare.com/doi/abs/10.3109/07853890.2013.803739. Use of SDc increased the proportion of preterm newborns classified as SGA or LGA in comparison to use of SDd. For example, 9.9% versus 4.0% of singleton boys born below 37 gestation weeks, and 2.7% versus 2.6% of singleton boys born at 37–42 gestation weeks were classified as SGA for weight if SDc or SDd were used, respectively. The corresponding proportions for LGA were 6.5% versus 3.6% below 37 gestation weeks and 2.9% and 2.7% at 37–42 weeks (Supplementary Table III material to be found online at http://informahealthcare.com/doi/abs/10.3109/07853890.2013.803739).
To compare the utility of the birth size reference with either SDc or SDd in the clinical practice in detecting neonates with adverse outcome, the uncleaned Finnish birth cohort data between 1996 and 2008 were evaluated. Among those who died neonatally during that period, 17.9% were SGA defined with SDc versus 11.9% with SDd (P < 0.0001, chi-square test); and 7.1% versus 3.3% were LGA with SDc or SDd, respectively (P < 0.0001). Among infants who needed prolonged hospitalization (stayed at hospital at day 7), 11.3% versus 7.1% were SGA, and 5.9% versus 4.1% were LGA, defined either with SDc or SDd, respectively (P < 0.0001).
Sensitivity of the abnormal birth size (SGA or LGA) defined with SDc in identification of neonates with adverse neonatal outcome (death or prolonged hospitalization) was 20.5% in comparison to 11.2% using definition with SDd (with no difference in specificity; 94.6% versus 95.2%, respectively). Because the validation showed that curves constructed with SDc instead of SDd could differentiate better the newborns at risk for adverse neonatal outcome, use of SDc was selected for further analyses.
Birth size reference curves for singletons
shows the birth weight, length, and HC reference curves for singleton boys and girls born 1996–2008 (numerical data in Supplementary Table IA material to be found online at http://informahealthcare.com/doi/abs/10.3109/07853890.2013.803739). A secular change in birth weight and length was observed in Finland between the two time periods of 1979–1983 and 1996–2008 (). In the present population, singleton boys and girls born after 36 gestation weeks were slightly heavier than in the older reference population born 1979–1983 (Citation16). At 40 gestation weeks, the mean birth weight was 3766 g and 3624 g in singleton boys and girls, respectively, in comparison to 3680 g and 3539 g in the previous reference. Consequently, the weight limits for SGA at term (40 gestation weeks) have increased from 2760 g to 2892 g in boys, and from 2654 g to 2783 g in girls. For LGA, the weight limit at term has increased from 4538 g to 4640 g in boys, and from 4366 g to 4465 g in girls at 40 gestation weeks.
Figure 1. Mean (± 2 SD) birth weight, length, and head circumference (HC) references for gestational age in singleton boys and girls born in Finland in 1996–2008. (The numerical data are given in Supplementary Table IA.).
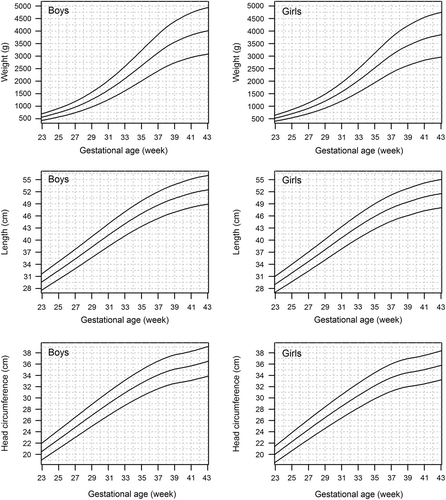
Figure 2. Change in the mean birth weight (right) and length (left) of singleton boys and girls from 1979–1983 (Citation16) to 1996–2008 (current data) in Finland. Curves indicate the difference from the population of 1979–1983. Solid line = boys born 1996–2008; dashed line = girls born 1996–2008.
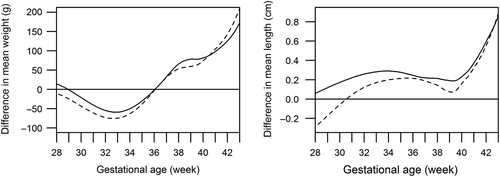
A minor change in birth length was observed from as early as 30 gestation weeks onwards in both sexes. At term, the mean birth length was 51.3 cm in boys and 50.4 cm in girls, in comparison to 51.0 cm in boys and 50.2 cm in girls in the older reference. The length limit for SGA at 40 gestation weeks has risen only 0.3 cm in both sexes (from 47.5 cm to 47.8 cm in boys and from 46.7 to 47.0 cm in girls). In contrast to birth weight and length, there was no evident change in HC.
Effect of plurality on birth size
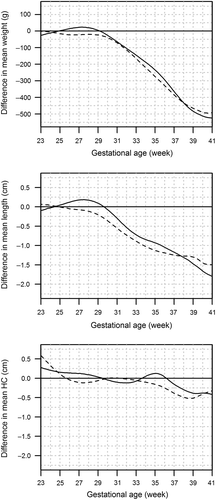
Birth weight and length references for twins born at 23–40 gestation weeks are shown in Supplementary Figure 2 material to be found online at http://informahealthcare.com/doi/abs/10.3109/07853890.2013.803739 and numerical data for the curve construction in Supplementary Table IB material to be found online at http://informahealthcare.com/doi/abs/10.3109/07853890.2013.803739. There was a clear-cut and linearly increasing difference in birth weight and length between singletons and twins from 30 gestation weeks onwards, but only a minor and later difference in HC (). At 37 weeks of gestation (the median length of gestation in twins), the mean birth weight in twin boys was 395 g lower than in singleton boys and in twin girls, 407 g lower than in singleton girls. Similarly, the SGA weight limit in a twin girl was 213 g lower than in a SGA singleton girl at 37 gestation weeks, and in a twin boy, 303 g lower than his singleton counterpart. At 37 gestation weeks, twin boys were on average 1.2 cm shorter than singleton boys, and twin girls 1.3 cm shorter than singleton girls ().
Figure 3. Timing and magnitude of intrauterine growth difference between singletons and twins. Curves indicate the mean difference from the singleton newborns of same sex and gestational age. Solid line = twin boys; dashed line = twin girls. A: Difference in mean birth weight by gestational age; B: Difference in mean birth length by gestational age; C: Difference in birth head circumference (HC) by gestational age.
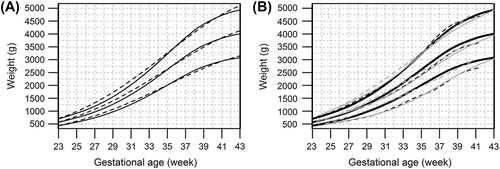
Effect of parity on birth size
demonstrates the effect of parity on birth weight, length, and HC (numerical data in Supplementary Table II material to be found online at http://informahealthcare.com/doi/abs/10.3109/07853890.2013.803739). At all gestation weeks, but most evidently from 30 gestation weeks onwards, multiparous mothers had heavier babies than primiparous mothers. In singletons at 40 gestation weeks, the difference in the mean weight of newborns of primi- and multiparous women was 187 g in boys and 174 g in girls. In twins at 37 gestation weeks, the difference in the mean weight of newborns according to parity was 161 g and 134 g in boys and girls, respectively.
Figure 4. Effect of parity on birth size. Sex-specific birth weight, length, and head circumference (HC) curves for primipara (black) and multipara (grey) singletons (solid lines) and twins (dotted lines). (The numerical data are given in Supplementary Table II.).
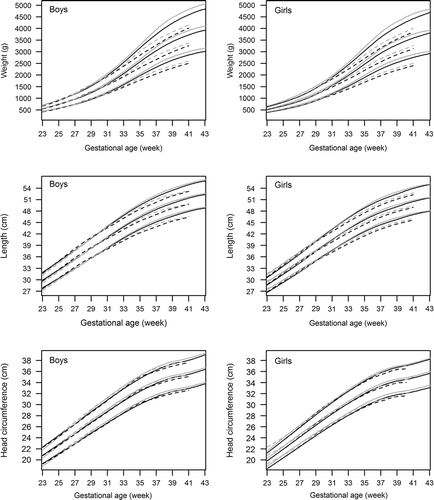
A similar trend was observed in birth length and HC, but the differences between babies of primiparous and multiparous women were only minor. At 40 gestation weeks, singleton boys and girls born to multiparous women were both on average 0.4 cm taller than those born to primiparous women. Singleton boys and girls born to multiparous women had 0.4 cm and 0.3 cm larger HC than those of primiparous women. The differences in length and HC were slightly greater in twins at 37 gestation weeks born to primiparous versus multiparous mothers, 0.7 cm and 0.5 cm in twin boys and 0.5 cm and 0.3 cm in twin girls.
As an example, the difference in SGA weight limits at 40 gestation weeks between multipara and primipara is 145 g in singleton boys and 134 g in singleton girls.
Discussion
We developed new population-based birth size references for singletons and twins. The advantages of these curves are the use of a large, contemporary population-based sample of newborn infants, careful exclusion of subjects with factors potentially affecting birth size, up-to-date statistical methods in curve construction, and the option for adjustment of birth size to plurality and maternal parity. In addition to references for birth weight, the vast number of infants allowed for the generation of references for birth length and birth head circumference for singletons and twins separately. The validation of the reference curves in the unselected birth cohort showed that these references work in practice: they identified as SGA (birth weight below 2 SD) nearly 10% of infants born below 37 gestation weeks, whereas 2.2% of infants, as assumed according to the normal distribution, born at 40 gestation weeks were classified as SGA.
A major strength of the present study is the use of a birth register including detailed and unselected data on maternal health, pregnancy, and the newborn. The initial database included the entire newborn population of Finland over a period of 13 years. Series of exclusions were made to create birth size references as close to birth size standards as possible, i.e. curves that reflect optimal, healthy, linear growth of newborns who fully expressed their growth potential (Citation21–23). After the cleaning procedures, we ended up using data of 548,699 newborn infants and their mothers (73% of the whole birth cohort of 1996–2008). This is among the largest and most extensively cleaned contemporary databases used for birth size references in Europe or North America (Citation24–28). We also compared two statistical methods for calculating variation, and provide SD values obtained in either way for curve construction (Supplementary Tables I and II material to be found online at http://informahealthcare.com/doi/abs/10.3109/07853890.2013.803739). Our validation experiments showed that use of birth size references with the assumption of constant coefficient of variation in definition of SGA or LGA identified better the newborns at risk for neonatal death or hospitalization, and these were selected for further comparisons in our study. We also compared the birth weight reference of singleton boys to the recently generated method for calculating birth weight reference using population-based birth weight data at 40 gestation weeks, as demonstrated in (Citation29). Mikolajczyk et al. validated their birth weight references in various populations and found that these identify SGA infants with a high incidence of perinatal adverse effects well. However, the method by Mikolajczyk et al. requires population-based data at term and is generated for birth weight and in singletons only. Therefore, it is not interchangeable with the present birth size references.
Figure 5. A: Comparison of the birth weight reference of singleton boys (black solid line) to the reference calculated according to the method by Mikolajczyk et al. (Citation29) using population-based birth weight data at 40 gestation weeks (black dashed line). B: Comparison of the birth weight reference of Finnish singleton boys (black solid line) to the birth weight curves of Swedish boys (grey dashed line) (Citation26), UK boys (grey solid line) (Citation25), and US boys (black dashed line) (Citation27). The lines indicate 2nd, 50th, and 98th centiles corresponding to the mean and ± 2 SD curves in normal distribution.
There are significant differences in birth size between populations (Citation24–28). At 40 gestation weeks, Finnish newborns were markedly heavier than British or North American newborns (Citation25,Citation27) but are of almost identical weight with Swedish term newborns (Citation26) (). In Western countries with comparable welfare as regards health care and maternal nutrition, these differences in term birth weight probably originate mainly from differences in genetic background, further supporting the need for and use of population-based references instead of multi-ethnic ones. However, also other factors, including quality of data cleaning procedure, and statistical methods used in curve construction, must be taken into account when comparing birth size reference curves, especially in low gestation weeks.
A trend towards larger birth size was observed also in comparison to the previous Finnish birth size reference from 1979 to 1983 (Citation16): at 40 gestation weeks, boys and girls were around 130 g heavier and 0.3 cm taller. A trend towards larger birth size has also been observed in many Western countries, and it has been speculated that obesity and the increased prevalence of gestational diabetes play a role in the process. Increased maternal weight may have played a role in the secular birth weight change in Finland as well, since the trend of increasing overweight among women at fertile age has been observed. Prevalence of overweight or obesity among women aged 25–34 years has increased from 16% in 1978–1982 to 26%–28% in 1996–2006 (Citation30). In our reference data, maternal BMI was only available for the years 2006–2008, and during the 3-year period 7.1% of the mothers were obese (pre-pregnancy BMI 30.0 or over) and 18.6% overweight (BMI 25.0–29.9). Unfortunately the maternal BMI has not been registered in the Medical Birth Register uniformly during the whole of the study period 1996–2008, and not at all in the cohort of the previous reference 1979–1983 (Citation16). Thus the exact effect of maternal obesity on the birth weight trend remains unclear.
In recent years, it has been suggested that the optimal way to evaluate birth weight as small, normal, or large is the use of customized references. Customization is performed according to sex, gestational age, genetic background, parity, and maternal size using mathematical modelling created by Gardosi et al. (Citation31). Large observational studies have suggested that customized growth charts differentiate constitutional and pathologic small size better than population-based charts (Citation32–34), although controversial opinions exist (Citation35–40). The limitation of our data was that we could not relate birth size to maternal size. However, the impact of maternal size on birth size is minor in comparison to other factors such as gestational age, sex, plurality, or parity (Citation41,Citation42).
Joseph et al. (Citation42) demonstrated in their vast epidemiological study with over 17 million singletons and twins that plurality-specific birth weight references are needed for the correct identification of twins at risk of neonatal adverse events. However, birth weight references for twins are scarce and mostly based on hospital material instead of population-based data (Citation43–46). Neither are there references for birth length or HC in twins. Our results clearly indicate that birth weight and length, but not HC, of twin girls and boys diverge progressively from those of singletons from 30 gestation weeks onwards. Previous findings on the timing of birth weight differences between twins and singletons are controversial, but so far the largest existing data comparing 3,500,000 singletons and 450,000 twins showed similar differences in birth weight at 30 gestation weeks (Citation47). After 30 weeks of gestation, the evaluations of birth weight and length in twins are therefore misclassified, and false diagnoses of SGA are given if the curves for singletons are used.
There is some controversy as to whether maternal parity should be taken into account in evaluating birth size. According to Gardosi et al. (Citation48), a non-smoking white British mother in her first pregnancy is expected to have a baby weighing 108.0 g less than a mother in her second pregnancy at 40 gestation weeks. A similar difference was observed in a more recent French study: the difference between the birth weights of the first and second births was 110.3 g, whereas birth weight differences between the third and fourth births or the third and higher than fourth births are less important (+25.2 and +11.4 g) (Citation49). In our study, the average difference of birth weight between the first and subsequent births was considerably larger, 174.0 and 187.0 g in girls and boys at 40 gestation weeks, respectively. The total fertility rate in Finnish women since 2001 has been varying annually from 1.72 to 1.87, indicating that our birth weight difference reflects mainly the differences between the first and second births (Citation50). Therefore, accounting for parity in evaluating birth size seems to play an even more important role in Finland than among some other European populations, and will aid in identifying the SGA and LGA infants more precisely.
In conclusion, birth size references are needed for both epidemiological and clinical purposes. Correct classification of individual birth size into SGA, AGA, and LGA requires population-based references stratified for sex and parity for singletons and twins separately. Increasing evidence shows that both SGA and LGA diagnoses at birth carry life-long consequences, and therefore a careful evaluation of each infant at birth hospitals is warranted.
http://informahealthcare.com/doi/10.3109/07853890.2013.803739
Download PDF (884.9 KB)Declaration of interest: This work was supported by the Kuopio University Hospital, the Paediatric Research Foundation, the National Graduate School of Clinical Investigation, and the Finnish Funding Agency for Technology and Innovation (Tekes). None of the study sponsors has participated in designing the study, analysing the data, writing the report, or submitting it for publication. None of the authors has financial relationships with the funders. The authors report no conflicts of interest.
References
- Barker DJ. The developmental origins of adult disease. J Am Coll Nutr. 2004;23(Suppl):588S–95S.
- Clayton PE, Cianfarani S, Czernichow P, Johannsson G, Rapaport R, Rogol A. Management of the child born small for gestational age through to adulthood: a consensus statement of the International Societies of Pediatric Endocrinology and the Growth Hormone Research Society. J Clin Endocrinol Metab. 2007;92:804–10.
- Norris SA, Osmond C, Gigante D, Kuzawa CW, Ramakrishnan L, Lee NR, et al. Size at birth, weight gain in infancy and childhood, and adult diabetes risk in five low- or middle-income country birth cohorts. Diabetes Care. 2012;35:72–9.
- Raio L, Ghezzi F, Di Naro E, Buttarelli M, Franchi M, Durig P, et al. Perinatal outcome of fetuses with a birth weight greater than 4500 g: an analysis of 3356 cases. Eur J Obstet Gynecol Reprod Biol. 2003; 109:160–5.
- Boney CM, Verma A, Tucker R, Vohr BR. Metabolic syndrome in childhood: association with birth weight, maternal obesity, and gestational diabetes mellitus. Pediatrics. 2005;115:e290–6.
- Eyzaguirre F, Bancalari R, Roman R, Silva R, Youlton R, Urquidi C, et al. Prevalence of components of the metabolic syndrome according to birthweight among overweight and obese children and adolescents. J Pediatr Endocrinol Metab. 2012;25:51–6.
- Cnattingius S, Villamor E, Lagerros YT, Wikstrom AK, Granath F. High birth weight and obesity—a vicious circle across generations. Int J Obes (Lond). 2012;36:1320–4.
- Lee PA, Chernausek SD, Hokken-Koelega AC, Czernichow P; International Small for Gestational Age Advisory Board. International Small for Gestational Age Advisory Board consensus development conference statement: management of short children born small for gestational age, April 24-October 1, 2001. Pediatrics. 2003;111(Pt 1):1253–61.
- Hemming K, Hutton JL, Glinianaia SV, Jarvis SN, Platt MJ. Differences between European birthweight standards: impact on classification of ‘small for gestational age’. Dev Med Child Neurol. 2006;48:906–12.
- Bertino E, Milani S, Fabris C, De Curtis M. Neonatal anthropometric charts: what they are, what they are not. Arch Dis Child Fetal Neonatal Ed. 2007;92:F7–10.
- Lunde A, Melve KK, Gjessing HK, Skjaerven R, Irgens LM. Genetic and environmental influences on birth weight, birth length, head circumference, and gestational age by use of population-based parent-offspring data. Am J Epidemiol. 2007;165:734–41.
- Voigt M, Rochow N, Jahrig K, Straube S, Hufnagel S, Jorch G. Dependence of neonatal small and large for gestational age rates on maternal height and weight—an analysis of the German Perinatal Survey. J Perinat Med. 2010;38:425–30.
- Johnson W, Choh AC, Soloway LE, Czerwinski SA, Towne B, Demerath EW. Eighty-year trends in infant weight and length growth: the Fels longitudinal study. J Pediatr. 2012;160:762–8.
- Lahmann PH, Wills RA, Coory M. Trends in birth size and macrosomia in Queensland, Australia, from1988 to 2005. Paediatr Perinat Epidemiol.2009;23:533–41.
- Schack-Nielsen L, Molgaard C, Sorensen TI, Greisen G, Michaelsen KF. Secular change in size at birth from 1973 to 2003: national data from Denmark. Obesity (Silver Spring). 2006;14:1257–63.
- Pihkala J, Hakala T, Voutilainen P, Raivio K. Characteristic of recent fetal growth curves in Finland. Duodecim. 1989;105:1540–6.
- Saari A, Sankilampi U, Hannila ML, Kiviniemi V, Kesseli K, Dunkel L. New Finnish growth references for children and adolescents aged 0 to 20 years: length/height-for-age, weight-for-length/height, and body mass index-for-age. Ann Med. 2011;43:235–48.
- Mäki P, Wikström K, Hakulinen-Viitanen T, Laatikainen T, editors. Health checkups at well-child clinics. Methodological handbook. Juvenes Print, Tampere, Finland 2011.
- Stasinopoulos DM, Rigby RA. Generalized Additive Models for Location Scale and Shape (GAMLSS) in R. Journal of Statistical Software. 2007;23(7):1–46.
- Hadlock FP, Harrist RB, Martinez-Poyer J. In utero analysis of fetal growth: a sonographic weight standard. Radiology. 1991;181:129–33.
- Zhang J, Merialdi M, Platt LD, Kramer MS. Defining normal and abnormal fetal growth: promises and challenges. Am J Obstet Gynecol. 2010; 202:522–8.
- Reeves S, Bernstein IM. Optimal growth modeling. Semin Perinatol. 2008;32:148–53.
- Bertino E, Giuliani F, Occhi L, Spada E, De Curtis M, Coscia A, et al. Benchmarking neonatal anthropometric charts published in the last decade. Arch Dis Child Fetal Neonatal Ed. 2009;94:F233.
- Bertino E, Spada E, Occhi L, Coscia A, Giuliani F, Gagliardi L, et al. Neonatal anthropometric charts: the Italian neonatal study compared with other European studies. J Pediatr Gastroenterol Nutr. 2010;51: 353–61.
- Cole TJ, Williams AF, Wright CM; RCPCH Growth Chart Expert Group. Revised birth centiles for weight, length and head circumference in the UK-WHO growth charts. Ann Hum Biol. 2011;38:7–11.
- Niklasson A, Albertsson-Wikland K. Continuous growth reference from 24th week of gestation to 24 months by gender. BMC Pediatr. 2008; 8:8.
- Olsen IE, Groveman SA, Lawson ML, Clark RH, Zemel BS. New intrauterine growth curves based on United States data. Pediatrics. 2010;125:e214–24.
- Visser GH, Eilers PH, Elferink-Stinkens PM, Merkus HM, Wit JM. New Dutch reference curves for birthweight by gestational age. Early Hum Dev. 2009;85:737–44.
- Mikolajczyk RT, Zhang J, Betran AP, Souza JP, Mori R, Gulmezoglu AM, et al. A global reference for fetal-weight and birthweight percentiles. Lancet. 2011;377:1855–61.
- Helakorpi S, Holstila A-L, Virtanen S, Uutela A. Health behaviour and health among the Finnish adult population, spring 2011. Report 45/2012. Helsinki: National Institute for Health and Welfare (THL); 2012.
- Gardosi J, Chang A, Kalyan B, Sahota D, Symonds EM. Customised antenatal growth charts. Lancet. 1992;339:283–7.
- Clausson B, Gardosi J, Francis A, Cnattingius S. Perinatal outcome in SGA births defined by customised versus population-based birthweight standards. BJOG. 2001;108:830–4.
- Figueras F, Figueras J, Meler E, Eixarch E, Coll O, Gratacos E, et al. Customised birthweight standards accurately predict perinatal morbidity. Arch Dis Child Fetal Neonatal Ed. 2007;92:F277–80.
- Mongelli M, Figueras F, Francis A, Gardosi J. A customized birthweight centile calculator developed for an Australian population. Aust N Z J Obstet Gynaecol. 2007;47:128–31.
- Carberry AE, Gordon A, Bond DM, Hyett J, Raynes-Greenow CH, Jeffery HE. Customised versus population-based growth charts as a screening tool for detecting small for gestational age infants in low-risk pregnant women. Cochrane Database Syst Rev. 2011; (12)12:CD008549.
- Cha HH, Lee SH, Park JS, Woo SY, Kim SW, Choi SJ, et al. Comparison of perinatal outcomes in small-for-gestational-age infants classified by population-based versus customised birth weight standards. Aust N Z J Obstet Gynaecol. 2012;52:348–55.
- Groom KM, Poppe KK, North RA, McCowan LM. Small-for- gestational-age infants classified by customized or population birthweight centiles: impact of gestational age at delivery. Am J Obstet Gynecol. 2007;197:239.e1–5.
- Hemming K, Hutton JL, Bonellie S. A comparison of customized and population-based birth-weight standards: the influence of gestational age. Eur J Obstet Gynecol Reprod Biol. 2009;146:41–5.
- Zhang X, Platt RW, Cnattingius S, Joseph KS, Kramer MS. The use of customised versus population-based birthweight standards in predicting perinatal mortality. BJOG. 2007;114:474–7.
- Hutcheon JA, Zhang X, Platt RW, Cnattingius S, Kramer MS. The case against customised birthweight standards. Paediatr Perinat Epidemiol. 2011;25:11–16.
- Hutcheon JA, Zhang X, Cnattingius S, Kramer MS, Platt RW. Customised birthweight percentiles: does adjusting for maternal characteristics matter?BJOG. 2008;115:1397–404.
- Joseph KS, Fahey J, Platt RW, Liston RM, Lee SK, Sauve R, et al. An outcome-based approach for the creation of fetal growth standards: do singletons and twins need separate standards?Am J Epidemiol. 2009; 169:616–24.
- Glinianaia SV, Skjaerven R, Magnus P. Birthweight percentiles by gestational age in multiple births. A population-based study of Norwegian twins and triplets. Acta Obstet Gynecol Scand. 2000;79:450–8.
- Buckler JM, Green M. Birth weight and head circumference standards for English twins. Arch Dis Child. 1994;71:516–21.
- Rydhstrom H. Discordant birthweight and late fetal death in like- sexed and unlike-sexed twin pairs: a population-based study. Br J Obstet Gynaecol. 1994;101:765–9.
- Gielen M, Lindsey PJ, Derom C, Loos RJ, Souren NY, Paulussen AD, et al. Twin-specific intrauterine ‘growth’ charts based on cross-sectional birthweight data. Twin Res Hum Genet. 2008;11:224–35.
- Grande R, Escalante JM, Hernandez M, Ezcurdia MA. [Birth weight in twins (author’s transl)]. An Esp Pediatr. 1976;9:353–63.
- Gardosi J, Mongelli M, Wilcox M, Chang A. An adjustable fetal weight standard. Ultrasound Obstet Gynecol. 1995;6:168–74.
- Ego A, Subtil D, Grange G, Thiebaugeorges O, Senat MV, Vayssiere C, et al. Should parity be included in customised fetal weight standards for identifying small-for-gestational-age babies?Results from a French multicentre study. BJOG. 2008;115:1256–64.
- Official Statistics of Finland (OSF). Births [e-publication]. ISSN = 1798-2413. 2011, Appendix table 1. Total fertility rate by region 2001–2011. Helsinki: Statistics Finland. Available at: http://www.stat.fi/til/synt/2011/synt_2011_2012-04-13_tau_001_en.html. (accessed 7 May 2012).