
Abstract
Background. The level at which low-level lead exposure produces subclinical adverse health effects in adults remains to be established. Methods. The Study for Promotion of Health in Recycling Lead (SPHERL) will enroll 500 newly hired workers, whose blood lead during 2 years of follow-up is expected to increase from levels less than 2 μg/dl, as currently observed in the US population, to 20–30 μg/dl. The main outcome variables to be studied are (i) blood pressure (BP) analyzed as a continuous or categorical variable, both cross-sectionally and longitudinally, and using conventional and ambulatory BP measurement; (ii) indexes of glomerular and tubular renal function, (iii) heart rate variability analyzed in the frequency domain as measure of autonomous sympathetic modulation, (iv) peripheral nerve conductivity velocity, (v) neurocognitive performance, and (vi) quality of life. Expected outcomes. Assuming a 10-fold increase in blood lead, SPHERL will have sufficient statistical power to detect over 2 years a steepening of the age-related rise in systolic BP from 1 to 5 mmHg and a doubling of the age-related decline in the estimated glomerular filtration rate from 3.5 to 7.0 ml/min/1.73 m2. The longitudinal design of our study complies with the temporality principle of the Bradford–Hill criteria for assessing possible causality between outcomes and exposure. SPHERL will attempt to resolve the apparent contradiction between general population studies showing associations between adverse health effects and low lead exposure with blood lead levels below 5 μg/dl and studies conducted in occupational cohorts indicating that adverse effects of lead exposure occur at much higher blood lead levels.
Trial registration: ClinicalTrials.gov identifier: NCT02243904.
Introduction
High-level lead exposure causes hypertension and renal dysfunction (Citation1,Citation2). However, there is no general agreement as to whether low-level lead exposure increases blood pressure (BP) or affects renal function. In a meta-analysis of 58 518 subjects (Citation1), recruited from the general population in 119 surveys and from occupationally exposed groups in 12 studies, a twofold increase in blood lead concentration was associated with a 1.0-mmHg increase in systolic BP () and a 0.6-mmHg increase in diastolic BP. In a population study of renal function, blood lead ranged from 1.7 to 60.3 μg/dl (geometric mean = 7.5 μg/dl) in women and from 2.3 to 72.5 μg/dl (mean = 11.4 μg/dl) in men (Citation2). In both women and men (), creatinine clearance was inversely correlated with blood lead, suggesting that low-level lead exposure may impair renal function (Citation2). However, because of the cross-sectional design, the alternative hypothesis that renal impairment may increase the blood lead concentration could not be excluded (Citation2).
Figure 1. Change in the systolic pressure (association size in mmHg with 95% confidence interval) associated with a doubling of the blood lead concentration. Circles represent individual groups and squares the combined association size. Open circles denote groups for whom a non-significant systolic association size was assumed to be zero. C, Caerphilly Study; HP, Welsh Heart Program; W, Whites; B, Blacks; NI, Non-immigrants; I, Immigrants; FW, Foundry Workers; CS, Civil Servants; P, PheeCad (Public Health and Environmental Exposure to Cadmium) Study. Reproduced with permission from ref. (Citation1).
Table I. Determinants of the measured creatinine clearance rate.
Following the studies referenced above (Citation1,Citation2), other investigators have published a number of epidemiological (Citation3–15) and experimental (Citation16,Citation17) studies that described associations between lead exposure and adverse effects upon BP (Citation3–6), cardiovascular (Citation7,Citation8,Citation16) or renal (Citation9–14,Citation17) function outcomes, or on the autonomic nervous system (Citation15). Most, albeit not all (Citation4–6,Citation8,Citation13,Citation14), of these epidemiological studies had a cross-sectional design (Citation3,Citation7,Citation9–12,Citation15). Agencies, such as the European Food Safety Authority (EFSA) (Citation18), the National Toxicology Program (Citation19) and the Environmental Protection Agency (EPA) in the USA (Citation20,Citation21), considered these studies in weight-of- the-evidence analyses (Citation22), which suggested that blood lead levels as low as 5 μg/dl might be associated with adverse effects. However, the ensuing consensus documents (Citation18,Citation20,Citation21,Citation23) based on general population epidemiological data are in apparent conflict with the scientific literature on the effects of lead exposure in workers, which suggest that effects on the cardiovascular, renal and autonomous nervous systems occur at much higher blood lead levels. The explanations commonly put forward for the apparent contradiction between general population epidemiological and occupational studies are higher statistical power in large epidemiological populations relative to smaller occupational cohorts and selection bias, often referred to as the healthy worker effect (Citation24). However, other variables, such as uncertainties in the lead exposure history, unaddressed confounders, insufficient quality control for evaluation of the phenotype of interest, and the timing of lead exposure relative to onset of associated effects have not yet been satisfactorily addressed. The Study for Promotion of Health in Recycling Lead (SPHERL) will address the aforementioned issues in a longitudinal study of workers whose blood lead levels will rise from general population to occupational exposure levels.
Design and research objectives
SPHERL is a prospective 2-year follow-up study of lead workers with exposure levels varying between and within individuals. SPHERL will address the extent to which between-subject differences or within-subject changes in lead exposure may have a measurable impact on BP, the cardiovascular system, renal function, the autonomic nervous system, peripheral nerve conduction velocity, neurocognitive function and quality of life. The longitudinal design of SPHERL complies with the Bradford–Hill criteria (Citation25) to assess possible causality between adverse health outcomes and exposure to a toxic substance.
General design
The medical and nursing staff of lead recycling and battery manufacturing plants in North America will enroll and organize a 2-year follow-up of workers in two strata: (i) new hires without previous occupational lead exposure who will be performing tasks with lead exposure or current employees without previous occupational lead exposure, who anticipate moving to jobs with lead exposure; and (ii) new hires without previous occupational lead exposure who do not anticipate performing tasks with lead exposure within 2 years. The projected increase in blood lead in stratum 1 is from levels currently observed in the US population, 1.51 μg/dl in NHANES IV (Citation3), to 20–30 μg/dl. Workers in stratum 2 will experience a minimal increase in exposure, share the same living environment as the exposed workers, and might serve as a control group in sensitivity analyses using a nested-case-control design. The possibility of selection bias needs to be considered when generalizing findings because some of the eligible subjects may not participate in this survey. The medical services at the plants will keep a log of workers invited to take part in SPHERL. The information to be recorded for non-participants will consist of ethnicity, sex, age, height and weight, and the main reason for declining participation. These data will serve to compute the participation rate among invitees and to assess the generalizability of the SPHERL findings by comparing non-participants with participants.
The Studies Coordination Centre in Leuven, Belgium, will function as coordinating office for SPHERL and be responsible for database construction, statistical analysis and drafting scientific reports. SPHERL complies with the Declaration of Helsinki for studies in human volunteers (Citation26). All participants will provide informed written consent. The Institutional Review Board overseeing biomedical research at the University of Leuven approved the study protocol. The Studies Coordination Centre complies with the Belgian legislation on the protection of private information (http://www.privacycommission.be/). The databases managed at the Studies Coordinating Centre are registered with the Privacy Commission (Brussels, Belgium). Its members are experts in the protection of privacy and of personal data and apply standards that are internationally agreed upon (http://www.privacycommission.be/sites/privacycommission/files/documents/international_standards_madrid_2009.pdf).
Primary and secondary outcomes
Longitudinal outcomes in individual participants
The primary endpoint of SPHERL is the annual change in systolic BP, as measured by 24-h ambulatory monitoring, associated with changes in the blood lead concentration from occupational lead exposure. BP related secondary endpoints will be evaluated in the longitudinal analyses and will include changes in the conventionally measured office BP and the incidence of hypertension on ambulatory monitoring or office measurement. Other secondary endpoints are changes in: (i) the central hemodynamics, including aortic BP, the central systolic augmentation index and aortic pulse wave velocity; (ii) ECG-derived indexes; (iii) glomerular and tubular renal function measured on a continuous scale; (iv) the incidence of renal dysfunction; (v) alterations in the autonomic nervous cardiovascular modulation, as assessed by heart rate variability; (vi) nerve conduction velocity; (vii) neurocognitive function; and (viii) self-assessed quality of life.
Cross-sectional analyses
As the study progresses, cross-sectional analyses based on data accrued annually will form the basis for interim reports and quality assurance.
Sample size
With two-sided significance set at 5% and power set at 90%, approximately 260 participants must be followed up for 2 years to demonstrate a significant increase in the 24-h systolic BP and a significant decline of the estimated glomerular filtration rate (eGFR) with increasing blood lead over a 2-year follow-up. Because the anticipated attrition rate over 2 years is projected to be as high as 50%, approximately 500 participants must be enrolled. Previous observations in our population studies (Citation2,Citation6) informed these sample size calculations. For BP (Citation6), we assumed that (i) a 10-fold increase in the blood lead concentration will steepen the age-related rise in BP over 2 years from 1 to 5 mmHg systolic, and that (ii) the SDs for of the within-subject changes are 10 mmHg for systolic BP and 0.5 for the logarithmically transformed blood lead concentration. The decrease in eGFR with aging 2 years was estimated from the regression coefficients shown in . For eGFR (Citation2), we additionally assumed that a 10-fold increase in blood concentration will double the 2-year age-related decrease in eGFR from 3.5 to 7.0 ml/min/1.73 m2 with a within-subject SD of the changes equal to 10 ml/min/1.73 m2. eGFR will be primarily derived from cystatin C (Citation27), but for reasons of comparability with the existing literature, creatinine-based methods will also be used (Citation28,Citation29). Compared with serum creatinine, cystatin C levels are less dependent on ethnicity, sex, age and muscle mass or protein intake, and eGFR based on cystatin C is superior to creatinine-based methods in assessing serial changes in eGFR (Citation30).
Procedures and measurements
The study involves a physical examination, administration of questionnaires, measurement of BP, cardiovascular and renal function, autonomic nervous tone, peripheral nerve conduction velocity and neurocognitive performance, and tests on blood and fresh urine samples. Before examination at baseline and at the two annual follow-up visits, the workers will refrain from smoking, drinking alcohol or caffeinated beverages and heavy physical activity for at least 3 h.
Physical examination
Trained nurses will measure body weight and height, waist and hip circumference, skinfolds and body composition. A tape measure will be used to determine the waist and hip circumferences. The umbilicus and greater trochanter will be the landmarks for measuring waist and hip circumference. Skinfolds will be measured at the left side of the workers’ body, using a caliper providing a constant pressure of 0.01 kg/mm2 (0.098 N/mm2)± 10% at all openings of the 90-mm2 anvils (Harpenden caliper, Baty International, Burgess Hill, West Sussex, UK). The subscapular, triceps and anterior suprailiac skinfolds will be determined at the inferior angle of the scapula, the mid portion of the triceps, and just above the spina iliaca anterior superior, respectively. For measurement of body composition, the nurses will use the Bodystat® QuadScan 4000 (Bodystat Ltd., Isle of Man, UK). This device applies scientifically validated principles of bio-electrical impedance (Citation31) and provides detailed information on a large number of variables, including lean and fat free mass, body fat mass index, fat free mass index, and the distribution of total body water over the intra- and extra-cellular space (http://www.bodystat.ca/QSeries/Product3-Details/QuadScan-4000.aspx).
Questionnaires
We will use a standardized and validated questionnaire, inquiring about each worker's medical history, occupations, exposure to heavy metals, smoking and drinking habits, intake of medications and lifestyle. The energy spent in physical activity will be calculated from the time devoted to sports and physical labor with use of published tables. The questionnaire also provides information on the menstrual status of women. The EQ-5D questionnaire will be the instrument to assess quality of life. The EQ-5D allows generating utilities, and consequently quality-adjusted life years (QALYs) in relation to the level of lead exposure. Several articles (Citation32) describe the development of statistical models for generating population-based EQ-5D preference weights specific for the USA.
Assessment of the cardiovascular system
Office BP
Current guidelines (Citation33) and a stringent quality control program (Citation34) will be applied to record the office and 24-h ambulatory BP. At the enrolment visit, nurses will measure upper arm circumference. Standard cuffs have a 12 × 24 cm inflatable portion, but if upper arm girth exceeds 31 cm, larger cuffs with 15 × 35 cm bladders should be used. BP measurements will be obtained at the non-dominant arm, unless at recruitment the difference in systolic or diastolic BP between both arms is 10 mmHg or more. In this case, the cuffs for office and ambulatory BP measurement will be applied to the arm giving the highest BP level. After the workers have rested for 5 min in the sitting position, the nurses will obtain five consecutive BP readings to the nearest 2 mmHg, using standard mercury sphygmomanometers. Next, they will obtain two consecutive readings immediately after the participants assumed the standing position. For analysis, the five sitting and two standing readings will be averaged. In each position, pulse rate will be counted over 15 s.
Ambulatory BP
The ambulatory BP will be recorded using validated (Citation35) oscillometric Mobil-O-Graph 24-h PWA monitors, which will be programmed to obtain readings at 20-min intervals from 08:00 until 22:00 h and every 60 min from 22:00 until 08:00 h. For analysis, daytime is the interval from 10:00 to 20:00 h, while night-time ranges from midnight to 06:00 h. These fixed intervals eliminate the transition periods in the morning and evening when BP changes rapidly, resulting in daytime and night-time BP levels that are within 1–2 mmHg of the awake and asleep levels (Citation36). If the ambulatory recordings are longer than 1 day, only the first 24 h will be analyzed. Intra-individual means of the ambulatory measurements will be weighted by the time interval between successive readings (Citation37).
Central hemodynamic measurements in the supine position
During an 8-s period, trained observers will record the radial arterial waveform at the dominant arm and the carotid waveform by applanation tonometry. They will use a high-fidelity SPC-301 micromanometer (Millar Instruments, Inc., Houston, TX, USA) interfaced with a laptop computer running the SphygmoCor software (AtCor Medical Pty. Ltd., West Ryde, New South Wales, Australia), version 7.1. Recordings will be discarded when systolic or diastolic variability of consecutive waveforms exceeds 5% or when the amplitude of the pulse wave signal will be less than 80 mV. The radial and carotid pulse wave will be calibrated by the supine brachial BP measured immediately before the tonometric recordings (Citation38). From the radial signal, the SphygmoCor software calculates the aortic pulse wave by means of a validated generalized transfer function (Citation39). The software returns the central systolic, diastolic and pulse pressure, and the pressure at the first and second peak or shoulder of the central and radial waveforms, from which the systolic augmentation index can be derived. The observers will also record the carotid and femoral arterial waveforms at the right side by applanation tonometry. Using a tape measure, they will determine the distance from the suprasternal notch to the carotid sampling site (distance A) and the distance from the suprasternal notch to the femoral sampling site (distance B). Pulse wave travel distance is (distance B minus distance A)× 1.12. Pulse transit time will be derived as the average of 10 consecutive beats (Citation40). Carotid– femoral pulse wave velocity is the ratio of the travel distance in meters to transit time in seconds.
Central hemodynamic measurements in ambulatory conditions
The Mobil-O-Graph 24-h PWA monitors include a high-fidelity pressure sensor (MPX5050, Freescale, Tempe, AZ, USA) and allow recording of the central BP and aortic pulse wave velocity (Citation41–44). The ARCSOlver algorithm, as implemented in the monitor, reconstructs the central pulse wave by applying a transfer function and incorporates an algorithm for checking the quality of the signal (Citation41). The recordings are carried out at the brachial artery by inflating the cuff slightly above diastolic BP for approximately 10 s. The central aortic pressure waveform is decomposed into forward and reflected waves using an uncalibrated triangular aortic flow waveform (Citation41). Pulse wave velocity is estimated from the time difference between the derived forward and reflected waves after signal processing based on waveform constraint criteria. The model used is linear with a continuous parameter space for arterial resistance, peripheral resistance and arterial compliance. The ARCSolver software computes aortic pulse wave velocity from the reconstructed central pulse wave, characteristic impedance and age, based on the concept that the ejection work of the left ventricle is subject to an optimization principle, and assuming a three-element Windkessel model (Citation41). The central BP measurements obtained by the Mobil-O-Graph 24-h PWA monitor have been validated non-invasively (Citation42) and invasively (Citation43), and predict cardiovascular events in patients with coronary heart disease (Citation44).
Assessment of the nervous system
Heart rate variability
The nurses will record a standard 12-lead ECG over 16 s by means of the paperless Cardiax device (http://www.rdsm.eu/cardiax.html), interfaced with a computer. Next, they will continue recording one peripheral lead with the workers in the supine position for 5 min and consecutively in free-standing position for another 5 min. Measurement of heart rate variability in the frequency domain provides non-invasive information on the role of the autonomic nervous system in the control of the cardiovascular system (Citation45). The recorded ECGs will be exported using the Cardiax® software, version 4.12.5. Next, the exported recordings will be analyzed by software, developed in LabVIEW (Laboratory Virtual Instrument Engineering Workbench, National Instruments, Austin, TX, USA) by Beckers and coworkers (Citation46). This software performs fast QRS-peak detection in ECG signals. After peak detection, the software computes the consecutive peak-to-peak intervals, the mean RR interval (ms), its total variance or power (ms2), and the powers in the low-frequency (0.04–0.15 Hz) and high-frequency (0.15–0.40 Hz) bands. The low-frequency power predominantly represents sympathetic modulation, while the high-frequency component of heart rate variability depends on vagal activity (Citation45).
Peripheral nerve conduction velocity
Peripheral neuropathy can occur at high exposure to lead. The hallmark sign, resulting from damage of the innervating motor nerves, is wrist drop (Citation47). Nerve conduction velocity of the motor nerves in this region is a subclinical endpoint for peripheral neuropathy (Citation47). The study nurses will use a hand-held device and accompanying software (Brevio Nerve Conduction Monitoring System, NeuMed Inc., West Trenton, NJ, USA) to stimulate the median nerve at a gradually increasing voltage until the maximum compound motor action potential of the abductor pollicis brevis muscle is reached. They will measure latency (in ms) and amplitude (in mV), along with the skin temperature, at the workers’ right and left hands.
Neurocognitive testing
Lead exposure can induce a progressive decline of neurocognitive function (Citation48). Using a touch screen portable computer, the workers will complete the Stroop (Citation49) and Digit-Symbol (Citation50) tests, which respectively measure selective attention and the speed of scanning and processing visual information.
Measurements on blood and urine
Fasting blood and fresh urine samples will be obtained at baseline and at the annual follow-up visits. Blood samples will be immediately spun and divided into aliquots of serum and plasma. Laboratories certified by the Clinical Laboratory Improvement Amendments of 1988 (CLIA) will perform all tests.
Biomarkers of exposure
Blood lead levels will be determined by inductively coupled plasma mass spectrometry (ICP-MS) at an analytical laboratory certified for blood lead analysis and in compliance with the provisions of the OSHA Lead Standard, 29CFR 1910.1025 (Occupational Safety and Health Administration). The analytical laboratory participates in appropriate blood lead proficiency testing programs. Prior to analysis specimens will be digested in nitric acid and spiked with an iridium internal standard. In addition to blood lead, erythrocyte zinc protoporphyrin will be measured, as this biomarker is part of the obligatory OSHA panel for monitoring lead exposed workers. Zinc protoporphyrin does not increase above the variations produced by dietary variables until blood lead levels exceed 17–20 μg/dl (Citation51). Biomarkers of exposure will be measured at baseline and at intervals that vary as a function of lead exposure intensity as specified by OSHA guidelines. Blood lead will be measured more frequently within the framework of the regular monitoring of lead-exposed workers and is expected to be determined on at least a quarterly basis.
Other blood tests
Measurements include hemoglobin, hematocrit, blood cell counts, iron status (serum iron, total iron binding capacity and transferrin saturation), liver function (including γ-glutamyltransferase as index of alcohol intake), lipid and carbohydrate metabolism, renal function, and serum proteins. eGFR will be computed from serum creatinine by the Modification of Diet in Renal Disease (Citation28) and the Chronic Kidney Disease Epidemiology Collaboration (Citation29) equations, and from serum cystatin C (Citation27).
Tests on urine
Fresh urine samples will be analyzed for specific gravity, pH, glucose, bilirubin, ketones, occult blood, protein, nitrite, leukocyte esterase, microalbuminuria, uric acid, creatinine and the nicotine metabolite cotinine. If the microalbuminuria test is positive, a second spot urine sample will be obtained to repeat the test within 2–3 weeks.
Database management and statistical analysis
For database management and statistical analysis SAS software, version 9.3 (SAS Institute Inc., Cary, NC, USA) will be used.
Data flow and database construction
The Studies Coordination Centre will develop electronic case report forms (eCRFs) as interactive PDF forms, which investigators will complete at the medical facilities of the job sites. XML files exported from the PDFs will be sent to the Studies Coordination Centre. After quality control and addition of the codes for symptoms, diseases and concurrent medications, the XML files will be directly imported into the SAS database, using the SAS XML Mapper, version 9.3.
Analyses of continuous outcome variables
Mixed models will be used to study the association between changes in BP and renal function and changes in blood lead or erythrocyte zinc protoporphyrin. Multivariable-adjusted models with BP or changes in renal function as dependent variables will account for baseline BP or renal function, sex, age, follow-up duration, baseline and follow-up body mass index, intake of female sex hormones and/or non-steroidal anti-inflammatory drugs at baseline and follow-up and three indicator variables coding for antihypertensive drug intake (starting or stopping treatment between baseline and follow-up and remaining on treatment). Other covariables of potential importance are iron status, anemia and lifestyle factors such as smoking and drinking. Mixed models allow accommodating randomly missing data and modeling the individual participant as a random effect.
Analyses of categorical outcome variables
To study the incidence of categorical endpoints, e.g., hypertension or renal dysfunction, we will apply Cox regression adjusted for the same covariables as in the continuous analyses and with the individual participant modeled as a random effect. In these analyses, workers with hypertension or renal dysfunction at enrolment will be excluded. The added value of various biomarkers, including blood lead, to predict study endpoints will be assessed using the net reclassification improvement and the integrated discrimination improvement (Citation52).
Timelines
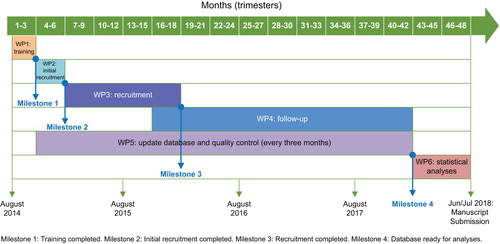
SPHERL will run over 4 years and consists of six work packages. Milestones are critical steps in the project, when a set goal is achieved. is a Gantt chart of the project and provides information on work packages and milestones with associated timelines. If the recruitment and retention rate are lower than projected, the number of sites hosting the study will be increased. The primary endpoint is based on 24-h ambulatory BP measurement. Ambulatory monitoring has been applied successfully in previous studies in populations (Citation53) and workers (Citation54). However, this technique causes a slight discomfort, in particular during sleep. If this causes a higher than expected attrition rate, BP monitoring might be limited to daytime only. Latency, i.e. the interval between exposure and the appearance of clinical measurable effects, is an important issue in lead toxicity. If all outcome measures are unrelated to changing exposure to lead, follow-up will be extended. This might be particularly applicable for some of the secondary endpoints, for which few “longitudinal” data are available to inform sample size calculations.
Figure 2. Gantt chart showing work packages and milestones and associated timelines.
Discussion
SPHERL will assess the effects of low-level lead exposure on BP in occupationally exposed workers, during a 2-year follow-up study. The study design is unique. Foremost, SPHERL is a prospective research project including workers who will go from no previous occupational lead exposure (general population blood lead levels) to occupational lead exposure. This will capture the low end of the dose–response relation between cardiovascular, renal and neurological function and lead exposure. This information is completely novel, because the low-level lead exposure information is currently only available for the general population and study designs in those population studies are not as robust as in the SPHERL protocol. Indeed, BP will be measured peripherally and centrally by 24-h ambulatory monitoring, a bias-free, state-of-the-art method (Citation55) implemented in few previous studies (Citation6). Measures of BP variability derived from the 24-h recordings can be correlated with indexes of autonomic nervous function and provide information on the overall regulation of the cardiovascular system. Furthermore, SPHERL will also focus on renal function and the central hemodynamics. As elastin fibers fragment with aging, the structural integrity of the arterial wall degrades and the BP load is more contained by the non-elastic collagen fibers (Citation56). In SPHERL, we will therefore measure BP in central elastic arteries as well as the systolic augmentation index, systolic augmentation from the central to the peripheral arteries, and aortic pulse wave velocity. SPHERL also involves measurement of a large number of other variables that might play a role in pathophysiological processes or act as confounders in the statistical analysis. The longitudinal design of SPHERL allows the application of Bradford–Hill (Citation25) criteria to assess possible causality between outcome and exposure.
BP and hypertension
In a meta-analysis of 58 518 subjects, the association between BP and low-level lead exposure was weak with an effect size for a doubling of the blood lead concentration of 1 mmHg systolic and 0.6 mmHg diastolic (Citation1). To our knowledge, prospective studies in populations (Citation4–6) or workers (Citation57) did not show a consistent relation between change in BP or incidence of hypertension and the concentration of lead in blood (Citation4–6,Citation57) or bone (Citation5,Citation57).
In the Normative Aging Study (Citation5), cross-sectional analyses of 519 subjects with no history of definite hypertension at baseline and having a representative blood lead level of the American population in this age range (mean = 6.09 μg/dl), revealed positive associations between systolic BP and bone lead levels. In addition, the risk of developing definite hypertension (a BP of at least 160 mmHg systolic or 95 mmHg diastolic, or use of antihypertensive drugs) was associated with the lead concentration in the patella (trabecular bone), but not in the tibia (cortical bone) or in the blood (Citation5). In a study by Møller & Kristensen conducted in Copenhagen County from 1976 until 1987, blood lead fell by 40% in men over 11 years and by 30% in women over 5 years (Citation4). In 1976, in unadjusted analyses, there was an association between systolic BP and blood lead in both sexes, but at follow-up, it disappeared in men or was inconsistent over time in women (Citation4). In the longitudinal (1985–1995) Public Health and Environmental Exposure to Cadmium study (PheeCad) in Belgium (Citation6), the blood lead concentration among 728 participants averaged 8.7 μg/dl at baseline and decreased by 32% over a median follow-up of 5.2 years. The study did not show any consistent association between the changes in the conventionally measured BP or the incidence of hypertension with the changes in the blood lead or zinc protoporphyrin. The 24-h ambulatory BP, only measured at follow-up in 684 participants, neither correlated with blood lead nor zinc protoporphyrin at baseline or follow-up (Citation6).
In a longitudinal study (1994–1998) of 496 workers, blood lead at baseline averaged 4.6 μg/dl (Citation57) and tibia lead at year 3 averaged 14.7 μg/g bone mineral. Change in systolic BP during the study was associated with lead dose, with an average annual increase of 0.64, 0.73 and 0.61 mmHg for every standard deviation increase in blood lead at baseline, tibia lead at year 3 or peak past tibia lead, respectively (Citation57). SPHERL is specifically designed to expand the data available in lead workers. The study is also likely to provide the only data available in workers that covers the region of the response-exposure relation from no or low lead exposure to occupational levels of exposure, thanks to the prospective follow-up of new hires.
Renal function
Muntner and colleagues (Citation9) examined the association between renal function and blood lead in the Third National Health and Nutrition Examination Survey (NHANES). Among 4813 hypertensive patients, blood lead averaged 4.21 μg/dl and the prevalence of elevated serum creatinine and chronic kidney disease was 11.5% and 10.0%, respectively. Thresholds for serum creatinine varied from 1.2 to 1.6 mg/dl depending on ethnicity and sex, whereas chronic kidney disease was an eGFR below 60 ml/min/1.73 m2 (Citation9). On the other hand, among 10 398 normotensive individuals, the blood lead concentration averaged 3.30 μg/dl, while the prevalence of elevated serum creatinine and chronic kidney disease were only 1.8% and 1.1%, respectively. In multivariable-adjusted analyses, elevated serum creatinine and the prevalence of chronic kidney disease were associated with blood lead among hypertensive patients, but not among normotensive individuals (Citation9).
The Normative Aging Study investigators published a so-called longitudinal assessment of the association between renal function and blood lead (Citation14). Among 459 men, a 10-fold increase in blood lead level predicted an increase in the serum creatinine concentration by 80 μg/dl (p = 0.005). The association was also significant among men, whose blood lead concentration had never exceeded 10 μg/dl. However, these analyses were cross-sectional, correlating concurrently measured serum creatinine and blood lead in participants with the number of measurements ranging from two to six. Each participant was therefore included at least twice in the regression models. There was no correlation between changes in serum creatinine and blood lead from one visit to the next (p = 0.11). The age-related increase in serum creatinine was earlier and faster in the highest compared with the lowest quartile of the time-weighted average of lead exposure (Citation14). Inverse associations between renal function and the blood lead concentration have also been reported in Belgium (Citation2), Sweden (Citation10) and Taiwan (Citation11).
However, the aforementioned studies on the association between renal function and lead exposure are vulnerable to reverse causality. No study ascertained whether the potentially nephrotoxicity of lead impaired renal function or whether renal dysfunction diminished the capacity of the kidney to excrete lead. Moreover, hypertension was insufficiently accounted for. For instance, it is striking that in Muntner's study (Citation9), the blood lead levels were similar in hypertensive patients and normotensive participants, suggesting that hypertension rather than lead exposure might have been the main factor underlying the worse renal function. Along similar lines, comorbidities, such as diabetes mellitus (Citation13) or widespread atherosclerosis (Citation12) might have contributed to renal dysfunction. EPA's 2006 report (Citation20) and the 2012 National Toxicology Program Monograph (Citation19) considered the evidence for reverse causality to be insufficient to explain the associations between renal outcomes and lead exposure. However, both documents did not offer definite conclusions.
Function of the nervous system
A meta-analysis on neurobehavioral outcomes by Meyer-Baron & Seeber included 22 studies covering exposures with blood lead levels below 70 μg/dl (Citation58). As a consequence of differences in the test procedures or insufficiently documented test results, only 12 studies could be retained in the meta-analysis (Citation58). For most neurobehavioral tests, the effects sizes were qualified as small (Citation58). However, for the Block Design test that gives some indication about visuospatial conceptualization, the effect size was equivalent to the loss of function that occurs with 20 years of aging (Citation58).
Araki and coauthors reviewed 120 articles on peripheral, central and autonomic nervous system effects in lead workers (Citation59). They reported that the reduction in the peripheral nerve conduction velocity, together with the effects on the event-related potential latency, postural balance and electrocardiographic heart rate variability, occurs at a mean blood lead concentration of 30–40 μg/dl. The effects on the latencies of the short-latency somatosensory, visual and brainstem auditory evoked potentials, as well as the distribution of nerve conduction velocities, started at a blood lead concentration of 40–50 μg/dl (Citation59). A major limitation of these previous studies (Citation58–60) is that most had a cross-sectional design, that most accounted for a limited number of confounders, and that they cannot be extrapolated to current levels of exposure in the working environment.
Conclusions
SPHERL will provide a unique opportunity to investigate the effects of lead exposure on BP, cardiovascular regulation, renal function, cognitive function and the autonomic nervous system that could not be reliably studied from cross-sectional population studies or small occupational studies. The results might help to define the lead levels associated with adverse effects in guidelines worldwide. Elucidation of the molecular pathways of lead toxicity is beyond the scope of SPHERL. Nevertheless, clinical observations collected within the current study might inform further mechanistic studies to be conducted in the laboratory.
Acknowledgment
The authors gratefully acknowledge the contribution of the staff at the Studies Coordination Centre in Leuven: Linda Custers, Annick De Soete, Marie-Jeanne Jehoul, Yvette Piccart, Daisy Thijs, and Hanne Truyens.
Role of the funding source
ILZRO supports SPHERL by an unrestricted research grant. In addition, the European Union (grants IC15-CT98-0329-EPOGH, LSHM-CT-2006-037093 InGenious Hyper-Care, HEALTH-F4-2007-201550 HyperGenes, HEALTH-F7-2011- 278249 EU-MASCARA, HEALTH-F7-305507 HOMAGE and the European Research Council Advanced Research Grant 294713 EPLORE) and the Fonds voor Wetenschappelijk Onderzoek Vlaanderen, Ministry of the Flemish Community, Brussels, Belgium (G.0881.13 and G.0880.13) gave support to the Studies Coordinating Centre (Leuven, Belgium).
Conflict of interest: None of the authors declares a conflict of interest with regard to the information presented in this manuscript.
References
- Nawrot TS, Thijs L, Den Hond EM, Roels HA, Staessen JA. An epidemiological re-appraisal of the association between blood pressure and lead: A meta-analysis. J Hum Hypertens. 2002;16:123–131.
- Staessen JA, Lauwerys RR, Buchet J-P, Bulpitt CJ, Rondia D, Vanrenterghem Y, et al. Impairment of renal function with increasing blood lead concentrations in the general population. N Engl J Med. 1992;327:151–156.
- Hara A, Thijs L, Asayama K, Gu YM, Jacobs L, Zhang ZY, et al. Blood pressure in relation to environmental lead exposure in the National Health and Nutrition Examination Survey 2003 to 2010. Hypertension. 2015;65:62–69.
- Møller L, Kristensen TS. Blood lead as a cardiovascular risk factor. Am J Epidemiol. 1992;136:1091–1100.
- Cheng Y, Schwartz J, Sparrow D, Aro A, Weiss ST, Hu H. Bone lead and blood levels in relation to baseline blood pressure and the prospective development of hypertension. Am J Epidemiol. 2001;153:164–171.
- Staessen JA, Roels H, Fagard R, for the PheeCad Investigators. Lead exposure and the conventional and ambulatory blood pressure. A prospective population study. JAMA. 1996;275:1563–1570.
- Staessen J, Amery A, Bernard A, Bruaux P, Buchet JP, Bulpitt CJ, et al. Blood pressure, the prevalence of cardiovascular diseases and exposure to cadmium: A population study. Am J Epidemiol. 1991;134:257–267.
- Eum KD, Nie LH, Schwartz J, Vokonas PS, Sparrow D, Hu H, et al. Prospective cohort study of lead exposure and electrocardiographic conduction disturbances in the Department of Veterans Affairs Normative Aging Study. Environ Health Perspect. 2011;119:940–944.
- Muntner P, He J, Vupputuri S, Coresh J, Batuman V. Blood lead and chronic kidney disease in the general population United States population: Results from NHANES III. Kidney Int. 2003;63:1044–1050.
- Akesson A, Lundh T, Vahter M, Bjellerup P, Lidfeldt J, Nerbrand C, et al. Tubular and glomerular kidney effects in Swedish women with low environmental cadmium exposure. Environ Health Perspect. 2005;113:1627–1631.
- Lai LH, Chou SY, Wu FY, Chen JJ, Kuo HW. Renal dysfunction and hyperuricemia with low blood lead levels and ethnicity in community-based study. Sci Total Environ. 2008;401: 39–43.
- Navas-Acien A, Tellez-Plaza M, Guallar E, Muntner P, Silbergeld E, Jaar B, et al. Blood cadmium and lead and chronic kidney disease in US adults: A joint analysis. Am J Epidemiol. 2009;170:1156–1164.
- Tsaih SW, Korrick S, Schwartz J, Amarasiriwardena C, Aro A, Sparrow D, et al. Lead, diabetes, hypertension, and renal function: The normative aging study. Environ Health Perspect. 2004;112:1178–1182.
- Kim R, Rotnitzky A, Sparrow D, Weiss ST, Wagner C, Hu H. A longitudinal study of low-level lead exposure and impairment of renal function. The Normative Aging Study. JAMA. 1996;275:1177–1181.
- Jhun HJ, Kim H, Paek DM. The association between blood metal concentrations and heart rate variability: A cross-sectional study. Int Arch Occup Environ Health. 2005;78:243–247.
- Vaziri ND, Ding Y. Effect of lead on nitric oxide synthase expression in coronary endothelial cells. Role of superoxide. Hypertension. 2001;37:223–226.
- Roncal C, Mu W, Reungjui S, Kim KM, Henderson GN, Ouyang X, et al. Lead, at low levels, accelerates arteriolopathy and tubulointerstitial injury in chronic kidney disease. Am J Physiol Renal Physiol. 2007;293:F1391–F1396.
- Alexander J, Benford D, Boobis A, Ceccatelli S, Cravedi JP, Di Domenico A, et al. Scientific opinion on lead in food. EFSA Journal. 2010;8:1570–1717.
- National Toxicology Program. Renal effects. NTP Monograph on Health Effects of Low-Level Lead. Research Triangle Park, North Carolina: National Toxicology Program, National Institute of Environmental Health Sciences; 2012. p 77–87.
- United States Environmental Protection Agency. Air Quality Criteria for Lead. Volume 1 (http://cfpub.epa.gov/ncea/cfm/recordisplay.cfm?deid = 158823). Washington DC; 2006.
- United States Environmental Protection Agency, Office of Research and Development, National Center for Environmental Assessment. Integrated science assessment for lead (http://www.epa.gov/ncea/isa/lead.htm). Research Triangle Park, NC; 2013.
- Weed DL. Weight of evidence: A review of concept and methods. Risk Anal. 2005;25:1545–1557.
- Advisory Committee on Childhood Lead Poisoning Prevention (ACCLPP). Low level lead exposure harms children: A renewed call for primary prevention. Report of the Advisory Committee on Childhood Lead Poisoning Prevention of the Centers for Disease Control and Prevention (http://www.cdc.gov/nceh/lead/acclpp/acclpp_main.htm); 2012.
- Nuyts GD, Elseviers MM, De Broe ME. Healthy worker effect in a cross-sectional study of lead workers. J Occup Med. 1993;35:387–391.
- Hill AB. The environment and disease: Association or causation? Proc R Soc Med. 1965;58:295–300.
- World Medical Association Declaration of Helsinki. Recommendations guiding physicians in biomedical research involving human subjects. JAMA. 1997;277:925–926.
- Inker LA, Schmid CH, Tighiouart H, Eckfeldt JH, Feldman HI, Greene T, et al. Estimating glomerular filtration rate from serum creatinine and cystatin C. N Engl J Med. 2012;367:20–29.
- Levey AS, Bosch JP, Lewis JB, Greene T, Rogers N, Roth D, et al. A more accurate method to estimate glomerular filtration rate from serum creatinine: A new prediction equation. Ann Intern Med. 1999;130:461–470.
- Levey AS, Stevens LA, Schmid CH, Zhang Y, Castro AF, III, Feldman HI, et al. A new equation to estimate glomerular filtration rate. Ann Intern Med. 2009;150:604–612.
- Premaratne E, MacIsaac RJ, Finch S, Panagiotopoulos S, Ekinci E, Jerums G. Serial measurements of cystatin C are more accurate than creatinine-based methods in detecting declining renal function in type 1 diabetes. Diabet Care. 2008;31:971–973.
- Stewart SP, Bramley PN, Heighton R, Green JH, Horsman A, Losowsky MS, et al. Estimation of body composition from bioelectrical impedance of body segments: Comparison with dual-energy X-ray absorptiometry. Brit J Nutr. 1993;69:645–655.
- Shaw JW, Johnson JA, Coons SJ. US valuation of the EQ-5D health states: Development and testing of the D1 valuation model. Med Care. 2005;43:203–220.
- O’Brien E, Asmar R, Beilin L, Imai Y, Mancia G, Mengden T, et al. Practice guidelines of the European Society of Hypertension for clinic, ambulatory and self blood pressure measurement. J Hypertens. 2005;23:697–701.
- Kuznetsova T, Staessen JA, Kawecka-Jaszcz K, Babeanu S, Casiglia E, Filipovskã J, et al. Quality control of the blood pressure phenotype in the European Project on Genes in Hypertension. Blood Press Monit. 2002;7:215–224.
- Weis W, Tolle M, Zidek W, van der Giet M. Validation of the mobil-O-Graph: 24 h-blood pressure measurement device. Blood Press Monit. 2010;15:225–228.
- Fagard R, Brguljan J, Thijs L, Staessen J. Prediction of the actual awake and asleep blood pressures by various methods of 24 h pressure analysis. J Hypertens. 1996;14:557–563.
- Thijs L, Staessen J, Fagard R. Analysis of the diurnal blood pressure curve. High Blood Pressure Cardiovasc Prev. 1992; 1:17–28.
- Van Bortel LM, Balkestein EJ, van der Heijden-Spek JJ, Vanmolkot FH, Staessen JA, Kragten JA, et al. Non-invasive assessment of local arterial pulse pressure: Comparison of applanation tonometry and echo-tracking. J Hypertens. 2001;19:1037–1044.
- Pauca AL, O’Rourke M, Kon ND. Prospective evaluation of a method for estimating ascending aortic pressure from the radial artery pressure waveform. Hypertension. 2001;38: 932–937.
- Laurent S, Cockcroft J, Bortel LV, Boutouyrie P, Giannattasio C, Hayoz D, et al. Expert consensus document on arterial stiffness: Methodological issues and clinical applications. Eur Heart J. 2006;27:2588–2605.
- Wassertheurer S, Kropf J, Weber T, van der Giet M, Baulman J, Ammer M, et al. A new oscillometric method for pulse wave analysis: Comparison with a common tonometric method. J Hum Hypertens. 2010;24:498–504.
- Luzardo L, Lujambio I, Sottolano M, da Rosa A, Thijs L, Noboa O, et al. 24-h ambulatory recording of aortic pulse wave velocity and central systolic augmentation: A feasibility study. Hypertens Res. 2012;35:980–987.
- Weber T, Wassertheurer S, Rammer M, Maurer M, Hametner B, Mayer CC, et al. Validation of a brachial cuff-based method for estimating central systolic blood pressure. Hypertension. 2011;58:825–832.
- Weber T, Auer J, O’Rourke MF, Kvas E, Lassnig E, Lamm G, et al. Increased arterial wave reflections predict severe cardiovascular events in patients undergoing percutaneous coronary interventions. Eur Heart J. 2005;26: 2657–2663.
- Task Force of the European Society of Cardiology and the North American Society of Pacing and Electrophysiology. Heart rate variability. Standards of measurement, physiological interpretation, and clinical use. Circulation. 1996;93: 1043–1065.
- Beckers F, Ramaekers D, Aubert AE. ACTS: Automated calculation of tachograms and systograms. Prog Biomed Res. 1999;4:160–165.
- Rubens O, Logina I, Kravale I, Eglîte M, Donaghy M. Peripheral neuropathy in chronic occupational inorganic lead exposure: A clinical and electrophysiological study. J Neurol Neurosurg Psychiatry. 2001;71:200–204.
- Schwartz BS, Stewart WF, Bolla KI, Simon PD, Bandeen-Roche K, Gordon PB, et al. Past adult lead exposure is associated with longitudinal decline in cognitive function. Neurology. 2000;55:1144–1150.
- Golden CJ, Freshwater SM. Stroop color and word test: A manual for and experimental uses. Wood Dale, IL: Stoelting Company; 1978.
- Goodman M, LaVerda N, Clarke C, Foster ED, Iannuzzi J, Mandel J. Neurobehavioural testing in workers occupationally exposed to lead: Systematic review and meta-analysis of publications. Occup Environ Med. 2002;59: 217–223.
- Martin CJ, Werntz CL, III, Ducatman AM. The interpretation of zinc protoporphyrin changes in lead intoxication: A case report and review of the literature. Occup Med. 2004;54: 587–591.
- Pencina MJ, D’Agostino RB, Sr., D’Agostino RB, Jr., Vasan RS. Evaluating the added predictive ability of a new marker: From area under the ROC curve to reclassification and beyond. Stat Med. 2008;27:157–172.
- Gu YM, Thijs L, Li Y, Asayama K, Boggia J, Hansen TW, et al. Outcome-driven thresholds for ambulatory pulse pressure in 9938 participants recruited from 11 populations. Hypertension. 2014;63:229–237.
- Landsbergis PA, Schnall PL, Pickering TG, Warren K, Schwartz JE. Life-course exposure to job strain and ambulatory blood pressure in men. Am J Epidemiol. 2003;157: 998–1006.
- O’Brien E, Parati G, Stergiou G, Asmar R, Beilin L, Bilo G, et al. European Society of Hypertension position paper on ambulatory blood pressure monitoring. J Hypertens. 2013; 31:1731–1768.
- Brooke BS, Karnik SK, Li DY. Extracellular matrix in vascular morphogenesis and disease: Structure versus signal. Trends Cell Biol. 2003;13:51–56.
- Glenn BS, Stewart WF, Links JM, Todd AC, Schwartz BS. The longitudinal association of lead with blood pressure. Epidemiology. 2003;14:30–36.
- Meyer-Baron M, Seeber A. A meta-analysis for neurobehavioural results due to occupational lead exposure with blood lead concentrations < 70 microg/100 ml. Arch Toxicol. 2000; 73:510–528.
- Araki S, Sato H, Yokoyama K, Murata K. Subclinical neurophysiological effects of lead: A review on peripheral, central, and autonomic nervous system effects in lead workers. Am J Ind Med. 2000;37:193–204.
- Seeber A, Meyer-Baron M, Schäper M. A summary of two meta-analyses on neurobehavioural effects due to occupational lead exposure. Arch Toxicol. 2002;76:137–145.