Abstract
Purpose: A few studies investigated renal size using computed tomography (CT) in middle-aged and elderly patients while taking renal function into account. Thus, we aimed to assess kidney dimensions and their predictors in patients without known renal disease by multi-detector computed tomography (MDCT). Methods: This is a 6-month-long prospective observational study. Estimated glomerular filtration rate (eGFR) was calculated with Cockcroft–Gault (CG) and modification of diet in renal disease (MDRD) formulas. Pole-to-pole kidney length (R1) was determined from coronal and sagittal oblique images. Kidney length (R2), width (R3), and parenchymal thickness were measured in axial slices. Results: The data of the 930 patients were included in this study. CG-eGFR was more closely correlated with R1, R2, and R3 than MDRD-eGFR. CG-eGFR, female gender, and presence of diabetes mellitus were independent predictors of R1 size in logistic regression analyses. Conclusion: Kidney sizes diminish with advancing age. CG-eGFR shows a better correlation with kidney dimensions compared with MDRD. Overall, age was a stronger determinant of eGFR than renal dimensions.
INTRODUCTION
Kidney size, traditionally, has been used as one of the markers of chronic kidney disease (CKD). Especially vertical length of the kidney, measured generally by ultrasound (US), is used for this purpose. With a few exceptional states such as myeloma kidney and diabetic kidney, renal size diminishes during CKD process. On the other hand, even in the absence of kidney disease, renal size also diminishes with increasing age.Citation1 It is controversial whether decrease in renal function is secondary to reduced nephron number (reduced renal length) or vice versa. Currently, there is no normogram defining kidney dimensions in middle-aged and elderly patients. However, due to complex shape and diverse functional parts of kidney, simple pole-to-pole kidney length cannot appropriately represent functional kidney mass. In addition, intra- and interobserver variability make US determination prone to error.Citation2
Among the available techniques such as excretory urography, US, and X-ray, computed tomography (CT) is the most accurate method in determining kidney size measurements. Kang et al.Citation3 compared renal size measured during organ harvesting with measurement by ultrasonography, intravenous pyelography, and abdominal CT. Abdominal coronal CT section predicted kidney length more accurately than other radiological methods. Normal kidney size is a matter of ongoing debate, because kidney length is not always negatively correlated with renal function, which is the case in diabetic kidney disease.Citation4 Moreover, different disease states are the reasons for causing renal damage progress at different paces. To assess renal length at least in a patient without a known kidney disease, a number of previous studies utilized CT to determine kidney size in kidney donorsCitation5 and asymptomatic patient cohorts.Citation6 To our knowledge, there are only a few studies in the literature which examined kidney size with CT.Citation6,7 However, none of these studies investigated the association of kidney function with kidney size. Moreover, elderly patients have reduced glomerular filtration rates (GFRs) even in the absence of CKD. And differentiation of normal from abnormal in the elderly in terms of kidney size and GFR is still controversial. Thus, we aimed to evaluate the association between kidney dimensions (kidney pole-to-pole length, width, and parenchymal thickness) and potential correlates including renal function calculated by estimated glomerular filtration rate (eGFR) in unselected middle-aged and elderly patients who had no known renal disease.
MATERIALS AND METHODS
Study Design
This is a 6-month-long prospective observational study which was conducted in the radiology department of our university hospital. Inclusion criteria were as follows: age >50 years, willingness to participate in this study, indication for multi-detector computed tomography (MDCT) of abdomen for reasons other than renal and genitourinary, and CT images of sufficient quality for study assessments. Patients already on dialysis, with known CKD or elevations in creatinine values (serum creatinine >1.2 mg/dL) were excluded from this study. In addition, patients with known anatomical kidney abnormalities such as horseshoe kidney, crossed ectopia, autosomal polycystic kidney disease, ectopic kidney (except from malrotation abnormality), and kidneys with cortical defects due to pyelonephritis and partial surgery were excluded from this study. Patients with CT images of insufficient quality and patients who had no creatinine measurement within 1 week preceding the CT procedure were also excluded from the final analyses. Patients with a history of hypertension, diabetes mellitus, renal stone disease, and benign prostatic hyperplasia but no known CKD or elevated serum creatinine values were included in this study. Local ethics committee approved the study protocol.
Study Subjects
Patients with no known genitourinary and kidney disease who will undergo abdominal MDCT for a variety of reasons were included in this study. Consecutive patients who agreed to participate in this study were enrolled. Body weight and height were measured at the time of the CT procedure. Comorbidities such as diabetes mellitus, urinary stone disease, hypertension, benign prostatic hyperplasia, and history of genitourinary operation were recorded based on patients’ statements and chart data. Serum urea and creatinine values, which were measured during the preceding 1 week, were collected from the central laboratory database of our hospital. The indication of CT imaging was also recorded. eGFR was calculated using both Cockcroft–Gault (CG)Citation8 and modification of diet in renal disease (MDRD)Citation9 formulas:
Multi-detector Computed Tomography Protocol
Before scanning, a 20- to 22-gauge catheter was placed in an antecubital vein and was attached to an automated injector (Ulrich Medical, Ulm-Jungingen, Germany). A contrast agent bolus of 100 mL of iopromide 300 (Ultravist, Bayer Healthcare, Berlin, Germany) was injected with a flow rate of 4 mL/s. CT was performed using a new generation of MDCT scanner (Sensation 64, Siemens Medical Solutions, Erlangen, Germany) operating at an increased rotation rate and acquiring 64 slices per gantry rotation. Portal venous phase CT examinations were performed from the diaphragm to the greater trochanters with the following parameters: 64 × 0.6 mm; gantry rotation time, 0.5 s; pitch, 1; scan time, 11.79 s; tube voltage, 120 kV; and tube current, 160 mA.
Image Analyses
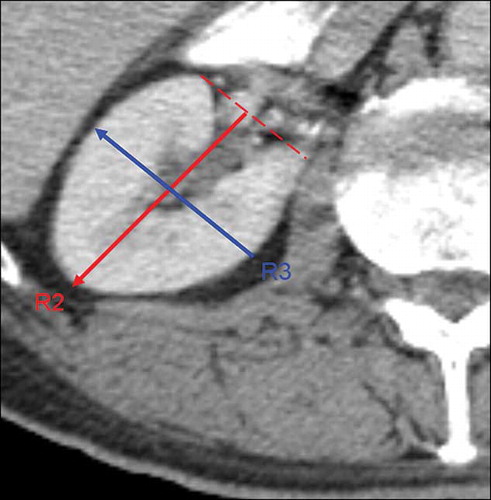
All kidney size measurements were performed using a workstation (Leonardo, Siemens Medical Solutions). We used multi-planar reconstruction (MPR). MPR images are reformatted to generate three-dimensional images which were reconstructed at a 1.5 mm slice thickness. Coronal oblique and sagittal oblique images were reconstructed when the pole-to-pole kidney lengths (R1 and L1) were determined at a maximum for each kidney (). Kidney lengths (R2 and L2), widths (R3 and L3), and parenchymal width were measured in axial slices (). These images were assessed and measurements were performed by an experienced radiologist in the field of abdominal imaging.
Figure 1. A 79-year-old female patient. Axial computed tomography (CT) image (A). Sagittal oblique (B) and coronal oblique (C) images reformatted according to pole-to-pole length (R1) of left kidney. R1 was measured as 101 mm.
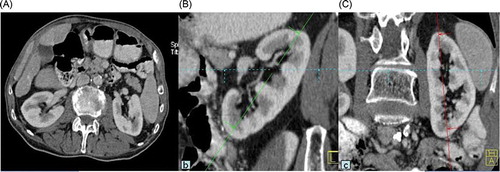
Figure 2. Axial computed tomography (CT) image obtained via pan zooming to kidney; distance up to lateral margin from the level of renal hilus (R2) and bicortical length perpendicular to R2 (R3).
Statistical Analyses
All analyses were performed with SPSS software (version 15.0, SPSS Inc., Chicago, IL, USA). All data were expressed as mean ± SD. Differences between parametric variables of two groups were assessed by Student’s t-test. The linear association between parametric variables was assessed by Pearson’s correlation analysis. χ2-Tests were used for comparisons of categorical variables in two groups. Multiple logistic regression analyses were performed to determine independent predictors of either below or above median dimensions and parenchymal thickness. In four different regression models, R1, R2, R3, and parenchymal thickness were accepted as dependent variables. Independent predictors of renal dimensions were defined as age, gender, body mass index, presence of hypertension, diabetes mellitus, eGFR [divided into three groups according to CG as follows: groups 1 (GFR > 90 mL/min), 2 (GFR between 60 and 90 mL/min), and 3 (GFR between 30 and 60 mL/min)], renal stone disease, and benign prostatic hyperplasia in each logistic regression model. Enter method was used in regression model. A p-value under 0.05 was considered statistically significant.
RESULTS
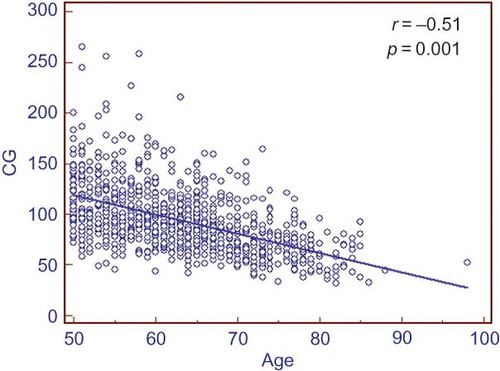
Totally, 1070 patients during a 6-month period were enrolled in this study. Sixteen patients without creatinine values within 1 week preceding this study were excluded from the analysis. One hundred and twenty-four patients with serum creatinine values over 1.2 mg/dL were also excluded from the analysis. The data of the 930 patients were finally included in the study analyses. There were 432 males and 498 females. MDCT procedure was ordered by hemato-oncology in 43% of patients, general surgery in 23%, gastroenterology in 18%, and emergency department in 16%. Baseline characteristics and comorbidities of study population are depicted in . Kidney dimensions including parenchymal width, renal pole-to-pole length (R1), R2, and R3 are depicted in . In all measured kidney dimensions males had higher values compared with females (). The same was true for parenchymal width. CG-eGFR showed a gradual decrease with increasing age ().
Table 1. General characteristics and renal dimensions of the entire study population [mean ± SD (percentage)].
Figure 3. Scatter plot graph showing relationship of Cockcroft–Gault (CG)-estimated glomerular filtration rate (eGFR) with increasing age. There is a negative correlation between CG-eGFR and age.
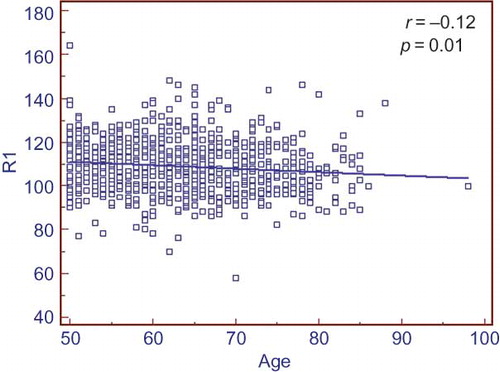
Kidney dimensions such as R1, R2, and R3 were correlated with eGFR calculated by CG equation (). This correlation was weaker for MDRD-eGFR (). Logistic regression analysis showed that female gender and CG-eGFR formula were independent determinants of right parenchymal width. The presence of diabetes mellitus was independently associated with R1, R3, and R3 dimensions. However, the presence of renal stone disease was only associated with R2 and R3 dimensions (). R1 size showed a continuous but little decrease through continuum of age ().
Figure 4. Scatter plot graph showing relationship of R1 size with Cockcroft–Gault (CG)-estimated glomerular filtration rate (eGFR). There is a positive correlation between R1 and CG-eGFR.
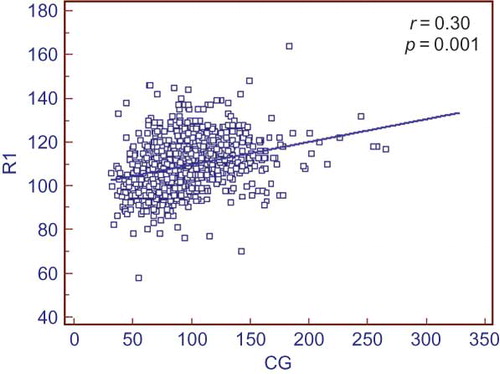
Table 2. Correlations between age, height, weight, serum urea, creatinine, CG-GFR, and MDRD-GFR with renal dimensions (Pearson’s correlation).
Table 3. Logistic regression model (enter method) showing independent relationship of some variables with renal dimensions RPW, R1, R2, and R3.
Figure 5. Scatter plot graph showing relationship of age with R1 size. There is a weak negative correlation between R1 and age.
DISCUSSION
The main finding of this study was that there was a weak correlation between renal dimensions and CG-eGFR. This correlation was not present with MDRD-eGFR. CG-eGFR was an independent predictor of renal dimensions including right parenchyma width, R1, R2, and R3. However, with the current design of our study we cannot say which factor, renal size or function, is causative. What comes first (reduction in renal functions or size or simultaneously) is a matter of ongoing debate.
The results of this study also showed that even when we excluded patients with serum creatinine values which were greater than the upper limit of our normal laboratory reference values (1.2 mg/dL), 50.4% and 58.7% of the entire study population had CKD based on eGFR values calculated with CG and MDRD equations, respectively. The largest study to date, utilizing MDCT in determining kidney dimensions by Glodny et al.,Citation6 used an exclusion criteria of serum creatinine greater than 2 mg/dL. Thus, we think that a greater ratio of the study population of that study may have included patients with CKD considering higher serum creatinine threshold for exclusion in an elderly study population (mean age, 60 ± 15.7 years). Moreover, the authors did not use one of the most important predictors of kidney length in their analyses, namely renal function. In addition, comorbid conditions of the study population were not mentioned. We know that hypertension, diabetes, and renal stone disease may affect kidney size even if they do not impair kidney function.Citation10 To overcome the confounding effects of these comorbidities, we characterized our study population especially in terms of disease states such as diabetes mellitus, hypertension, and renal stone disease, which may affect kidney dimensions per se.
Although it is known that kidney function starts to decline after the age of 40 years (1 mL/kg for every year thereafter) and kidney volumes and consequently vertical length reduce with advancing age,Citation11 there is no established threshold at which one can say that a given patient has CKD (small kidneys for age) confidently. This is especially true for conditions in which kidneys are not remarkably atrophic. There is scarcity of data assessing age-dependent changes in kidney length and parenchymal thickness in healthy geriatric population and elderly patients with kidney disease and comorbid conditions.Citation12 There is also ongoing debate regarding what level of GFR defines the CKD in an elderly patient without proteinuria or other anatomical or biochemical evidence for renal injury.Citation13 Thus, studies conducted on healthy elderly subjects are of paramount importance to define what is normal and what is pathologic in terms of kidney size measurements. However, it may be difficult to include sufficient number of patients without comorbidities, which may impact upon kidney functions. The analysis of our study cohort showed that kidney pole-to-pole length (R1) showed a significant reduction through the continuum of age. However, whether age or reduced eGFR is responsible for the shrinking kidneys is difficult to say, because both age and CG-GFR had independent negative associations with renal dimensions. Although we intended to include patients with normal renal function (creatinine <1.2 mg/dL) to exclude the effect of renal function, when we calculated the eGFRs of study cohort we found that 10.5% and 6.2% of patients had CKD according to CG and MDRD formulas, respectively. Moreover, patients with eGFR values between 60 and 90 mL/min may have fulfilled CKD definition if they had proteinuria and/or hematuria in their urine samples. Taken together, a considerable proportion of the study cohort is made up of patients with CKD. Thus, while our results can be generalized for a typical middle-aged and elderly population, this is not the case for generalization for subjects with normal renal function based solely on serum creatinine values.
One of the major findings of this study was that CG-GFR was more closely correlated with kidney dimensions than MDRD-GFR formula. CG-GFR was positively correlated with right parenchymal width, R1, R2, and R3 more robustly than MDRD-GFR. This may be owing to the prominent role of body weight in the CG equation. Patients with larger bodies may also have higher eGFR values when calculated via CG formula. In fact when CG formula was used, the mean eGFR was found to be greater than that calculated by MDRD formula. Logistic regression analysis also showed independent close association of CG-GFR with all renal dimensions. Thus, in our opinion, when evaluating association of renal size measurements with renal function, CG-GFR may be a more valuable parameter compared with MDRD-GFR.
The presence of diabetes mellitus was found to be negatively associated with kidney shrinkage. This effect was not seen in right parenchymal width. This finding is consistent with the fact that diabetes mellitus does not lead to reduction in kidney sizes.Citation10 Interestingly, our results showed a similar trend with the presence of renal stone disease, however, this time in only R2 and R3 dimensions. This may be explained by the expansion of the collecting system due to obstruction by stones in the early stages of renal disease. However, with advancing hydronephrosis, a decrease in renal parenchymal thickness and R1 may be seen.
There are a few limitations worth mentioning. First, although we intended to include patients with normal or near-normal kidney function, many patients in our cohort had moderate CKD. Thus, the results of this study cannot be generalized to healthy elderly population with preserved kidney function. Second, we did not calculate renal volume, which was shown in several studies to be superior to length measurements.Citation14,15 However, we think that volume measurement is not feasible in each patient due to hydronephrosis, simple renal cysts, and other abnormalities. In addition, volume calculation is complex and time consuming; therefore, it is not practical for everyday use currently. Third, we did not exclude patients with a few simple cysts. However, we know that the presence of renal cysts may affect renal size measurements.Citation16 Lastly, eGFR is not the gold standard for measuring kidney function. These estimation formulas are prone to error particularly in the elderly population.Citation17 Nevertheless, these equations are practical and still widely used.
Despite its limitations, our study has some strengths as well. First, we had a fairly large cohort of patients for a CT study. Second, we provided data for middle-aged and elderly population, which can be encountered in most clinical circumstances. Data are scarce regarding kidney dimensions in the elderly population, and this work adds some new data in this context. We tried to do our best to align kidney axes to produce maximal lengths. This process cannot be accomplished by US and magnetic resonance imaging. Thus, we conclude that our results appropriately reflect the nearest values to actual kidney sizes in the studied cohort.
In conclusion, kidney sizes diminish with advancing age. CG-eGFR shows a better correlation with kidney dimensions compared with MDRD. Overall, age was a stronger determinant of eGFR than renal dimensions. Thus, kidney size cannot be safely utilized to predict kidney function instead of eGFR. Diabetes mellitus is negatively associated with kidney shrinkage. However, this effect was not present in right parenchymal width. Interestingly, renal stone disease also acted similar to the presence of diabetes mellitus. However, this effect was only observed in R2 and R3 measurements.
Declaration of interest: The authors report no conflicts of interest. The authors alone are responsible for the content and writing of the paper.
REFERENCES
- Burkhardt H, Hahn T, Gladisch R. Is kidney size a useful predictor of renal function in the elderly? Clin Nephrol. 2003;59(6):415–422.
- Ablett MJ, Coulthard A, Lee RE, . How reliable are ultrasound measurements of renal length in adults? Br J Radiol. 1995;68(814):1087–1089.
- Kang KY, Lee YJ, Park SC, . A comparative study of methods of estimating kidney length in kidney transplantation donors. Nephrol Dial Transplant. 2007;22(8):2322–2327.
- Singh GR, Hoy WE. Kidney volume, blood pressure, and albuminuria: Findings in an Australian aboriginal community. Am J Kidney Dis. 2004;43(2):254–259.
- Janoff DM, Davol P, Hazzard J, . Computerized tomography with 3-dimensional reconstruction for the evaluation of renal size and arterial anatomy in the living kidney donor. J Urol. 2004;171(1):27–30.
- Glodny B, Unterholzner V, Taferner B, . Normal kidney size and its influencing factors—a 64-slice MDCT study of 1040 asymptomatic patients. BMC Urol. 2009;9:19.
- Shin HS, Chung BH, Lee SE, . Measurement of kidney volume with multi-detector computed tomography scanning in young Korean. Yonsei Med J. 2009;50(2):262–265.
- Cockcroft DW, Gault MH. Prediction of creatinine clearance from serum creatinine. Nephron. 1976;16(1):31–41.
- Levey AS, Bosch JP, Lewis JB, . A more accurate method to estimate glomerular filtration rate from serum creatinine: A new prediction equation. Modification of Diet in Renal Disease Study Group. Ann Intern Med. 1999;130(6):461–470.
- Paivansalo MJ, Merikanto J, Savolainen MJ, . Effect of hypertension, diabetes and other cardiovascular risk factors on kidney size in middle-aged adults. Clin Nephrol. 1998;50(3):161–168.
- Zhou XJ, Rakheja D, Yu X, . The aging kidney. Kidney Int. 2008;74(6):710–720.
- Van Den Noortgate N, Velghe A, Petrovic M, . The role of ultrasonography in the assessment of renal function in the elderly. J Nephrol. 2003;16(5):658–662.
- Sun X, Chen Y, Chen X, . Change of glomerular filtration rate in healthy adults with aging. Nephrology (Carlton). 2009;14(5):506–513.
- Herts BR, Sharma N, Lieber M, . Estimating glomerular filtration rate in kidney donors: A model constructed with renal volume measurements from donor CT scans. Radiology 2009;252(1):109–116.
- Hugen CM, Polcari AJ, Farooq AV, . Size does matter: Donor renal volume predicts recipient function following live donor renal transplantation. J Urol. 2011;185(2):605–609.
- Al-Said J, O’Neill WC. Reduced kidney size in patients with simple renal cysts. Kidney Int. 2003;64(3):1059–1064.
- Wieczorowska-Tobis K, Niemir ZI, Guzik P, . Difference in estimated GFR with two different formulas in elderly individuals. Int Urol Nephrol. 2006;38(2):381–385.