Abstract
Objective: To investigate the effects of phosphonoformic acid (PFA) and sevelamer hydrochloride (Renagel) on renal type IIa sodium-dependent phosphate cotransporter (NaPi-2) mRNA expression in hyperphosphatemia rats. Methods: Thirty rats were randomly divided into five groups based on the diet for 2 weeks after 5/6 nephrectomy (Nx): Nx + high-phosphate (HP; 1.2% P) diet; Nx + low-phosphate (LP; 0.2% P) diet; HP + PFA (injected with 0.15 g/kg PFA daily); HP + Saline (injected with the same amount of saline daily); and HP + Renagel (2%) group. Another 12 rats were sham operated and divided into Sham + HP and Sham + LP groups. Serum ionized calcium, phosphorus (P), and intact parathyroid hormone (iPTH) were measured on days 2, 7, and 14. Serum 1,25(OH)2D3 was measured on day 14 and NaPi-2 mRNA levels were assayed by RT-PCR. Results: PFA decreased iPTH level but had no effect on NaPi-2 mRNA expression. Renagel decreased serum P and iPTH levels, but upregulated renal NaPi-2 mRNA expression. Conclusions: Both PFA and Renagel are effective drugs to decrease iPTH level and they might be potential candidates for treatment of clinical secondary hyperparathyroidism. Renagel can also decrease serum P and upregulate renal NaPi-2 mRNA expression.
INTRODUCTION
Hyperphosphatemia is a common complication of chronic kidney disease.Citation1 The major role of phosphate retention in the pathogenesis of secondary hyperparathyroidism has been demonstrated.Citation2,3 Unfortunately, there are many limitations associated with the use of traditional phosphate binders, and the management of hyperphosphatemia remains a major challenge.
Ingested phosphorus is absorbed by the small intestine, deposited in bone, and filtered by the kidney where it is reabsorbed and excreted in amounts determined by the specific needs of the organism.Citation4 Custer et al.Citation5 proved that renal type IIa sodium-dependent phosphate cotransporter (NaPi-2) is located on the brush border membrane of the proximal renal tubules. However, very few studies have examined the relationship among renal NaPi-2, hyperphosphatemia, parathyroid hormone (PTH), and urinary fractional excretion of phosphate (FEP).
Phosphonoformic acid (PFA) is a competitive inhibitor of NaPi-2Citation6,7; however, PFA’s effects on hyperphosphatemia remain unclear. Renagel, a recently developed phosphate binder, is a quaternary amine anion exchanger that contains neither calcium nor aluminum. In patients with chronic renal failure, it is effective in controlling hyperphosphatemia and reducing the levels of iPTH without increasing the calcium load.Citation8,9 However, the impact of Renagel on NaPi-2 mRNA expression has not been fully investigated.
This study establishes a hyperphosphatemia rat model and investigates the effects of PFA and Renagel on the regulation of NaPi-2 mRNA expression and FEP in hyperphosphatemia rats.
MATERIALS AND METHODS
Animal Model Establishment and Experimental Design
Forty-two male, Sprague Dawley rats, aged 6–8 weeks and weighing 190–200 g each, were purchased from Shanghai Animal Center of the Chinese Science Institute. Renal insufficiency was induced by 5/6 nephrectomy (Nx) in 30 rats, whereby two-thirds of the left kidneys were resected and the right kidneys were removed 1 week later. Nx rats were randomly divided into five groups of six rats. Each group was fed one of the following diets for 2 weeks following surgery: group 1 rats were fed a high-phosphate (HP, 1.2% P) diet (Nx + HP group); group 2 rats were fed a low-phosphate (LP, 0.2% P) diet (Nx + LP group); group 3 rats were fed a HP diet and were injected intraperitoneally with 0.15 g/kg PFA daily (HP + PFA group); group 4 rats were fed a HP diet and were injected with the same amount of saline daily (HP + Saline group), acting as the control of the HP + PFA group; and group 5 rats were fed a HP diet plus 2% Renagel (HP + Renagel group). The remaining 12 rats were sham operated as controls and then randomly divided into two groups: group 1 sham-operated rats were fed a HP (1.2% P) diet (Sham + HP group) and group 2 sham-operated rats were fed an LP (0.2% P) diet (Sham + LP group). On days 2 and 7, blood samples were collected from the angular vein to determine serum ionized calcium (iCa), phosphorus (P), and intact parathyroid hormone (iPTH). Animals were placed in individual metabolic cages for 24 h urine collection during the final 2 days of the experiment. Urine creatinine (Cr) and urine P levels were measured. All rats were killed on day 14 following nephrectomy. The remaining portions of each left kidney were resected, frozen in liquid nitrogen, and stored at −80°C for RNA extraction. Blood was collected by abdominal aortic puncture to determine serum iCa, P, Cr, iPTH, and 1,25(OH)2D3.
All animal protocols were approved by the Animal Studies Committee of Nanjing Medical University.
Preparation of Phosphorus Diets
Rats fed the HP diet exhibited a decrease in serum Ca concentration.Citation10 Therefore, based on literature reports,Citation11,12 adjustments were made in calcium carbonate, calcium hydrogen phosphate, and fiber to the standard (AIN-93G)Citation13 developed by the American Institute of Nutrition in 1993, which provided 1.2% phosphorus and 1.6% calcium (HP diet) and 0.2% phosphorus and 0.5% calcium (LP diet). In HP diets the amount of calcium was increased from 1.2% to 1.6% to prevent the development of hypocalcemia, while in the LP diet it was decreased to 0.5% to avoid hypercalcemia. Specifically, casein and calcium hydrogen phosphate were used to supply phosphorus. Casein contained an average of 7.2 g P/kg. Calcium hydrogen phosphate was used as a supplement of phosphorus. It was also used to supply calcium, and calcium carbonate fills up the requirement. Therefore, calcium hydrogen phosphate and calcium carbonate are quite different between HP diet and LP diet.
Biochemical Determinations
Serum iCa, P, Cr, urine P, and urine Cr were measured using a Hitachi 7170A biochemistry analyzer (Hitachi Co. Ltd., Tokyo, Japan). Serum 1,25(OH)2D3 was measured by radioimmunoassay (BioSource Europe SA, Nivelles, Belgium). An Immulite immunoassay analyzer (Diagnostic Products Corporation, Los Angeles, CA, USA) was used to determine serum iPTH.
Determination of Renal NaPi-2 mRNA Expression
Renal NaPi-2 mRNA levels were determined using semiquantitative polymerase chain reaction (RT-PCR). Total RNA was extracted using Trizol reagent (Invitrogen Life Technologies, Carlsbad, CA, USA). According to the documents,Citation5,14 primers were synthesized in Shanghai by the Shenyou Biotechnology Co. Ltd. (Shanghai, China). The primers for RT-PCR were as follows:
Rat NaPi-2 Sense: 5′-CAT GGC CAA GGC ACT GGG CAAA-3′
NaPi-2 Antisense: 5′-TAG AGC CGG GTG GCA TTG TGG TG-3′
Rat GAPDH Sense: 5′-TCC CTC AAG ATT GTC AGC AA-3′
GAPDH Antisense: 5′-AGA TCC ACA ACG GAT ACA TT-3′
One milliliter of RNA was reverse transcribed to complementary DNA at 48°C for 30 min, then at 99°C for 5 min, and finally at 5°C for 5 min. After incubation at 92°C for 60 s (initial melt), 35 cycles were run as follows: 92°C for 30 s (melt), 55°C for 60 s (anneal), and 72°C for 100 s (extend). At the end of the reaction, the samples were heated at 72°C for 300 s for final extension and then chilled on ice. Amplification of GAPDH was performed with the same reaction program. The predicted lengths of the expected PCR product of NaPi-2 and GAPDH were 423 and 309 bp, respectively. Ten milliliters of the PCR product was size fractionated by 1% agarose gel electrophoresis and stained with ethidium bromide. Sequencing of the PCR products was carried out in Shanghai by the Shenyou Biotechnology Co. Ltd. To semiquantify PCR products, the intensity of the amplified bands was analyzed with image analysis software BandScan 4.3 (Glyko, Novato, CA, USA).
Table 1. Changes in Scr and Ccr in Nx and sham-operated rats.
Statistical Analysis
All results were from three independent experiments, and analysis was done by a core service center in a double-blinded manner. Data are presented as mean ± standard deviation (SD). Either the unpaired t-test or the one-way ANOVA test was used to test for significance with SPSS13.0 (SPSS Inc., Chicago, IL, USA) software. Results with p < 0.05 were considered statistically significant.
RESULTS
Determination of Dietary Phosphorus Level
The amounts of dietary phosphorus and calcium in the various phosphorus diets were analyzed by an Inductively Coupled Plasma Atomic Emission Spectrometer P400 (PerkinElmer Corporation, Norwalk, CT, USA). As expected, the LP diet was found to contain 0.22% phosphorus and 0.53% calcium, and the HP diet was found to contain 1.21% phosphorus and 1.58% calcium.
Table 2. Comparison of serum P, iCa, and iPTH in different rat groups.
Establishment of a Hyperphosphatemia Rat Model
The creatinine clearance rate (Ccr) in Nx rats decreased by 40% compared with the preoperative baseline; serum creatinine (Scr) increased sharply enough to indicate early chronic renal insufficiency ().
From the second day of treatment with a HP diet, Nx + HP rats had higher serum P and iPTH levels compared with the Nx + LP and sham-operated groups; this demonstrated the successful establishment of a hyperphosphatemia rat model. From day 7, the administration of Renagel resulted in significantly decreased serum P and iPTH levels in the HP + Renagel group compared with Nx + HP group (p < 0.05). Administration of PFA resulted in significantly decreased serum iPTH levels in the HP + PFA group compared with the Nx + HP and HP + Saline groups (p < 0.05), but had no effect on serum P levels. There was no significant difference in the levels of either serum iCa or 1,25(OH)2D3 among all groups ().
Serum Calcium–Phosphorus Product in Renagel-Treated Rats
As shown in , the administration of Renagel resulted in significantly decreased serum calcium–phosphorus product in the HP + Renagel group compared with the Nx + HP group (p < 0.05).
Urinary Fractional Phosphorus Excretion
Urinary FEP levels were calculated according to the methods reported by Sorribas.Citation15 The FEP level was significantly higher in the Nx + HP group than in the Sham + HP group (p < 0.05). The administration of Renagel resulted in a significantly decreased FEP level in the HP + Renagel group compared with the Nx + HP group (p < 0.05), while PFA-treated rats had a significantly increased FEP compared with the Nx + HP and HP + Saline groups (p < 0.05) ().
Renal NaPi-2 Expression in Model Rats
In the Nx and sham groups, the HP diet significantly decreased the expression of renal NaPi-2 mRNA (p < 0.01 compared with the Nx + LP group and p < 0.05 compared with the Sham + LP group; ). Renagel increased NaPi-2 mRNA expression (p < 0.01), while PFA had no effect on NaPi-2 mRNA expression.
DISCUSSION
The typical morphological and functional changes in the classic chronic renal failure rat model usually take place in the 6–8 weeks following Nx. This study seeks to investigate whether hyperphosphatemia could have an impact on iPTH and renal NaPi-2. Ritter et al.Citation16 reported that secondary hyperparathyroidism had appeared in 2 weeks in the model of Nx plus a HP diet. Katsumata et al.Citation10 reported that renal NaPi-2 mRNA was decreased in rats fed a HP (containing 1.2% P) for 21 days. In this study, an Nx was combined with a HP diet for 14 days to establish a hyperphosphatemia model; Nx rats fed this diet developed hyperphosphatemia and high iPTH levels. This is a quick method for those interested in conducting acute hyperphosphatemia-related investigations. Levels of Ccr were significantly decreased in Nx rats compared with their preoperative baseline (40% drop, <0.60 mL/min), and these rats subsequently developed early-stage renal failure.
Compared with other groups, there were no changes in either iCa or 1,25(OH)2D3 levels in Nx + HP rats. However, both iPTH and serum P levels increased, showing that hyperphosphatemia increases iPTH independently of serum levels of iCa and 1,25(OH)2D3.
In 1993, Custer et al.Citation5 found that the rat NaPi-2 is mainly expressed in the renal brush border membrane of proximal tubules. Two years later, Kempson et al.Citation17 reported that iPTH regulates sodium–phosphorus cotransport through renal NaPi-2. Since then, investigations about NaPi-2, phosphate transportation, and iPTH have attracted increased research interest.
In this study, the HP diet had no effect on serum P in the Sham + HP group despite the drop in NaPi-2 mRNA expression, suggesting that the normal kidney can keep serum P levels stable within the normal range despite a HP diet. This study also shows that hyperphosphatemia and high iPTH levels appeared along with decreased NaPi-2 mRNA expression in the Nx + HP group. The mechanisms that led to the drop in renal NaPi-2 mRNA expression remain unclear. It is possible that both hyperphosphatemia and high iPTH levels affect the downregulation of renal NaPi-2 mRNA.
Renagel, the novel phosphate binder, markedly decreased serum P level, iPTH level, and calcium–phosphorus product. Interestingly, renal NaPi-2 expression significantly increased while FEP and serum P levels decreased. This suggests that Renagel may work by increasing phosphate excretion in the intestinal tract rather than renal NaPi-2.
PFA, the Pi analogue, competes for occupancy of the Pi binding site.Citation18 It is a specific, competitive inhibitor of sodium-phosphate cotransporters.Citation19 In this study, PFA was injected in one group of Nx + HP rats. Results showed that, although renal NaPi-2 mRNA expression and serum P did not change in this group, there was an increase in FEP and a decrease in PTH levels. PFA seems to decrease iPTH, not through renal NaPi-2 but through decreasing sodium-phosphate transporter (Pit-1) in the parathyroid gland.Citation20
Figure 1. Comparison of calcium–phosphorus product in HP + Renagel versus Nx + HP rats.
Notes: All results were from three independent experiments, and analysis was done by a core service center in a double-blinded manner. Data are presented as mean ± SD. *Denotes p < 0.05 versus Nx + HP group.
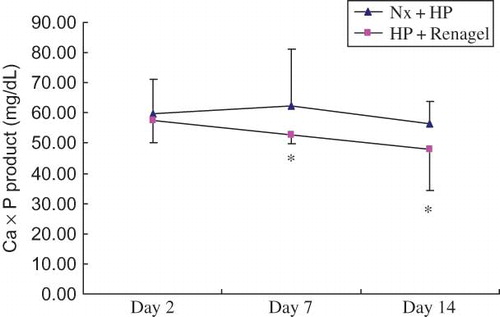
Figure 2. Urinary FEP in different rat groups.
Notes: All results were from three independent experiments, and analysis was done by a core service center in a double-blinded manner. Data are presented as mean ± SD. *Significantly different from Sham + HP group at p < 0.05, **significantly different from Nx + HP group at p < 0.05, and ***significantly different from Nx + HP group at p < 0.05.
Figure 3. NaPi-2 mRNA expression in different rat groups. (A) Expression of NaPi-2 mRNA by RT-PCR. PCR products were separated in 1% agarose gel and stained with ethidium bromide. (B) Densitometric data of renal NaPi-2 mRNA abundance. NaPi-2 mRNA signals were quantified by image analysis software BandScan 4.3. Data were expressed versus GAPDH and compared with ANOVA.
Notes: All results were from three independent experiments, and analysis was done by a core service center in a double-blinded manner. *Significantly different from Sham + LP group at p < 0.05, **significantly different from Nx + LP group at p < 0.01, and ***significantly different from Nx + HP group at p < 0.01.
In conclusion, this study has demonstrated that a hyperphosphatemia rat model can be induced when rats are fed a HP diet for 2 weeks after Nx. Moreover, hyperphosphatemia can increase iPTH levels independent of iCa and 1,25(OH)2D3 levels. Renagel is an effective drug to decrease serum P and iPTH. It can also upregulate renal NaPi-2 mRNA expression. While PFA has no effect on NaPi-2 mRNA, it can decrease iPTH levels and increase urinary FEP. Secondary hyperparathyroidism remains an inevitable consequence of untreated chronic uremia. This study suggests that PFA and Renagel could decrease PTH and might be potential candidates for clinical secondary hyperparathyroidism treatment. Further clinical trials are now in progress.
ACKNOWLEDGMENT
This work was supported by a society development grant from the Department of Jiangsu Science and Technology (Grant No. BS99730).
Declaration of interest: The authors report no conflicts of interest. The authors alone are responsible for the content and writing of the paper.
REFERENCES
- Gutierrez O, Isakova T, Rhee E, . Fibroblast growth factor-23 mitigates hyperphosphatemia but accentuates calcitriol deficiency in chronic kidney disease. J Am Soc Nephrol. 2005;16(7):2205–2215.
- Martin KJ, González EA. Metabolic bone disease in chronic kidney disease. J Am Soc Nephrol. 2007;18(3):875–885.
- Qunibi WY. Renal osteodystrophy. In: Henrich WL, ed. Principles and Practice of Dialysis. Baltimore, MD: Lippincott Williams & Wilkins; 2009:431.
- Tenenhouse HS. Phosphate transport: Molecular basis, regulation and pathophysiology. J Steroid Biochem Mol Biol. 2007;103(3–5):572–577.
- Custer M, Lötscher M, Biber J, Murer H, Kaissling B. Expression of Na-P (i) cotransport in rat kidney: Localization by RT-PCR and immunohistochemistry. Am J Physiol. 1994;266(5 Pt 2):F767–F774.
- Muller DS, Houpert P, Cambar J, Hengé-Napoli MH. Role of the sodium-dependent phosphate cotransporters and absorptive endocytosis in the uptake of low concentrations of uranium and its toxicity at higher concentrations in LLC-PK1 cells. Toxicol Sci. 2008;101(2):254–262.
- Villa-Bellosta R, Sorribas V. Different effects of arsenate and phosphonoformate on P(i) transport adaptation in opossum kidney cells. Am J Physiol Cell Physiol. 2009;297(3):C516–C525.
- Lin YF, Chen YM, Hung KY, . Benefits of sevelamer on markers of bone turnover in Taiwanese hemodialysis patients. J Formos Med Assoc. 2010;109(9):663–672.
- Hamida FB, Fatma LB, Barbouch S, . Effect of sevelamer on mineral and lipid abnormalities in hemodialysis patients. Saudi J Kidney Dis Transpl. 2008;19(2):183–188.
- Katsumata S, Masuyama R, Uehara M, Suzuki K. Decreased mRNA expression of the PTH/PTHrP receptor and type II sodium-dependent phosphate transporter in the kidney of rats fed a high phosphorus diet accompanied with a decrease in serum calcium concentration. Biosci Biotechnol Biochem. 2004;68(12):2484–2489.
- Wang XB, Wang XY, Zhou FH. Feeds with different phosphorus and calcium contents for laboratory rats. Chin J Blood Purif (Chin). 2003;2(8):436–438.
- Dusso AS, Pavlopoulos T, Naumovich L, p21(WAF1) and transforming growth factor-alpha mediate dietary phosphate regulation of parathyroid cell growth. Kidney Int. 2001;59(3):855–865.
- Reeves PG, Nielsen FH, Fahey GC, Jr. AIN-93 purified diets for laboratory rodents: Final report of the American Institute of Nutrition ad hoc writing committee on the reformulation of the AIN-76A rodent diet. J Nutr. 1993;123(11):1939–1951.
- Zhang L, Ma G, Gu Y, Lin SY. Changes of protein kinase Cα in renal tissue of diabetic rats. Chin J Nephrol (C). 2002;18(4):291–294.
- Sorribas V, Lotscher M, Loffing J, . Cellular mechanisms of the age-related decrease in renal phosphate reabsorption. Kidney Int. 1996;50(3):855–863.
- Ritter CS, Martin DR, Lu Y, Slatopolsky E, Brown AJ. Reversal of secondary hyperparathyroidism by phosphate restriction restores parathyroid calcium-sensing receptor expression and function. J Bone Miner Res. 2002;17(12):2206–2213.
- Kempson SA, Lötscher M, Kaissling B, Biber J, Murer H, Levi M. Parathyroid hormone action on phosphate transporter mRNA and protein in rat renal proximal tubules. Am J Physiol. 1995;268(4 Pt 2):F784–F791.
- Lambert G, Forster IC, Stange G, Biber J, Murer H. Properties of the mutant Ser-460-Cys implicate this site in a functionally important region of the type IIa Na(+)/P(i) cotransporter protein. J Gen Physiol. 1999;114(5):637–652.
- Biber J, Hernando N, Forster I, Murer H. Regulation of phosphate transport in proximal tubules. Pflugers Arch. 2009;458(1):39–52.
- Jiang Y, Wang M. Overexpression of parathyroid pituitary-specific transcription factor (Pit)-1 in hyperphosphatemia-induced hyperparathyroidism of chronic renal failure rats. Chin Med J (Engl). 2010;123(12):1566–1570.