Abstract
Background: The measurement of glomerular filtration rate (GFR) applying serum creatinine (Cr) does not reflect the GFR of patients accurately, and thus recently, studies on the measurement of GFR applying serum cystatin-C (Cys-C) have been conducted. We investigated the relationship between Cys-C and proteinuria in patients with chronic kidney disease. Methods: We compared the biochemical test, including serum Cys-C, the amount of proteinuria and the concentration of Cys-C measured by the 24-h urine test, and the difference of GFR on 105 patients who visited our hospital in 6 months (January to June 2007). Results: Among 105 patients, 58 patients were males, and the mean age was 56.74 ± 16.31 years. With regard to underlying diseases, the group with diabetes had 76 patients and the group showing nephrotic proteinuria [nephrotic syndrome (NS)] had 29 patients. The GFR-Cys-C in the NS group (44.17 ± 26.32 mL/min) was higher than in the non-NS group (33.68 ± 14.29 mL/min; p = 0.041). The fractional excretion (FE) of Cys-C increased according to FE of albumin ( p = 0.000) and GFR-modification of diet in renal disease (MDRD) equation (p = 0.000). Serum Cys-C increased according to corrected urine Cys-C (p = 0.010). The GFR calculated by serum Cys-C decreased according to FE of albumin (p = 0.003). The degree of difference between GFR-Cys-C and GFR-MDRD was negatively correlated according to the FE of albumin (p = 0.001). Conclusion: We confirmed that urinary excretion of Cys-C could be altered by previously known mechanisms such as proteinuria. Difference between GFR-Cys-C and GFR-MDRD was negatively correlated according to FE of albumin.
INTRODUCTION
For the measurement of glomerular filtration rate (GFR), the methods applying inulin clearance, 51Cr-EDTA, 99mTc-DTPA, Iohexol, and so on are cumbersome and impractical, and thus in clinics, GFR is estimated by Cockcroft–Gault equation using the concentration of blood creatinine (Cr) and the modification of diet in renal disease equation (MDRD). The GFR may also be obtained by Cr clearance rate by the collection of urine for 24 h.Citation1,Citation2 Nevertheless, the measurement of GFR applying serum Cr does not reflect the GFR of patients accurately and rapidly, and thus recently, studies on the measurement of GFR applying serum cystatin-C (Cys-C) have been conducted.
Cys-C is a cysteine proteinase inhibitor and endogenous low-molecular substance with a molecular weight of 13.3 kD. It is produced in all eukaryotic cells at a constant rate, and the blood concentration is constant regardless of age, gender, and weight. It has the following characteristics: it is a low molecular weight substance, pH = 9.3 (alkaline), positive charge in blood pH, and thus, it could penetrate the glomeruli freely. After filtration into the glomeruli, most Cys-C is absorbed by the proximal tubule and degraded. Such Cys-C has been accepted as a marker of GFR, and numerous studies comparing it with other previous markers have been reported.Citation3 In addition, because the amount of Cys-C excreted in the urine was less, its clinical usefulness was not evident. Nonetheless, recently, its role as a marker of early renal tubular dysfunction has been revealed,Citation4 and particularly, it is useful to the early detection of renal dysfunction in diseases anticipated to progress to chronic renal failure such as diabetic nephropathy.Citation5–7
Based on reports that in patients with proteinuria, urinary Cys-C excretion was increased,Citation8 and under the assumption that proteinuria commonly associated with glomerular injury exerts effects on the excretion of Cys-C or the metabolic process, and thus due to the consequent fluctuation of serum Cys-C concentration, errors may be made during the measurement of GFR, the following study was conducted.
SUBJECTS AND METHODS
Subjects
From January to June 2007, 105 patients (58 males and 47 females) visited our hospital. Serum biochemical test was conducted, including serum Cys-C; the amount of proteinuria (the group whose 24-h proteinuria was higher than 3500 mg: nephrotic syndrome (NS) group; the group whose 24-h proteinuria was less than 3500 mg: non-NS group) and the concentration of Cys-C were measured by the 24-h urine test; and the difference of GFR according to the amount of proteinuria, with or without diabetes, the degree of renal dysfunction, and so on was compared. Patients under renal replacement therapy or acute kidney injury such as obstructive uropathy and drugs were excluded from the study.
Methods
| (1) | Measurement of serum and 24-h urine Cys-C: Serum and 24-h urine Cys-C of the patients were measured by the 24-h urine test applying the Latex Photometric Immuno Assay using HiSens Cys-C reagents (Modular, Hitachi High-Technologies Corporation, Tokyo, Japan). | ||||||||||||||||||||||
| (2) | Calculation of fractional excretion (FE) of Cys-C and albumin:
| ||||||||||||||||||||||
| (3) | Correction of 24-h urine albumin and Cys-C by 24-h urine Cr:
| ||||||||||||||||||||||
| (4) | Measurement of serum and 24-h urine Cr: Serum and 24-h urinary Cr of the patients were measured by kinetic colorimetric assay (Modular, Hitachi High-Technologies Corporation, Tokyo, Japan). | ||||||||||||||||||||||
| (5) | Calculation of GFR: The GFR applying serum Cr (MDRD) and the GFR applying Cys-C were obtained by the following equationsCitation9,10:
| ||||||||||||||||||||||
| (6) | Statistical analysis: Laboratory data of the diabetes group, the nondiabetes group, the nephrotic proteinuria group, and the subnephrotic proteinuria group were compared by the application of T-test. The correlation to GFR according to the amount of proteinuria, the amount of Cys-C excreted in the urine, and serum Cys-C was analyzed by the application of linear regression analysis. p-Value less than 0.05 was considered to be statistically significant. | ||||||||||||||||||||||
RESULTS
Demographic Data of the Total Subjects
Among 105 patients, 58 patients were males and 47 patients were females, and the mean age was 56.74 ± 16.31 years. With regard to underlying diseases, the group with diabetes had 55 patients, the group without diabetes had 50 patients, the group showing nephrotic proteinuria had 38 patients, and the group showing subnephrotic proteinuria had 67 patients (). The levels of serum protein and albumin of total patients were 6.20 ± 1.02 and 3.31 ± 0.08 g/dL, respectively. Serum Cys-C concentration was 2.91 ± 1.15 mg/dL. The average blood urea nitrogen and Cr levels of the patients were 47.08 ± 20.00 and 4.24 ± 3.28 mg/dL, respectively. The stages of chronic kidney disease (CKD) were classified according to the guideline of the Kidney Disease Outcomes Quality Initiative, and it was found that 6 patients (5.7%) had stage 1 CKD, 6 patients (5.7%) had stage 2 CKD, 24 patients (22.9%) had stage 3 CKD, 26 patients (24.8%) had stage 4 CKD, and 43 patients (41%) had stage 5 CKD without dialysis. The 24-h amount of urine protein and Cys-C of the patients was 3118.75 ± 2956.78 and 1.68 ± 1.40 mg, respectively. The average GFR according to the MDRD equation (GFR-MDRD) and serum Cys-C (GFR-Cys-C) was 28.76 ± 28.04 and 37.76 ± 20.36 mL/min, respectively ().
Table 1. Demographic characteristics and CKD stage of total patients.
Table 2. Laboratory data and Cys-C of total patients.
Comparison of Laboratory Data and Cys-C between the Nephrotic Proteinuria (NS) and the Subnephrotic Proteinuria Groups (non-NS)
The patients were divided according to the amount of 24-h urine protein; the nephrotic proteinuria group had 38 patients (36.2%), and the subnephrotic proteinuria group had 67 patients (63.8%). Serum Cys-C, 24-h urine Cys-C, FE of Cys-C, and corrected urine Cys-C were not statistically significantly different. However, the GFR of Cys-C in the NS group (44.17 ± 26.32 mL/min) was higher than in the non-NS group (33.68 ± 14.29 mL/min; p = 0.041; ).
Table 3. Comparison of laboratory data and cys-C between NS (nephrotic proteinuria) and non-NS (subnephrotic proteinuria) groups.
Comparison of Laboratory Data and Cys-C among CKD Stages
The 24-h urinary excretion of protein and albumin showed no difference among CKD stages. The FE of protein and albumin was increased according to CKD stages, but was not statistically significant. The excretion of Cys-C was increased according to CKD stages (p = 0.001), and GFR calculated by Cys-C was overestimated depending on CKD stages (p = 0.000). The GFR difference showed negative correlation to CKD stages (p = 0.000; ).
Table 4. Comparison of laboratory data and cys-C among CKD stages.
Comparison of Laboratory Data and Cys-C between Diabetes Mellitus and the Non-Diabetes Mellitus Groups
The concentration of 24-h urine Cys-C depending on the presence or absence of diabetes did not show a statistical difference; nonetheless, serum Cr and serum Cys-C of the nondiabetes mellitus (non-DM) group were statistically significantly higher (p = 0.048 and p = 0.044, respectively), and consequently, GFR was statistically significantly low (p = 0.000 and p = 0.000, respectively; . It was interpreted that among the entire patient groups, renal function of the non-DM group was shown to be lower, and although the amount of proteinuria was different, the amount of 24-h urinary secretion of Cys-C excretion was not associated with the presence or absence of diabetes.
Table 5. Comparison of laboratory data and cys-C between DM and non-DM groups.
Comparison of Laboratory Data and Cys-C between Hypertension and Non-Hypertension Groups
The concentration of 24-h urine Cys-C depending on the presence or absence of hypertension (HTN) did not show a statistical difference. Serum Cys-C of HTN group was statistically significantly higher (p = 0.016), and consequently, GFR difference was statistically significantly low (p = 0.017). It was interpreted that among the entire patient groups, GFR calculated by serum Cys-C in the HTN group was shown to be lower, although the amount of 24-h urine Cys-C was not different. The amount of 24-h urinary secretion of Cys-C was not associated with the presence or absence of HTN ().
Table 6. Comparison of laboratory data and cys-C between HTN and non-HTN groups.
Subgroup Analysis of Laboratory Data and Cys-C between the NS Group and the Non-NS Group (Diabetes and HTN)
In the non-DM and DM groups, when the variables according to proteinuria were compared, the concentration of 24-h urine Cys-C, FE of Cys-C, serum Cys-C, and GFR calculated by Cys-C were not different. In the non-HTN and HTN groups, when the variables according to proteinuria were compared, serum Cys-C, the concentration of 24-h urine Cys-C, FE of Cys-C, and GFR calculated by serum Cys-C were not different (data not shown).
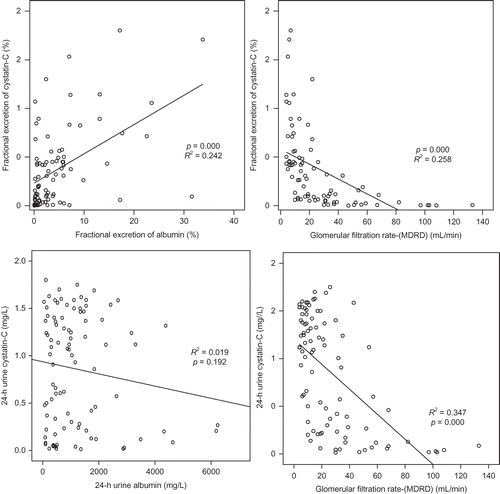
Factors Affecting Fractional Excretion of Cys-C
In all the patients, age and body mass index did not show significant effects on the FE of Cys-C, which increased according to the FE of albumin (p = 0.000, R2 = 0.242) and GFR-MDRD (p = 0.000, R2 = 0.258; ).
Figure 1. Fractional excretion of Cys-C and 24-h urine Cys-C according to fractional excretion of albumin and GFR-MDRD in total patients.
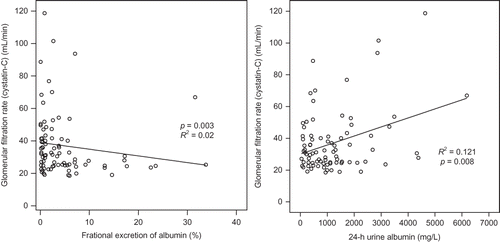
Factors Affecting Serum Cys-C and GFR Calculated by Serum Cys-C
In linear regression analysis, serum Cys-C increased according to corrected urine Cys-C (p = 0.010), but did not show correlation to 24-h urine Cys-C and FE of Cys-C. The GFR calculated by serum Cys-C decreased according to corrected urine Cys-C (p = 0.010), but did not show correlation to 24-h urine Cys-C and FE of Cys-C. The GFR calculated by serum Cys-C decreased according to FE of albumin (p = 0.003). Age and body mass index did not affect serum Cys-C and GFR calculated by serum Cys-C ( and ).
Figure 2. Serum Cys-C and GFR of Cys-C according to corrected urine Cys-C.
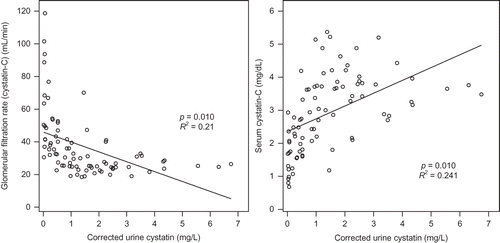
Figure 3. GFR of Cys-C according to fractional excretion of albumin and 24-h urine Cys-C.
Linear Regression of Factors Affecting Difference between GFRs Calculated by Cys-C and MDRD
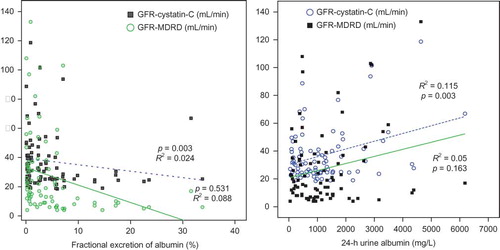
Difference between GFR-Cys-C and GFR-MDRD was negatively increased according to FE of albumin (p = 0.001). The GFR difference was negatively decreased according to body mass index (p = 0.026; and ).
Figure 4. Differences in GFR between Cys-C and MDRD according to fractional excretion of albumin, 24-h urine albumin, and body mass index.
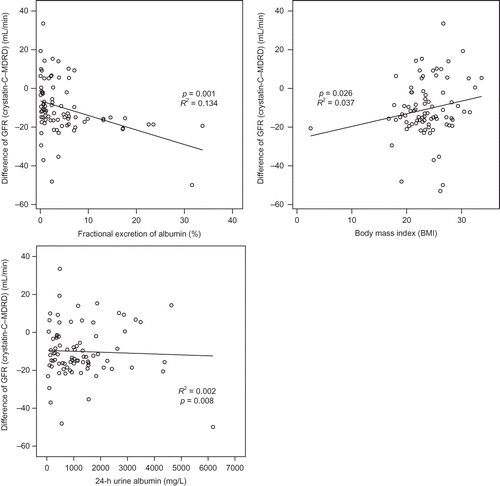
Figure 5. GFR of Cys-C and MDRD according to fractional excretion of albumin and 24-h urine albumin.
DISCUSSION
The Cys-C is a endogenous low molecular weight substance (13.3 kD); it is produced in all eukaryotic cells at a constant rate; it penetrates the glomeruli freely, and its metabolic process is that it is absorbed in the proximal tubule and degraded. It has thus been reported to be a superior clinical marker than the method applying Cr for the measurement of GFR.Citation3 Han et al.Citation3 have reported that the GFR was measured by Cys-C, was changed sensitively in the early period of renal injury different from Cr and was not affected by gender, age, weight, and lean body mass. Sung et al.Citation11 have reported that in the comparison of GFR assessed by 99mTc-DTPA, the GFR obtained by Cys-C was more accurate than the measurement of GFR by other methods particularly in overweight patients. In study using 51Cr-EDTA, the GFR applied Cys-C showed only acceptable errors in the patient group higher than 90 mL/min/1.73 m2, and thus it could be applied more exactly compared to the GFR applied Cr.Citation12 Shlipak et al.Citation4 have reported that in patients with early renal dysfunction, serum Cys-C showed a correlation to cardiovascular diseases and mortality better than Cr. In diabetes cases, several studies showed that in early renal dysfunction with proteinuria, Cys-C plays an important role as a clinical marker reflecting renal function and prognosis more than Cr.Citation13–15 In methods such as these, different from Cr that has been generally used widely, the following advantages have been reported: the assessment of renal function applying serum Cys-C is not affected by age, gender, weight, and so on, and it is more sensitive to early renal dysfunction.Citation5 Nevertheless, recently, it has also been reported that in patients with CKD, body fat does not exert effects; nonetheless, Cys-C concentration is increased depending on body composition, and thus a limitation was shown.Citation16
In studies on the urinary excretion of Cys-C, it has been shown that its excretion amount is too small, and thus, it is difficult to measure GFR by the clearance rate as Cr. Nonetheless, the proofs that such rate of urinary excretion of Cys-C reflects the early change of tubular function and GFR if the clearance rate of Cr is normal have been reported.Citation17,18 After passing through the base membrane of glomeruli, most of the Cys-C are absorbed in the proximal tubule, degraded, and excreted to the urine. According to Tian et al.Citation19 as GFR is decreased, urinary excretion of Cys-C and the FE of Cys-C were increased. According to Hellerstein et al.Citation15 based on such characteristics, if urinary Cys-C/Cr is applied, mild renal dysfunction could be detected without invasive serological tests. Uchida et al.Citation17 have reported that urinary Cys-C is proportional to Cr concentration, and thus urinary Cys-C/Cr could be applied to the measurement of GFR; it could also be applied usefully to diagnose renal tubular impairment. In our study, the stratified classification depending on the presence or absence of diabetes and HTN was attempted, and the amount of urinary excretion of Cys-C did not show differences among the groups (Tables 3–6), and it was shown to be influenced by renal function and proteinuria primarily ().
The usefulness of urinary Cys-C has been reported continuously and studies on factors exerting effects on the concentration of urinary Cys-C have also been conducted. Proteinuria is associated with the early stage of numerous kidney diseases, including diabetic nephropathy, and thus the effect of proteinuria on the excretion of Cys-C has clinically important meanings.Citation20 Uslu et al.Citation21 have reported that in the diabetes group without proteinuria, serum Cys-C correlates to urinary excretion of enzymes such as N-acetyl-β-d-glucosaminidase, and thus if the tubular function is impaired, the metabolism of Cys-C in the kidney may be altered. Thielemans et al.Citation22 have reported that in a rat model, albuminuria could competitively induce the deterioration of low-molecular-weight proteins reabsorbed in the renal tubule. Tkaczyk et al.Citation20 have reported that in pediatric patients with NS, through the examination of the control group, the association of proteinuria with the increased urinary excretion of Cys-C was confirmed. With regard to increasing excretion of Cys-C in proteinuria, in addition to the competitive impeding mechanism suggested by Thielemans et al.,Citation22 the solvent drag phenomenon has been suggested as one of the mechanisms. In our study, similarly, FE of Cys-C showed significant positive correlation with FE of albumin and GFR by MDRD (). Serum Cys-C showed significant positive correlation with urinary Cys-C corrected by urinary Cr (). The GFR calculated by Cys-C showed negative correlation with FE of albumin (). The increase of Cys-C excretion in urine according to proteinuria could be confounding factor on the GFR calculated by Cys-C (Figures 4 and 5).
We confirmed that urinary excretion of Cys-C could be altered by previously known mechanisms such as proteinuria; nevertheless, it was confirmed that the effect of proteinuria could be confined to renal tubular dysfunction. Serum Cys-C was affected by renal function independent of urinary excretion of Cys-C and albumin. In the future, in addition to the mechanism of the alteration of urinary excretion of Cys-C according to proteinuria, additional studies on various factors that may exert effects on the secretion and metabolism of Cys-C in the kidney may be required.
Declaration of interest: The authors report no conflicts of interest. The authors alone are responsible for the content and writing of the paper.
REFERENCES
- Chang YS. Methods for glomerular filtration rate measurement. Korean J Nephrol. 2006;25(4):521–524.
- Macisaac RJ, Tsalamandris C, Thomas MC, . Estimating glomerular filtration rate in diabetes: A comparison of cystatin-C- and creatinine-based methods. Diabetologia. 2006;49(7): 1686–1689.
- Han KH, Han SY, Kang YS, Cha DR. Serum cystatin C concentration compared with serum creatinine concentration as a marker of glomerular filtration rate. Korean J Nephrol. 2006;25:737–744.
- Shlipak MG, Praught ML, Sarnak MJ. Update on cystatin C: New insights into the importance of mild kidney dysfunction. Curr Opin Nephrol Hypertens. 2006;15(3):270–275.
- Zahran A, El-Husseini A, Shoker A. Can cystatin C replace creatinine to estimate glomerular filtration rate? A literature review. Am J Nephrol. 2007;27(2):197–205.
- Beauvieux MC, Le Moigne F, Lasseur C, . New predictive equations improve monitoring of kidney function in patients with diabetes. Diabetes Care. 2007;30(8):1988–1994.
- Donahue RP, Stranges S, Rejman K, Rafalson LB, Dmochowski J, Trevisan M. Elevated cystatin C concentration and progression to pre-diabetes: The Western New York study. Diabetes Care. 2007;30(7):1724–1729.
- de Boer IH, Steffes MW. Glomerular filtration rate and albuminuria: Twin manifestations of nephropathy in diabetes. J Am Soc Nephrol. 2007;18(4):1036–1037.
- Levey AS, Bosch JP, Lewis JB, Greene T, Rogers N, Roth D. A more accurate method to estimate glomerular filtration rate from serum creatinine: A new prediction equation. Modification of Diet in Renal Disease Study Group. Ann Intern Med. 1999; 130(6):461–470.
- Hoek FJ, Kemperman FA, Krediet RT. A comparison between cystatin C, plasma creatinine and the Cockcroft and Gault formula for the estimation of glomerular filtration rate. Nephrol Dial Transplant. 2003;18(10):2024–2031.
- Sung SA, Kim JY, Jo SK, Cho WY, Kim HK. Serum cystatin C compared with other markers for glomerular filtration rate. Korean J Nephrol. 2006;25:551–559.
- Kim Y, Min WK, Rhew J. Assessment of the accuracy and precision of cystatin C-based GFR estimates and Cr-based GFR estimates in comparison with Cr51-EDTA GFR. Korean J Lab Med. 2007;27:34–39.
- Perkins BA, Ficociello LH, Ostrander BE, . Microalbuminuria and the risk for early progressive renal function decline in type 1 diabetes. J Am Soc Nephrol. 2007;18(4): 1353–1361.
- Martin MV, Barroso S, Herraez O, de Sande F, Caravaca F. Cystatin C as estimator of glomerular filtration rate in patients with advanced chronic renal disease. Nefrologia. 2006;26(4):433–438.
- Pucci L, Triscornia S, Lucchesi D, . Cystatin C and estimates of renal function: Searching for a better measure of kidney function in diabetic patients. Clin Chem. 2007;53(3):480–488.
- Macdonald J, Marcora S, Jibani M, . GFR estimation using cystatin C is not independent of body composition. Am J Kidney Dis. 2006;48(5):712–719.
- Uchida K, Gotoh A. Measurement of cystatin-C and creatinine in urine. Clin Chem Acta. 2002;323(1–2):121–128.
- Hellerstein S, Berenbom M, Erwin P, Wilson N, DiMaggio S. The ratio of urinary cystatin C to urinary creatinine for detecting decreased GFR. Pediatr Nephrol. 2004;19(5):521–525.
- Tian S, Kusano E, Ohara T, . Cystatin C measurement and its practical use in patients with various renal disease. Clin Nephrol. 1997;48(2):104–108.
- Tkaczyk M, Nowicki M, Lukamowicz J. Increased cystatin C concentration in urine of nephrotic children. Pediatr Nephrol. 2004;19(11):1278–1280.
- Uslu S, Efe B, Alatas O, . Serum cystatin C and urinary enzymes as screening markers of renal dysfunction in diabetic patients. J Nephrol. 2005;18(5):559–567.
- Thielemans N, Lauwerys R, Bernard A. Competition between albumin and low-molecular-weight proteins for renal tubular uptake in experimental nephropathies. Nephron. 1994;66(4): 453–458.