Abstract
Background/objectives: Cardiovascular abnormalities are common in patients with chronic kidney disease. Visfatin influences lipid metabolism, insulin sensitivity, and cardiovascular health. The aim of this study was to explore the relation of serum visfatin to cardiovascular risk factors in nondiabetic peritoneal dialysis (PD) patients. Patients and methods: Eighty-seven nondiabetic patients (mean age 48 ± 15 years, 39 males) under PD were enrolled. Weight, anthropometric measurements, blood pressure, biochemical parameters, and insulin resistance (homeostatic model assessment-insulin resistance—HOMA-IR) were measured. Visfatin was measured and left ventricular mass index (LVMI) was calculated by echocardiography. Results: LVMI was correlated with body mass index (BMI; r = 0.47, p = 0.01), systolic blood pressure (SBP; r = 0.62, p = 0.04), and serum visfatin levels (r = 0.49, p = 0.03). According to HOMA-IR levels patients were grouped as insulin-resistant (IR) (HOMA-IR ≥2.0, n = 35) and noninsulin-resistant (non-IR) (HOMA-IR <2.0, n = 52) groups. The IR group had longer PD duration and higher BMI, total cholesterol, uric acid, and serum visfatin levels (p < 0.05). The study patients were divided into three groups according to their serum visfatin levels. Group 1 (≤34 ng/mL, n = 22) was considered as the lowest tertile of low visfatin and group 2 (35–42 ng/mL, n = 43) and group 3 (≥43 ng/mL, n = 22) in the upper tertile. Considering the visfatin groups, group 3 patients had significantly higher BMI (p = 0.00), total cholesterol (p = 0.03), C-reactive protein (CRP) (p = 0.03), HOMA-IR (p = 0.03), and LVMI (p = 0.02). In regression analysis, SBP (β = 0.19, p < 0.05) and serum visfatin levels (β = 0.74, p < 0.05) were independent variables affecting LVMI. Conclusion: Serum visfatin might be a sensitive marker than HOMA-IR evaluations for cardiac performance in nondiabetic PD patients.
INTRODUCTION
Obesity is a rapidly growing disease that is characterized by an excessive accumulation of adipose tissue.Citation1 Adipose tissue can be considered an active secretory organ that is able to send and respond to signals that modulate insulin sensitivity, energy expenditure, and inflammation. Obesity and insulin resistance (IR) are associated with an increase of cardiovascular risk factors, including adipocytokines.Citation2
Visfatin is a protein that was described by Fukuhara et al.Citation3 in 2005 to be selectively upregulated in the adipose tissue of rats. The same study demonstrated that visfatin binds and activates the insulin receptor and the authors have speculated that its activity as an insulin mimetic might explain its metabolic effects. However, another study reported that there was no correlation between visfatin levels and various parameters of IR during euglycemic–hyperinsulinemic clamp experiments.Citation4 Therefore, the previous studies evaluating the association between visfatin levels and metabolic profile have yielded inconsistent results.Citation5–8 Especially in peritoneal dialysis (PD) patients little is known about plasma visfatin levels and the association between this adipokine, IR, and cardiovascular risks.
Visfatin has also been linked to impaired endothelial function and angiogenesis and increased levels have shown to predict mortality in patients with chronic kidney disease (CKD).Citation9–11 It is well established that the association between visceral fat and IR is related to increased cardiovascular risk.Citation10 Visfatin has multiple functions in the cardiovascular system. It stimulates growth of vascular smooth muscle cells and endothelial angiogenesis.Citation8,12 Visfatin can also directly affect vascular contractility. In mesenteric arteries of rats, visfatin induces relaxation, suggesting that visfatin is effective in resistance vessels.Citation13 Because only acute effects of visfatin have been demonstrated, further studies are necessary to explore the chronic influence of visfatin on vascular reactivity. Endothelial dysfunction in dialysis patients has negative effects on left ventricular structure and function. Relationship between visfatin, which is thought to be a proinflammatory cytokine, and left ventricular hypertrophy (LVH) has not yet been explored in the literature.
Under this complex interrelation, the aim of this study was to explore the relation of visfatin concentrations with cardiovascular risk factors in nondiabetic PD patients.
METHODS
Patients
In this study, 87 nondiabetic PD patients between January 2009 and January 2010 (44 males, 50%, mean age 48.3 ± 14.5 years) attending our PD center were included. We performed a cross-sectional study on IR and cardiovascular risk parameters of serum visfatin levels in PD patients. Demographic and clinical characteristics, laboratory measurements, and dialysis parameters of the study population at baseline are given in . Inclusion criteria for the study were subjects diagnosed with end-stage renal disease (ESRD) who had received regular PD treatment for at least 6 months and age above 18 years. Patients were excluded if they had used cholesterol-lowering medications or had any acute infection, such as peritonitis or peritoneal catheter exit-site infection for the 4 weeks prior, severe malnutrition (serum albumin <2.5 g/dL), malignancy, or other systemic illness (e.g., rheumatoid arthritis or systemic lupus erythematosus). We also excluded diabetic patients to reduce confounding effects from glucose and lipid metabolism. The study protocol was approved by the local scientific ethics committee and informed consent was obtained from each patient.
Table 1. Demographic, clinical, and biochemical characteristics of the study patients.
Peritoneal Equilibration Test
A simplified version of the peritoneal equilibration test was performed within a month before randomization.Citation14 The dialysate/plasma ratio of creatinine was measured on the completion of the 4-h dwell period. Monthly Kt/V urea was calculated from 24-h collection of dialysate and urine on every visit and Kt/V maintained at ≥1.2 at the time of study. Ultrafiltration failure was defined such that the net ultrafiltration volume was below 400 mL after a 4-h dwell using a dialysis solution.
Anthropometric Analysis and Biochemical Investigations
Body weight was measured to the nearest 0.5 kg with the patient in light clothing and without shoes. Waist circumference was measured at the narrowest point below the lower rib margin and above the iliac crest. All the measurements were evaluated without PD fluid in the peritoneal cavity. Body mass index (BMI) was calculated as weight (kilograms) divided by height squared (meters, m2). Nursing staff measured the systolic blood pressure (SBP) and diastolic blood pressure using standard mercury sphygmomanometers on the right arm of seated participants who had rested for at least 5 min.
Blood was drawn in the morning when patients appeared for routine office assessment after an overnight fast. All patients had a full abdomen at the time of sampling to simulate the actual dialysis condition. Hemoglobin, leukocyte count, creatinine, total protein, cholesterol, triglycerides, and albumin concentration and other biochemical parameters were measured by standard laboratory methods. The insulin level was measured by electro-immunoassay with modular analytics (E 170) insulin kit and glucose was measured with hexokinase spectrophotometrically (Modular Analytics E170 (Immunoassay 2011); Roche Diagnostics, Mannheim, Germany). IR was characterized by the homeostasis model assessment-insulin resistance (HOMA-IR) method and calculated using [fasting insulin (U/mL) × fasting glucose (mmol/L)]/22.5.Citation15 Serum visfatin was assayed using a commercially available enzyme-linked immunosorbent assay (ELISA) (Human Visfatin EIA kit, Ray Biotech, Inc., Norcross, GA, USA). Visfatin peptide chain was evaluated in accordance with the RayBio® Visfatin ELISA model.
Echocardiography
Echocardiography examinations were performed with a 2D, M-mode, pulse wave Doppler, and tissue Doppler echocardiography by using a Hewlett Packard, Sonos 7500 (Andover, MA, USA) with a 2.8 MHz probe. Conventional echocardiography (M-mode and cPWD) measurements were performed according to the American Society of Echocardiography guidelines.Citation16 Left ventricular mass (LVM) was calculated using the Devereux formulaCitation17:
where IVST is the interventricular septal thickness, LVID the left ventricular internal dimension, and LPWT the left posterior wall thickness. The left ventricular mass index (LVMI) was calculated by the formula, LVM/(height)2.7.Citation17 The ratio of early diastolic to late diastolic mitral inflow velocities was measured. Tissue Doppler imaging was performed from the apical four-chamber view, and the images were digitized. Myocardial velocity profiles of the lateral mitral annulus were obtained by placing a 6 mm sample volume at the junction of the mitral annulus and lateral myocardial wall. Early and late diastolic velocities, systolic velocities, and isovolumetric relaxation time were measured from two consecutive cardiac cycles and averaged. The ratio of early to late diastolic mitral annular velocities was calculated.
Statistical Analysis
Statistical analysis was performed using SPSS for Windows, version 13.0 (SPSS Inc., Chicago, IL, USA). All data were expressed as mean ± SD. Geometric means for all log-normally distributed continuous variables were calculated and reported with 95% confidence intervals (CIs), while duration of PD with median values and ranges. If possible, data were logarithmically transformed to achieve a normal distribution. Normally distributed measurements are evaluated with independent simple t-test and reported as mean ± SD, and nonnormally distributed data are evaluated with Mann–Whitney U-test and reported as medians and minimal–maximal values. Factors showing a linear correlation with visfatin (p ≤ 0.05) were included in the analysis. Pearson or Spearman coefficients were employed. Mann–Whitney rank sum U-test or Student t-test was used for statistical analysis to compare differences between groups. Multiple regression analysis was used to determine independent factors affecting the dependent variable (p ≤ 0.05 is considered significant).
RESULTS
Patient Characteristics and Comparison between Patients with and without IR
Totally, 87 nondiabetic PD patients were randomized and serum visfatin levels assayed in this study. According to patients’ dialysis treatments 45 patients (52%) used standard glucose solutions and icodextrin dwell during the night, and 42 patients (48%) used glucose-containing solutions without icodextrin. Liberal use of 2.27% or 3.36% glucose was allowed in order to reach ultrafiltration goals. Clinical characteristics of the subjects studied are summarized in .
According to HOMA-IR levels patients were examined as insulin-resistant (IR) (HOMA-IR ≥ 2.0, n = 35) and noninsulin-resistant (non-IR) (HOMA-IR < 2.0, n = 52) groups. IR was determined as %40 of all study patients. IR patients had statistically higher visfatin levels than non-IR patients (46.6 ± 12.2 vs. 36.6 ± 13.3; p = 0.00; ). The IR group had higher PD duration (4.8 ± 2.1 vs. 3.2 ± 1.1: p = 0.01), BMI (29.1 ± 6.2 vs. 25.3 ± 4.1: p = 0.01), serum creatinine (10.3 ± 2.1 vs. 9.1 ± 2.7; p = 0.04), uric acid (7.4 ± 1.2 vs. 5.6 ± 1.9; p = 0.00), total cholesterol (215.2 ± 51.2 vs. 173.4 ± 46.9; p = 0.00), C-reactive protein (CRP) (9.4 ± 7.2 vs. 4.7 ± 4.1; p = 0.03), and serum visfatin levels (46.6 ± 12.2 vs. 36.6 ± 13.3; p = 0.00) than non-IR group.
Figure 1. Box plots representing the distribution of serum visfatin levels in control insulin-resistant (IR) and noninsulin-resistant (non-IR) groups; Kruskal–Wallis test (p = 0.00).
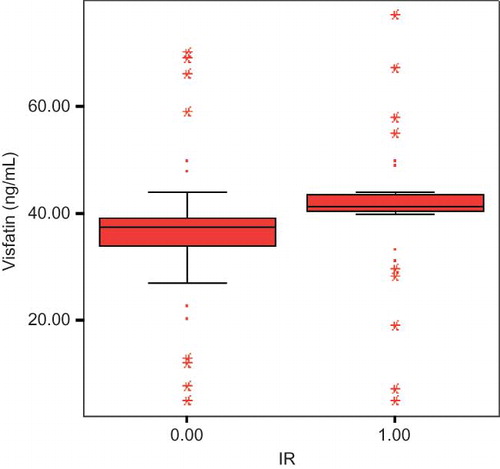
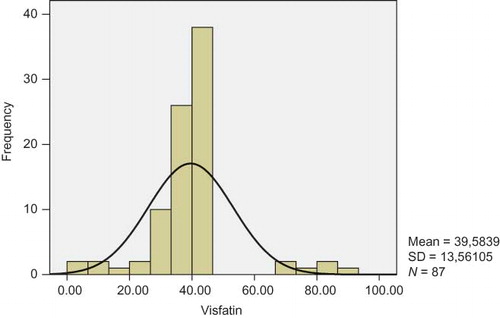
Figure 2. Histogram for evaluation of data distribution for serum visfatin levels.
Correlations between Serum Visfatin Levels and LVMI
Mean serum visfatin levels and median serum visfatin values were calculated as 39.5 ± 13.5 and 40 ng/mL, respectively. Visfatin data were not normally distributed ().
Pearson correlation analysis was performed and PD duration (r = 0.588, p = 0.04), BMI (r = 0.287, p = 0.03), serum fasting glucose (r = 0.304, p = 0.04), serum creatinine (r = 0.444, p = 0.00), serum uric acid (r = 0.531, p = 0.04), total cholesterol (r = 0.396, p = 0.03), LDL (r = 0.340, p = 0.00), serum CRP (r = 0.434, p = 0.00), serum HOMA-IR (r = 0.279, p = 0.04), and LVMI (r = 0.261, p = 0.01) were positively correlated with serum visfatin levels.
Patients were divided into two groups by median visfatin value (39.5 ± 13.5 ng/mL): group I had low values (31.5 ± 9.3) and group II had high values (average value 49.9 ± 8.7).
Patients in group II had significantly higher BMI (p = 0.00), serum total cholesterol (p = 0.04), CRP (p = 0.03), HOMA-IR (p = 0.03), and LVMI (p = 0.02) than patients in group I.
In an another step, we further explored these clinical and laboratory parameters by multiple linear regression analyses with age, PD duration, fasting blood glucose, creatinine, uric acid, serum electrolyte, total cholesterol, CRP, insulin, HOMA-IR, ejection fraction values, and LVMI as independent variables. It becomes apparent that total cholesterol, CRP, and LVMI were affecting serum visfatin levels ().
Table 2. Stepwise linear regression analysis with visfatin as dependent variable (n = 87, r2 = 0.68).
Table 3. Stepwise linear regression analysis with LVMI as dependent variable (n = 87, r2 = 0.54).
Mean LVMI was calculated as 138.6 ± 25.6 g/m2. Pearson correlation analysis was performed and BMI (r = 0.478, p = 0.01), SBP (r = 0.621, p = 0.04), and serum visfatin levels (r = 0.493, p = 0.03) were positively and hemoglobin (r = −0.405, p = 0.02) and ejection fraction levels (r = −0.288, p = 0.04) were negatively correlated with LVMI.
In multiple linear regression analyses it becomes apparent that SBP and serum visfatin levels were affecting LVMI ().
DISCUSSION
PD is generally well tolerated and effective for most patients requiring a renal replacement therapy. The prevalence of metabolic abnormalities is especially high in those on PD, because of the glucose load from the dialysate.Citation18 This “glucose load” is believed to contribute to cardiometabolic complications, especially elevated circulating insulin levels and hyperlipidemia, in these patients.Citation18,19 In this study, we aimed to identify the relationships of visfatin concentrations to metabolic complication and cardiovascular risk factors which were determined by IR and LVMI in PD patients.
In PD patients carbohydrate metabolism disorders are monitored more frequently than in hemodialysis patients; for this reason, we focused only on PD patients. Many studies reported that fasting glucose, Hemoglobin A1c (HbA1c), and HOMA index values were higher in PD patients.Citation20–25 We analyzed factors leading to IR such as duration of PD, BMI, serum creatinine, uric acid, total cholesterol, and CRP levels. This metabolic profile depends on glucose load from the dialysate. All over the world, the progress and duration of dialysis treatment is prolonged as a result of better medical care. Accordingly, diabetes and comorbid diseases such as cardiovascular disease (CVD) are also increasing. Glucose exposure and its toxic effects are increasing according to duration of PD as documented in our study. Proinflammatory transcription factors were triggered due to lack of effectiveness of insulin in a state of IR.Citation26,27 This unusual cascade reactivates the mitochondrial reactive oxygen molecules in the inflammatory process.Citation28 In accordance to this mechanism, the presence of IR was closely associated with markers of inflammation (serum CRP levels in our study population). Ineffective hyperinsulinism will cause a discharge of free fatty acids into the blood via effects of cytokines such as interleukin-6 (IL-6) and tumor necrosis factor (TNF). After all, IR is closely related with dyslipidemia that is demonstrated in our study.
Visfatin is a protein that is released from adipose tissue and contributes to IR and inflammation by affecting TNF and IL-6 levels, as described in 2005 by Fukuhara et al.Citation3,28,29 The mean visfatin levels of our study population were measured as 40 ng/mL and the value is compatible with literature in PD patients. Circulating visfatin levels were closely related with duration of PD, BMI, fasting blood glucose, urea, creatinine, uric acid, total cholesterol, LDL, CRP, IR, and LVMI. Visfatin uses the same receptor as insulin to be effective and serum levels are increased in the presence of IR.Citation3 Early in vitro studies reported that visfatin stimulates insulin receptors in various cells, upregulates glucose transport and lipogenesis in adipose cells and myocytes, and decreases gluconeogenesis in hepatocytes.Citation30–32 Our results display the close relationship between visfatin, fasting glucose, and IR. In addition, visfatin may be involved in various cellular processes, including dyslipidemia and metabolic pathways. Krzyzanowska et al.Citation33 reported that total cholesterol and LDL were positively correlated with serum visfatin levels. Serum visfatin and blood lipids have an inverse correlation. Studies that focused on serum lipid and visfatin have not been conclusive, since factors affecting serum visfatin levels such as gender, age, lifestyle, obesity, and comorbid diseases were not taken into account. We found that visfatin was an independent factor for CVD after adjusting for potential confounders such as total cholesterol, CRP, and LVMI in regression analyses.
Increased serum visfatin level is related with mortality by cardiovascular risks in ESRD patients.Citation11 In CKD, serum visfatin levels were elevated with atherosclerotic and proinflammatory status.Citation11,34 Increased serum visfatin levels are in close relation with increased proinflammatory cytokine pre-B cell colony-exchange factor. The major finding of this study was that serum CRP levels are related to visfatin levels in a contradictory way. Also, IL-6 and TNF-α levels are associated with LVH and LVMI in dialysis patients.Citation35 These might explain the effects of proinflammatory cytokines on left ventricular function; however, the mechanism behind this effect is not studied in detail. Also it is well established that inflammatory state and endothelial dysfunction have negative effects on left ventricular structure and function.Citation35 Erten et al.Citation36 recently showed that visfatin levels are higher in continuous ambulatory peritoneal dialysis (CAPD) patients than their counterparts on hemodialysis and healthy controls. They found that visfatin levels are not related to LVM; however, visfatin had negative effects on the diastolic left ventricular function. Although the primary aim of that study was not investigating the role of visfatin on LVMI, the indirect evidence suggests that visfatin is involved in the pathogenesis of LVH. Serum visfatin levels can affect LVMI in proinflammatory environment as shown in our study.
Hypertension is very common in ESRD and is closely related with fluid load in PD patients.Citation37 Most patients suffer with varying degrees of LVH and high LVMI as a result of hypertension that is diagnosed by echocardiography.Citation38 We determined that high LVMI is related with high blood pressure and low hemoglobin levels. It is shown that anemia plays a very important role in the remodeling of the left ventricle.Citation39 In anemia, oxygen is not provided to the heart muscle and compensatory hypertrophic process occurs.Citation40 We found higher LVMI in anemic PD patients in accordance with the literature.
In conclusion, circulating visfatin has been implicated in numerous physiologic and pathological events, including obesity, inflammation, and cardiac performance. Accordingly, the measurement of visfatin may be valuable for risk assessment and treatment of PD patients. Further controlled studies in larger patient groups are needed to analyze this unclear topic with new clinical and therapeutic implications.
Declaration of interest: The authors report no conflicts of interest. The authors alone are responsible for the content and writing of the paper.
REFERENCES
- Kahn BB, Flier JS. Obesity and insulin resistance. J Clin Invest. 2000;106:473–481.
- Fantuzzi G. Adipose tissue, adipokines, and inflammation. J Allergy Clin Immunol. 2005;115:911–919.
- Fukuhara A, Matsuda M, Nishizawa M, . Visfatin: A protein secreted by visceral fat that mimics the effects of insulin. Science. 2005;307:426–430.
- Berndt J, Kloting N, Kralisch S, . Plasma visfatin concentrations and fat depot-specific mRNA expression in humans. Diabetes. 2005;54:2911–2916.
- Ingelsson E, Larson MG, Fox CS, . Clinical correlates of circulating visfatin levels in a community based sample. Diabetes Care. 2007;30:1278–1280.
- Filippatos TD, Derdemezis CS, Kiortisis DN, . Increased plasma levels of visfatin/pre-B cell colony enhancing factor in obese and overweight patients with metabolic syndrome. J Endocrinol Invest. 2007;30(4):323–326.
- Kenji O, Kiminori Y, Nozomu K, . Circulating visfatin level is correlated with inflammation, but not with insulin resistance. Clin Endocrinol (Oxf). 2007;67(5):796–800.
- Pagano C, Pilon C, Olivieri M, . Reduced plasma visfatin/pre-B cell colony-enhancing factor in obesity is not related to insulin resistance in humans. J Clin Endocrinol Metab. 2006;91(8):3165–3170.
- Takebayashi K, Suetsugu M, Wakabayashi S, Aso Y, Inukai T. Association between plasma visfatin and vascular endothelial function in patients with type 2 diabetes mellitus. Metab Clin Exp. 2007;56:451–458.
- Adya R, Tan BK, Punn A, Chen J, Randeva HS. Visfatin induces human endothelial VEGF and MMP-2/9 production via MAPK and PI3K/Akt signalling pathways: Novel insights into visfatin-induced angiogenesis. Cardiovasc Res. 2008;78:356–365.
- Axelsson J, Witasp A, Carrero JJ, . Circulating levels of visfatin/ pre-B-cell colony-enhancing factor 1 in relation to genotype, GFR, body composition, and survival in patients with CKD. Am J Kidney Dis. 2007;49:237–244.
- Wang P, Xu TY, Guan YF, Su DF, Fan GR, Miao CY. Perivascular adipose tissue-derived visfatin is a vascular smooth muscle cell growth factor: Role of nicotinamide mononucleotide. Cardiovasc Res. 2009;81:370–380.
- Yamawaki H, Hara N, Okada M, Hara Y. Visfatin causes endothelium dependent relaxation in isolated blood vessels. Biochem Biophys Res Commun. 2009;383:503–508.
- Twardowski ZJ, Nolph KD, Khanna R. Peritoneal equilibration test. Perit Dial Bull. 1987;7:138–147.
- Matthews DR, Hosker JP, Rudenski AS. Homeostasis model assessment: Insulin resistance and beta-cell function from fasting plasma glucose and insulin concentrations in man. Diabetologia. 1985;28:412–419.
- Sahn DJ, De Maria A, Kisslo J, Weyman A. Recommendations regarding quantitation in M-mode echocardiography: Results of a survey of echocardiographic measurements. Circulation. 1978;58:1072–1083.
- Devereux RB, Alonso DR, Lutas EM, . Echocardiographic assessment of left ventricular hypertrophy: Comparison to necropsy findings. J Am Coll Cardiol. 1986;57:450–458.
- Witowski J, Korybalska K, Wisniewska J. Effect of glucose degradation products on human peritoneal mesothelial cell function. J Am Soc Nephrol. 2000;11:729–739.
- Davies SJ, Phillips L, Naish PF. Peritoneal glucose exposure and changes in membrane solute transport with time on peritoneal dialysis. J Am Soc Nephrol. 2001;12:1046–1051.
- Holmes C, Shockley T. Strategies to reduce glucose exposure in peritoneal dialysis patients. Perit Dial Int. 2000;20:S37–S41.
- Mistry CD, Gokal R, Peers E, MIDAS study group. A randomized multicenter clinical trial comparing isosmolar icodextrin with hyperosmolar glucose solution in CAPD. Kidney Int. 1994;46:496–503.
- Heimburger O, Waniewski J, Werynski A, . A quantitative description of solute and fluid transport during peritoneal dialysis. Kidney Int. 1992;41:1320–1332.
- Desanto NG, Capodicasa G, Senatore R, . Glucose utilization from dialysate in patients on CAPD. Int J Artif Organs. 1979;2:119–125.
- Grodstein GP, Blumenkrantz MJ, Kopple JD, . Glucose absorption during continuous ambulatory peritoneal dialysis. Kidney Int. 1981;19:564–567.
- DeFronzo RA, Alvestrand A, Smith D, Hendler R, Hendler E, Wahren J. Insulin resistance in uremia. J Clin Invest. 1981;67:563–568.
- Dandona P, Aljada A, Chaudhuri A, Mohanty P, Garg R. Metabolic syndrome: A comprehensive perspective based on interactions between obesity, diabetes, and inflammation. Circulation. 2005;111:1448–1454.
- El-Atat FA, Stas SN, McFarlane SI, Sowers JR. The relationship between hyperinsulinemia, hypertension and progressive renal disease. J Am Soc Nephrol. 2004;15:2816–2827.
- Wellen KE, Hotamisligil GS. Inflammation, stress, and diabetes. J Clin Invest. 2005;115:1111–1119.
- Fortes PC, Mendes JG, Riella MC, Pecoits-Filho R. Carbohydrate metabolism disturbances in non-diabetic patients on peritoneal dialysis [Abstract]. Perit Dial Int. 2006;26(Suppl. 2):S26.
- Juge-Aubry CE, Henrichot E, Meier CA. Adipose tissue: A regulator of inflammation. Best Pract Res Clin Endocrinol Metab. 2005;19(4):547–566.
- Haider DG, Schindler K, Schaller G, Prager G, Wolzt M, Ludvik B. Increased plasma visfatin concentrations in morbidly obese subjects are reduced after gastric banding. J Clin Endocrinol Metab. 2006;91(4):1578–1581.
- Chen MP, Chung FM, Chang DM, . Elevated plasma level of visfatin/pre-B cell colony enhancing factor in patients with type 2 diabetes mellitus. J Clin Endocrinol Metab. 2006;91(1):295–299.
- Krzyzanowska K, Krugluger W, Mittermayer F, Rahma R, Haider D, Shnawa N. Increased visfatin concentrations in women with gestational diabetes mellitus. Clin Sci. 2006;1: 605–609.
- D´ıez JJ, Iglesias P, Fern´andez-Reyes MJ, . Serum concentrations of leptin, adiponectin and resistin, and their relationship with cardiovascular disease in patients with end-stage renal disease. Clin Endocrinol (Oxf). 2005;62:242–249.
- Stenvinkel P, Ketteler M, Johnson RJ, . IL-10, IL-6, and TNF-alpha: Central factors in the altered cytokine network of uremia—the good, the bad, and the ugly. Kidney Int. 2005;67:216–233.
- Erten Y, Ebinç FA, Ebinç H, . The relationship of visfatin levels to inflammatory cytokines and left ventricular hypertrophy in hemodialysis and continuous ambulatory peritoneal dialysis patients. Ren Fail. 2008;30:617–623.
- Cottone S, Nardi E, Mule G, . Association between biomarkers of inflammation and left ventricular hypertrophy in moderate chronic kidney disease. Clin Nephrol. 2007;67(4):209–216.
- Pannier B, Guerin AP, Marchais SJ, Metivier F, Safar ME, London GM. Postischemic vasodilation, endothelial activation, and cardiovascular remodeling in end-stage renal disease. Kidney Int. 2000;57(3):1091–1099.
- London GM, Blacher J, Pannier B, Guérin AP, Marchais SJ, Safar ME. Arterial wave reflections and survival in end-stage renal failure. Hypertension. 2001;38:434–438.
- Rongvaux A, Shea RJ, Mulks MH, . Pre-B-cell colony-enhancing factor, whose expression is up-regulated in activated lymphocytes, is a nicotinamide phosphoribosyltransferase, a cytosolic enzyme involved in NAD biosynthesis. Eur J Immunol. 2002;32:3225–3234.