Abstract
Background/aim: Epidemiological studies have shown that low birth weight (LBW) is associated with a higher incidence of hypertension in adulthood. LBW may affect the kidney development, which in turn leads to impaired renal function and hypertension. Methods: Sprague-Dawley rats were fed isocaloric diets containing either 21% (w/w) (control group) or 10% (w/w) (LBW group) protein throughout pregnancy and chow during lactation. Renal function and structure of the offspring were measured from birth to 3 months. Results: At 3 weeks and 2 months, there was no difference in the volume of 24 h urine protein between the two groups. However, the volume was higher (117.17 ± 10.40 vs. 79.28 ± 14.26, p < 0.01) in LBW group at 3 months. Maternal protein intake did not alter serum creatinine in this study, but urine creatinine was lower in LBW group at 2 and 3 months. The creatinine clearance rate (Ccr) was significantly lower in LBW group than in control group at all time points. Glomerular number was reduced significantly in LBW group (22,720 ± 639 vs. 28,520 ± 526, p < 0.01) at 2 months, which was accompanied by an increase in blood pressure. There was a statistically significant negative correlation between the blood pressure and the glomerular number at 2 months (r = −0.919, p = 0.008). Conclusions: These data showed that abnormal kidney development and renal dysfunction occurred in LBW rats due to a maternal low-protein diet. Possessing a decreased glomerular number might be a risk factor for hypertension in LBW rats.
INTRODUCTION
Low birth weight (LBW) is an important public health problem in the world. Clinical and research data showed LBW is associated with increased risk of metabolic syndrome in adulthood and have led to the fetal origins hypothesis of adult disease.Citation1–3 Fetal programming occurring at critical developmental stages may provide a survival strategy and serve to optimize growth, but it may also induce irreversible structural and physiologic changes.Citation4 Restricted nutrition during pregnancy could persistently alter the metabolic and physiological capacity of the offspring.Citation5–8 Although programming of insulin resistanceCitation9 and altered glucose metabolismCitation10,11 by maternal dietary restriction during pregnancy and lactation have been demonstrated in animal models, there were marked differences between reports of the effects on blood pressure. Most epidemiological studies showed that LBW was associated with a higher incidence of hypertension in adulthood.Citation12–14 However, Min et al.Citation15 claimed that birth weight was not directly associated with blood pressure.
In 1988, Brenner et al.Citation16 found that the number of glomerulus was inversely correlated with the risk of developing hypertension in rats, and they then put forward the hypothesis that decreased glomerular number was an independent risk for hypertension. Spencer et al.Citation17 found that kidney was obviously smaller in LBW than in normal birth weight Australian aboriginal inhabitants. Organ-selective growth was reported in the offspring of protein-restricted mothers, and Desai et al.Citation18 found that kidney decreased proportionately with body weight. Also, the number of glomerulus increased by about 80,000 with a 100 g increase in birth weight.Citation19 How early life events, such as LBW resulting from maternal protein malnutrition, influence kidney structure and renal function remains unclear. Therefore, we assume that LBW may affect the kidney development, which in turn leads to impaired renal function and hypertension. In this study, we adopt a well-established rat model of fetal programming to study the effect of LBW on renal development and function and blood pressure. In detail, LBW rats were obtained by means of feeding maternal rats with low-protein diet, and normal birth weight ones were obtained as the control by feeding with normal diet. Then renal structure, renal functions, and dynamic change of blood pressure were investigated from birth to 3 months.
METHODS AND MATERIALS
Experimental Animals and the Diet
Animal care and experimental protocols were approved by the Experimental Animal Center of the Second Xiangya Hospital of Central South University. In total 32 three-month-old Sprague-Dawley (SD) rats, 16 males and 16 females weighing between 250 and 300 g, were involved in this study. They were acclimatized to laboratory conditions for 7 days, and then the male and female rats were placed in individual cages with a ratio of 1:1. When a vaginal plug appeared, that day was designated as gestation day 1 of pregnancy.
shows the composition of normal diet and low-protein diet. The low-protein diet was made in our Experimental Animal Center using the ingredients of normal diet and replacing part of its protein with maize starch and barley grain. The amount of maize starch and barley grain was calculated to make up for the decrease in energy content due to protein reduction.
Table 1. Composition of the diets.
Experiment Methods of Animals
Pregnant rats were randomly divided into LBW group and control group. The LBW model was modified from that previously described by Yuan et al.Citation20 The pregnant rats of LBW group in their study were fed 10% low-protein diet during pregnancy and lactation. In our group, the pregnant rats in LBW group were fed 10% low-protein diet only during pregnancy, and 21% normal protein diet was given to the maternal rats during lactation. There were 6–8 offspring in every nest during lactation, excluding the nest with more than 12 offspring or less than 6. Six rats entered the study at every time point.
Measurement of Systolic Blood Pressure
Systolic blood pressure was measured indirectly in a conscious, prewarmed, and slightly restrained rat by the tail cuff methodCitation21 at the age of 2 and 3 months, respectively, with type HX-II Animal Blood Pressure Measurement and LMS two-way (2B) channel physiological recorder (Department of Physiology, Central South University, Changsha, China). An average of three consecutive readings was noted. For these measurements, rats were trained adequately before the study.
Determination of Glomerular Number
Glomerular number was determined according to the method of acid digestion previously described by Bankir et al.Citation22 and Martins et al.Citation23 Briefly, 5 two-month-old rats from each group received an intra-arterial infusion of 0.2 mL per 100 g body weight of 5% Alcian Blue 8GX dye (Sigma, Poole, Dorset, UK) for 10 min, after which the animal was killed with an overdose of anesthetic. The entire right kidney was removed, weighed, cut into small pieces, and immersed in 1% ammonia solution at room temperature. After 2 h, the kidney sections were digested in 50% hydrochloric acid for 90 min at 37°C. After mechanical dissociation, the homogenate was made up to 10 mL with distilled water. Ten aliquots of 20 μL solution was spread on slides over an area of 4.5 cm2 for the estimation of glomeruli by two researchers in a blinded fashion using a light microscope. The average was decided as the glomerulus number in each aliquot to calculate the total glomeruli in the right kidney.
Measurement of Renal Function
Blood was collected at the age of 3 weeks, 2 months, and 3 months by cutting the head after intraperitoneal (i.p.) injection of 10% chloral hydrate (0.35 mL/100 g, i.p.) for anesthesia. After collecting, the blood was kept still for 5 min to make it coagulate and centrifuged at 950 × g at room temperature; then the supernatant was stored at −70°C. Twenty-four hour urine sample was collected in metabolic cages. The urine volumes were measured and one sample of 2 mL was centrifuged for 3 min at 950 × g at room temperature; then the supernatant was stored at −70°C. Serum creatinine (Scr), blood urea nitrogen (BUN), urine creatinine (Ucr), and 24 h urine protein were measured by auto-analyzer (Hitachi 7600-020; Hitachi Ltd., Tokyo, Japan). Creatinine clearance rate (Ccr) was calculated according to the following equation: Ccr = Ucr × 24 h urine volume/(Scr × 24 × 60 min).
Statistical Analyses
All results were shown in the form of mean ± standard deviation (mean ± SD). Student’s t-test was performed to detect differences in means between the two groups and chi-square (χ2) test for proportion differences. Correlation analysis was utilized to study correlations between the blood pressure and the glomerular number or kidney weight. SPSS for Windows (version 13.0, SPSS, Chicago, IL, USA) statistical packages were used for data analysis and plotting of graphs. All tests were considered statistically significant at a value of p < 0.05.
RESULTS
LBW Model Building
Fourteen out of 16 female rats became pregnant after continuing circular mating for 7 days. All pregnant rats labored during gestation days 20–23, without miscarriage. shows the baseline characteristics of the study groups. There was no difference in the average litter size between the two groups. The body weight of offspring was significantly lower in LBW group (5.99 ± 0.57 g) compared to control group (6.96 ± 0.47 g) (p < 0.01), which was accompanied with higher incidence of LBW and perinatal mortality.
Table 2. Baseline characteristics of the study groups.
Comparison of Body Weight and Kidney Weight between the Two Groups
presents the comparison of body weight and kidney weight between LBW group and control group at 1 week, 3 weeks, 2 months, and 3 months of their age. The offspring rats in LBW group exhibited stage catch-up growth. The body weight and the right kidney weight were significantly lower in LBW group than in control group at 1 week and 2 months, while there was no difference at 3 weeks and 3 months. There was no difference in the ratios of kidney weight to body weight between the two groups.
Table 3. Comparison of body weight and right kidney weight of offspring rats between the two groups.
Comparison of Glomerular Number between the Two Groups
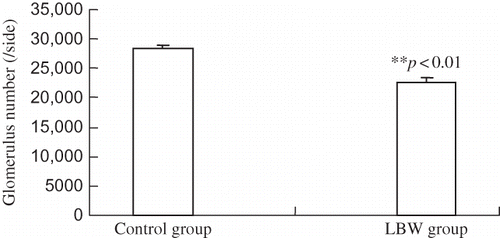
Glomerular number of the right kidney was determined by acid digestion at 2 months of age. The average glomerular number in LBW group was significantly lower than in control group—(22,720 ± 639) per one side versus (28,520 ± 526) per one side (p < 0.01) as shown in .
Figure 1. Comparison of the glomerular number between two groups at 2 months.
Notes: Bars represent the total glomerular number of the right kidney (mean ± SD) determined by acid digestion. Analyses of means were by Student’s t-test.
**p < 0.01 compared with control group.
Comparison of Blood Pressure between the Two Groups
shows the comparison of blood pressure between the two groups. Blood pressure in LBW group was higher than in control group, (120.03 ± 8.31) versus (96.28 ± 5.82) mmHg (p < 0.01) at 2 months of age. Elevated blood pressure in LBW group and control group was found at 3 months of age, (127.03 ± 7.13) and (109.75 ± 9.26) mmHg (p < 0.05), respectively. The former was higher than the latter (p < 0.05).
Table 4. Comparison of blood pressure between the two groups at 2 and 3 months.
Table 5. Comparison of Scr, BUN, Ucr, Ccr, and 24 h urine protein between the two groups.
Comparison of Renal Function between the Two Groups
The comparison of Scr, BUN, Ucr, Ccr, and 24 h urine protein at different time points between the two groups is shown in . There was no difference in Scr between the two groups at the age of 3 weeks, 2 months, and 3 months. BUN of the LBW group was higher than that of the control group (p < 0.05) at 3 months of age. Significant difference in 24 h urine protein between the two groups was also found at 3 months of age (p < 0.01). Ucr in LBW group was significantly lower than in control group at 2 and 3 months of age. Ccr was significantly lower in LBW group at all time points than that in control group.
Correlation between Blood Pressure and the Glomerulus Count or Kidney Weight
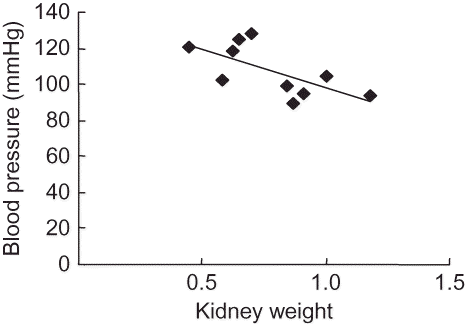
There was a significant and negative correlation between blood pressure and glomerular number or kidney weight in both groups at 2 months of age, (r = −0.919, p = 0.008) (), (r = −0.697, p = 0.012) (), respectively.
Figure 2. Correlation between blood pressure and glomerular number in the offspring rats at 2 months.
Note: There was a statistically significant correlation between blood pressure and glomerular number of the right kidney determined by acid digestion in both groups at 2 months of age (r = −0.919, p = 0.008).
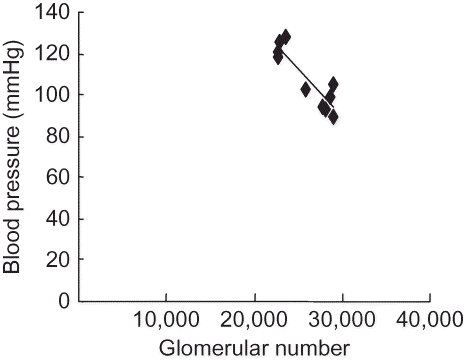
Figure 3. Correlation between blood pressure and right kidney weight in the offspring rats at 2 months.
Note: There was a statistically significant negative correlation between blood pressure and kidney weight in both groups at 2 months of age (r = −0.697, p = 0.012).
DISCUSSION
With the increasing survival rate of LBW infants in recent years, people pay more attention to the effect of LBW on their long-term life quality. Since BarkerCitation24 first discovered the correlation between LBW and cardiovascular diseases, many epidemiologic and clinical studies have shown that LBW is one of the relative independent risk factors for adverse cardiovascular events.Citation2,3,25–28 However, only few studies showed the correlation between LBW and renal structure or function or hypertension in adults.Citation15,17,29
This study showed that the average birth weight of offspring in LBW group was significantly lower than that in control group, and higher perinatal mortality was found in LBW group. Then, the offspring rats in LBW group showed stage catch-up growth during childhood and adolescence. In detail, at the age of 3 weeks for ablactation, body weight and kidney weight of the offspring rats in LBW group recuperated to that of control group. Subsequently, from 3 weeks to 2 months of age, their growth rate was lower than that in control group. While in the period of adolescent development from 2 to 3 months of age, they exhibited catch-up growth once again, and up to 3 months of age, their body weight and kidney weight again reached that of control group. So far, the mechanism of this growth pattern of LBW rats has not been discovered. There was no difference in the ratios of kidney weight to body weight between the two groups at all time points, which conformed to the conclusion reported by Desai et al.Citation18 that LBW offspring rats exhibited a selective organ growth.
The average blood pressure of offspring rats at the age of 2 and 3 months in control group was 96.28 and 109.75 mmHg, respectively, which was almost consistent with the conclusion reported by Unger et al.Citation21 that the systolic blood pressure of SD rat measured with tail cuff method was about 100 mmHg. Comparing with the control group, the blood pressure of offspring rats in LBW group increased by 24.9% and 15.7%, respectively. LBW rats suffered hypertension in adult, even in puberty. To date, it remains unknown whether abnormal kidney development of LBW infants leads to hypertension in adulthood. Our study showed that glomerular number in LBW group was decreased by about 20.34% than control group at 2 months of age. The number of glomerulus is predetermined to a certain extent, but intrauterine malnutrition may affect nephron development in LBW group and even result in its permanent loss. In this study, there was a significant negative correlation between blood pressure and glomerular number or kidney weight. Decrease of glomerular number led to compensatory hypertrophy, high perfusion, or sclerosing necrosis of nephron, which may result in hypertension.Citation30 Therefore, a decrease in the glomerular number may be an important factor of hypertension in LBW rats. However, the exact mechanism by which maternal malnutrition during pregnancy persistently alters the glomerular number and development in the offspring rats remains unclear. Whether the decrease of glomerular number in LBW rats leads to compensatory hypertrophy and sclerosis of survival glomeruli should be further investigated.
Epidemiological study on the relation between birth weight and renal function showed that LBW may lead to impaired renal function in adult, rather than in adolescence.Citation29 In this study, there was no difference of Scr, BUN, and 24 h urine protein between LBW group and control group before 2 months of age, but a difference in BUN and 24 h urine protein volume occurred at 3 months of age. Excretion of 24 h protein in LBW group was greater by 47.8% than control group, and great amount of proteinuria would further deteriorate renal functions. Till now, there were few reports on Ccr in LBW infants, which was found from 3 weeks old in this study. At the age of 3 weeks, 2 months, and 3 months, Ccr in the LBW group decreased by 33.3%, 18.9%, and 37.1%, respectively. Early damage of renal functions may be diagnosed by monitoring Ccr in LBW infants.
LBW infants may have abnormal kidney development, decrease in glomerular number, and impaired renal functions and hypertension during their development period. In the future studies, we will further explore the detailed mechanism by which LBW leads to abnormal kidney development. Meanwhile, we will also explore nutrition intervention for LBW infants during early life, in order to prevent against chronic renal diseases and hypertension in adulthoods, as well as to improve their short-term and long-term quality of life.
ACKNOWLEDGMENT
This work was supported in part by the Metabolic Syndrome Research Center of Central South University (Grant no. DY-2008-02-01).
Declaration of interest: The authors report no conflicts of interest. The authors alone are responsible for the content and writing of the paper.
REFERENCES
- Boney CM, Verma A, Tucker R, . Metabolic syndrome in childhood: Association with birth weight, maternal obesity, and gestational diabetes mellitus. Pediatrics. 2005;115(3):e290–e296.
- Barker DJP. Fetal origins of coronary heart disease. BMJ. 1995;311(6998):171–174.
- Nobili V, Alisi A, Panera N, . Low birth weight and catch-up-growth associated with metabolic syndrome: A ten year systematic review. Pediatr Endocrinol Rev. 2008;6(2):241–247.
- Lucas A. Programming by early nutrition: An experimental approach. J Nutr. 1998;128(2 Suppl.):401S–406S.
- Godfrey KM. Maternal regulation of fetal development and health in adult life. Eur J Obstet Gynecol Reprod Biol. 1998; 78(2):141–150.
- Burdge GC, Delange E, Dubois L, . Effect of reduced maternal protein intake in pregnancy in the rat on the fatty acid composition of brain, liver, plasma, heart and lung phospholipids of the offspring after weaning. Br J Nutr. 2003;90(2):345–352.
- Burdge GC, Phillips ES, Dunn RL, . Effect of reduced maternal protein consumption during pregnancy in the rat on plasma lipid concentrations and expression of peroxisomal proliferator–activated receptors in the liver and adipose tissue of the offspring. Nutr Res. 2004;425(1):69–78.
- Yates Z, Tarling EJ, Langley-Evans SC, . Maternal undernutrition programmes atherosclerosis in the ApoE*3-Leiden mouse. Br J Nutr. 2009;101(8):1185–1194.
- Sugden MC, Holness MJ. Gender-specific programming of insulin secretion and action. J Endocrinol. 2002;175(3):757–767.
- Desai M, Byrne CD, Zhang J, . Programming of hepatic insulin-sensitive enzymes in offspring of rat dams fed a protein-restricted diet. Am J Physiol. 1997;272(5 Pt 1):G1083–G1090.
- Desai M, Byrne CD, Meeran K, . Regulation of hepatic enzymes and insulin levels in offspring of rat dams fed a reduced-protein diet. Am J Physiol. 1997;273(4 Pt 1):G899–G904.
- Holland FJ, Stark O, Ades AE, . Birth weight and body mass index in childhood, adolescence, and adulthood as predictors of blood pressure at age 36. J Epidemiol Community Health. 1993;47(6):432–435.
- Curhan GC, Chertow GM, Willett WC, . Birth weight and adult hypertension and obesity in women. Circulation. 1996; 94(6):1310–1315.
- Huxley RR, Shiell AW, Law CM. The role of size at birth and postnatal catch-up growth in determining systolic blood pressure: A systematic review of the literature. J Hypertens. 2000; 18(7):815–831.
- Min JW, Kong KA, Park BH, . Effect of postnatal catch-up growth on blood pressure in children at 3 years of age. J Hum Hypertens. 2007;21(11):868–874.
- Brenner BM, Garcia DL, Anderson S. Glomeruli and blood pressure. Less of one, more the other. Am J Hypertens. 1988; 1(4 Pt 1):335–347.
- Spencer J, Wang Z, Hoy W. Low birth weight and reduced renal volume in aboriginal children. Am J Kidney Dis. 2001;37(5):915–920.
- Desai M, Crowther NJ, Lucas A, . Organ-selective growth in the offspring of protein-restricted mothers. Br J Nutr. 1996;76(4):591–603.
- Sane SY, Fall CHD, Shenoy A. Effects of intrauterine growth retardation on organ weight and development of renal nephrons: A prospective autopsy study of human neonates. Pediatr Res. 2001;50(Suppl. 1):44.
- Yuan K, Xie ZD, Hu JT, . Influence of taurine supplementation on ultrastructure of Islet β cells in neonatal rats with low birth weight. J Appl Clin Pediatr. 2006;21(14):898–899.
- Unger BS, Patil BM. Apocynin improves endothelial function and prevents the development of hypertension in fructose fed rat. Indian J Pharmacol. 2009;41(5):208–212.
- Bankir L, Hollenberg NK. In vivo staining of the kidney with Alcian blue: An adjunct to morphological and physiological studies. Ren Physiol. 1983;6(3):151–155.
- Martins JP, Monteiro JC, Paixao AD. Renal function in adult rats subjected to prenatal dexamethasone. Clin Exp Pharmacol Physiol. 2003;30(1–2):32–37.
- Barker DJP, Bull AR, Osmond C, . Fetal and placental size and risk of hypertension in adult life. BMJ. 1990;301(6746):259–262.
- Hovi P, Andersson S, Eriksson JG, . Glucose regulation in young adults with very low birth weight. N Engl J Med. 2007;356(20):2053–2063.
- Skilton MR. Intrauterine risk factors for precocious atherosclerosis. Pediatrics. 2008;121(3):570–574.
- Banci M, Saccucci P, Dofcaci A, . Birth weight and coronary artery disease. The effect of gender and diabetes. Int J Biol Sci. 2009;5(3):244–248.
- Robinson SM, Batelaan SF, Syddall HE, . Combined effects of dietary fat and birth weight on serum cholesterol concentrations: The Hertfordshire Cohort Study. Am J Clin Nutr. 2006; 84(1):237–244.
- Hallan S, Euser AM, Irgens LM, . Effect of intrauterine growth restriction on kidney function at young adult age: The Nord Trondelag Health (HUNT 2) Study. Am J Kidney Dis. 2008;51(1):10–20.
- Manalich R, Reyes L, Herrera M, . Relationship between weight at birth and the number and size of renal glomeruli in humans: A histomorphometric study. Kidney Int. 2000; 58(2):770–773.