Abstract
Biological processes are complex, and several methods are often used to measure them. However, different methods could determine diverse parts of a single biological process. To date, there are no widely accepted and convenient methods for comparison between the results, so we consider graphical analysis with the ability to demonstrate the pattern of distribution of findings from one method across another. It appears that a two-series area plot is the most appropriate. After using normal values and a coding reference and examining the variables, unnecessary information is diminished and the graphics become more obvious. Three possibilities may be found: agreement or disagreement between variables or disagreement from normal values. Therefore, the graph may also be used to determine the corresponding normal values between variables. The association between variables may be tested using kappa coefficients, although graphical analysis remains more informative. Therefore, graphical analysis could compare two completely different variables that measure the same biological process or determine the range of normal values.
INTRODUCTION
Biological processes are complex, and several methods are often used to measure them. However, each procedure may determine a different part of a single biological process. The problem of how to compare them arises even when one of the methods could be the reference one. For example, body mass index (BMI) and serum albumin concentration are used to assess the nutritional status of patients, but they measure different things and cannot be compared using the guidelines for method comparison.Citation1 Although sensitivity, specificity, and predictive value can be calculated using one of the methods as reference,Citation2 these comparisons remain insufficient, because the pattern of distribution and distance of individual cases from normal values cannot be taken into account. In order to overcome these limitations, we considered numerous graphical methods, and the most appropriate is suggested for assessing agreement. In our opinion, the best method should (1) use normal values of the measured variables for comparison; (2) use one interval of the measuring variable and preserve distribution across all measured values divided into normal value intervals of the reference one; (3) use simple coding to diminish unnecessary information; and (4) generate a graph from an Excel two-series area plot in order to be more obvious and self-explanatory. (The first series is the reference and the second the tested variable.)
PLOTTING DATA AGREEMENT
Before plotting the graph, it is necessary to prepare the data. For example, we shall compare BMI as the reference variable and serum albumin as the testing variable. Only 19 patients will be involved, so coding of all the data can be presented (). These patients were randomly selected from a larger group.Citation3 We need to know the normal values for both variables. The normal values for BMI are 20–25 and for albumin 35–55 g/L. Then, the data are sorted according to the reference method, that is, BMI (). After that, two new columns are created. The first concerns BMI. Values less than 20 are coded 1, values from 20 to 25 are marked as 2, and values higher than 25 are coded 3. The second column concerns albumin. In the presented example, we shall analyze the distribution of low values of albumin across BMI intervals, so albumin levels less than 35 g/L are marked as 2 and the others as 0. Coded data in are informative per se but plotting the graph gives a more reliable impression. Using spreadsheet software, it is possible to make an area chart with these two series (BMI and albumin, ). The reference method is plotted as the first series. This example shows poor agreement between the reference and testing methods, because low levels of albumin are distributed across normal and high levels of BMI. That is not surprising because albumin concentrations depend not only on nutrition but also on inflammation and many comorbidity states that are frequent in these patients.Citation4 Disagreement becomes more evident if the number of patients is larger (N = 89) ().
Figure 1. Distribution of low albumin concentrations among BMI values (N = 19).Note: A, area of low values; B, area of normal values; C, area of high values of the reference variable; D, areas of low values of the examining variable.
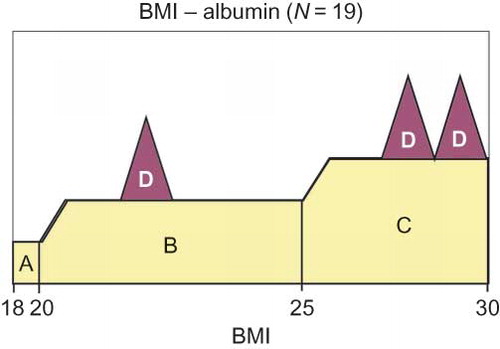
Figure 2. Distribution of low albumin concentrations among BMI values, (N = 89). Note: A, area of low values; B, area of normal values; C, area of high values of the reference variable; D, areas of low values of the examining variable.
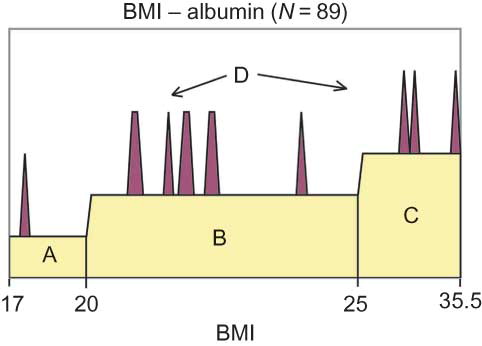
Table 1. Original values of BMI and albumin.
However, two other cases are possible when agreement between two variables is analyzed: disagreement because of differences in normal values and close agreement.
DISAGREEMENT OF NORMAL VALUES
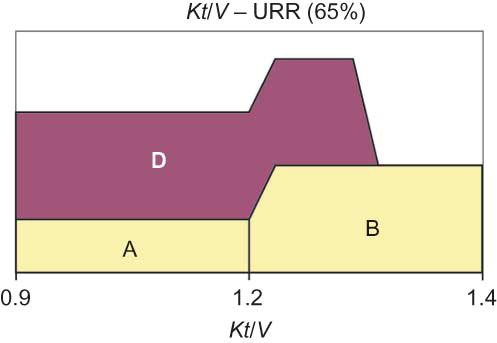
This analysis depends on the normal values of both variables. It is possible that the variables do agree but disagree with the normal values. This example is shown in . The reference variable is index of dose of dialysis—Kt/V (Daugirdas)—and the examining variable is urea reduction ratio (URR).Citation3 URR values less than or equal to 65% were coded as 2 and the others as 0. The results showed that the URR area is compact without breaks. However, low values of URR are plotted not only across low values of Kt/V but also across some normal values of Kt/V, so this disagreement is only the consequence of higher normal values for URR. Both methods, Kt/V and URR, measure dose of dialysis and are based on a urea kinetic model but they have different formulae and normal values, so agreement could not be tested with the Bland–Altman test.Citation5 Normal values for Kt/V (Daugirdas) are >1.2 and normal values of URR are >65%.Citation6 However, if the normal values are changed, agreement would become complete. Therefore, it is possible to use this testing to examine the corresponding normal values of the variables.
Figure 3. Distribution of low URR among Kt/V values.Note: Normal values of URR <65%; A, area of low values; B, area of normal values; C, area of high values of the reference variable; D, areas of low values of the examining variable.
AGREEMENT
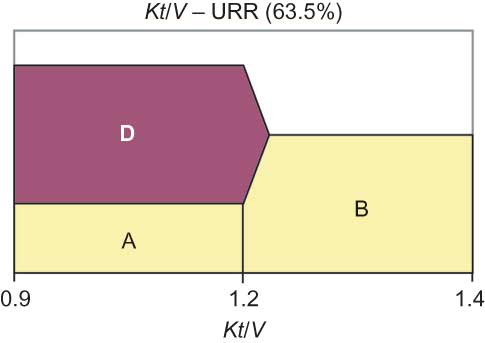
An example of good agreement is shown in . It is the same example as that in . The reference variable is index of dose of dialysis, Kt/V, and the examining variable is URR. When the normal values of URR are set to 63.5%, Kt/V and URR show complete agreement.
Figure 4. Distribution of low URR among Kt/V values.Note: Normal values of URR <63.5%; A, area of low values; B, area of normal values; C, area of high values of the reference variable; D, areas of low values of the examining variable.
TESTING THE MAGNITUDE OF AGREEMENT, SENSITIVITY, AND SPECIFICITY
Graphical analysis reveals sufficient information for the distribution and agreement of two variables but magnitude may also need to be evaluated. If the normal values agree completely, no testing is necessary. However, this is rarely the case and it is possible to test for agreement (association of two categorical variables using Cohen’s and Fleiss’ kappa coefficients as a statistical measure of inter-rater agreement).Citation7,8 It is necessary to change the coding of the testing method—low values should be coded 1, normal values 2, and high values 3, which is the same coding as for the reference method. All cases should be tested. Methods should be considered as raters. In the case of BMI and albumin ( and ), Fleiss’ kappa was negative (κ = −0.17), as well as in the case presented in (κ = −0.13). Both examples revealed poor agreement between the variables. However, kappa does not measure the position of some disagreement with normal values that can be seen on the graph, so some data are lost during this testing. In the case presented in , κ = 0.56 (Cohen’s kappa, moderate agreement), but there was also loss of information during testing due to the specific pattern of graphical distribution. The case presented in reveals perfect agreement (Cohen’s kappa, κ = 1).
When overweight patients (according to percentage of body fat) are omitted ( and ), because albumin was validated as a test for malnutrition, the sensitivity was 0%, the specificity 90%, and the predictive value 75%. More realistic values were obtained for the example in , as sensitivity was 6%, specificity 85%, and predictive value 66%. The example in gives sensitivity 100%, specificity 55%, and predictive value 79%. The example in gives 100% for all three parameters.
DISCUSSION
This graphical analysis could be used for testing for agreement between two variables or methods that measure different things in a biological process. It is also possible to compare normal values of the variables or even to determine normal values of the examining variable. The magnitude of agreement may be calculated using the kappa coefficient.
Two parametric variables can be compared by the Bland–Altman test.Citation1,5 However, which analysis should be done if it is not possible to use this test? A simple scatter plot and correlation analysis?Citation9 Bland and Altman published long ago that correlation and regression analyses are not suitable for method comparison.Citation10 In this article, we suggest using graphical tests and we believe that we have proposed the most appropriate one. In addition, other examples employing this test can be found for anthropometric variables.Citation11,12
Two methods could be compared using other procedures such as testing for sensitivity, specificity, and predictive value.Citation2 However, these graphical tests are more informative. It is possible to study the distribution of the examining variable over all values of the reference variable. In addition, the proposed graphical analysis is more informative than correlation or kappa coefficients, because they do not indicate the distance of a disagreement case from the normal value and do not take into account the pattern of distribution of disagreement cases.
Graphical tests should be used to compare two different variables that measure a certain biological process and their range of normal values.
ACKNOWLEDGMENTS
The work presented was supported by the Serbian Ministry of Education and Science (project III44006). The data presented in this study were obtained from the doctoral dissertation of Dr. Milan Stosovic entitled “Analysis of different dialysis adequacy indices based on clinical parameters upon different dialysis doses in hemodialysis patients” approved by the Scientific Committee, School of Medicine, University of Belgrade, IRB vote number 7/5, 21 April 1992.
Declaration of interest: The authors report no conflicts of interest. The authors alone are responsible for the content and writing of the article.
REFERENCES
- National Committee for Clinical Laboratory Standards. Method comparison and bias estimation using patient samples, approved guideline—second edition. NCCLS publication EP9-A2. NCCLS, 2002.
- Vecchio TJ. Predictive value of a single diagnostic test in unselected populations. N Engl J Med. 1966;274:1171–1173.
- Stosovic M, Stanojevic M, Radovic M, . Comparative survival analysis of urea kinetic based indices. Int J Artif Organs. 2005;28:566–575.
- Friedman AN, Fadem SZ. Reassessment of albumin as a nutritional marker in kidney disease. J Am Soc Nephrol. 2010;21:223–230.
- Bland JM, Altman DG. Statistical methods for assessing agreement between two methods of clinical measurement. Lancet. 1986;8:307–310.
- National Kidney Foundation NKF K/DOQI Guidelines. Guidelines for hemodialysis adequacy. Hemodialysis dose [serial online]. 2000. Available at: http://www.kidney.org/professionals/kdoqi/guidelines_updates/doqiuphd_ii.html#4. Accessed April 9, 2012.
- Fleiss JL. Statistical Methods for Rates and Proportions. 2nd ed. New York: John Wiley; 1981:38–46.
- Fleiss JL. Measuring nominal scale agreement among many raters. Psychol Bull. 1971;76:378–382.
- Westgard JO, Hunt MR. Use and interpretation of common statistical tests in method comparison studies. Clin Chem. 1973;19:49–57.
- Altman DG, Bland JM. Measurement in medicine: The analysis of method comparison studies. Statistician. 1983; 32:307–317.
- Stosovic M, Stanojevic M, Simic-Ogrizovic S, Jovanovic D, Djukanovic L. The predictive value of anthropometric parameters on mortality in hemodialysis patients. Nephrol Dial Transplant. 2011;26:1367–1374.
- Stosovic M, Naumovic R, Stanojevic M, Simic-Ogrizovic S, Jovanovic D, Djukanovic L. Could the level of serum albumin be a method for assessing malnutrition in hemodialysis patients? Nutr Clin Pract. 2011;26:607–613.