Abstract
Background: There is limited data available especially in Indian Population about prevalence of reduced bone mineral density (BMD) and various factors associated with it in CKD patients not on dialysis. Material: This study included 75 adult patients. Patients were divided into three groups depending upon GFR. Serum creatinine, albumin, calcium, phosphate (PO4), alkaline phosphatase, iPTH and Vitamin D were measured at baseline. BMD was measured by dual energy X-ray absorptiometry. Results: There were 51 male and 24 female patients. The mean serum phosphate, alkaline phosphatase and iPTH levels increased steadily as CKD progressed. On the other hand, mean corrected serum calcium and Vitamin D levels decreased progressively in group A, B and C. The mean serum PTH values in group A, B and C were 137.16 ± 109.85, 265.02 ± 132.03 and 328.14 ± 119.23 pg/mL, respectively and there was significant increase in mean PTH level from group A to group C (p < 0.05). The mean level of vitamin D showed a trend of declination from group A to C (p < 0.05). Z-score for group A, group B and group C was 1.11 ± 2.39, 0.87 ± 2.66 and −0.92 ± 1.59, respectively. Similarly, T score for the three groups were 0.47 ± 2.34, −0.4 ± 2.00 and −1.524 ± 1.42. Both T-score and Z-score positively correlated with GFR. There was negative correlation between Z-score and iPTH, and positive correlation with Vitamin D. Conclusion: Reduced bone density was seen early in the course of CKD as estimated from reduced BMD levels, increased prevalence of osteoporosis and increased fracture risk and it worsened with the progression of CKD.
Introduction
Bone disease associated with chronic kidney disease (CKD) is a complex and multifactorial clinical entity. It is associated with considerable morbidity and mortality mostly through inducing musculoskeletal pain, limiting physical capacity, and most importantly increasing the frequency of bone fractures. Osteoporosis is a condition characterized by low bone mass leading to reduced bone strength and increased risk of fractures. In CKD patients, it is part of a wider spectrum of metabolic bone problems. Numerous epidemiological studies done in general population have attributed several risk factors for osteoporosis including advancing age, female gender, white race, decreased calcium intake, gastric acid suppression therapy, sedentary lifestyle, premature loss of gonadal function, decreased oestrogen secretion, thin body habitus, decreased physical activity, cigarette smoking, alcohol abuse, excess glucocorticoid exposure and possibly some genetic factors.Citation1 Along with the determinants of the various aspects of renal osteodystrophy (ROD) such as secondary hyperparathyroidism, osteomalacia or adynamic bone disease, osteoporosis is not an uncommon bone disorder in CKD patients.Citation2,Citation3 Therefore, its diagnosis, management and follow-up may differ from the general population and an individualization of diagnosis and dentition for CKD population may be necessary.
Osteoporosis and ROD may coexist in patients with CKD, which makes the issue problematic to define. With the rising prevalence of CKD, a better understanding of these two processes and their interplay deserves more attention. Bone biopsy is considered the gold standard for diagnosing (ROD), but rarely used, because it is expensive and an invasive procedure that needs special equipment and the samples obtained require specialized processing that is not widely available. Consequently, in recent years, several biochemical markers of bone metabolism have been used and tested in the evaluation of bone remodelling in uremic patients.Citation3 Circulating PTH levels have been used as a surrogate indicator of bone turnover, which are used together with measurements of serum calcium, phosphorus, and alkaline phosphatase levels to evaluate, diagnose, and guide the treatment of ROD. Many other circulating biochemical markers of bone formation and resorption have been investigated as clinical indicators of bone turnover, but their clinical applicability remains to be established.Citation4 In addition to bone histology and serum biomarkers, imaging has been an important component of evaluating bone disease and assessment of extra skeletal calcification in CKD patients.Citation5 Dual energy X-ray absorptiometry (DEXA), quantitative computed tomography and heel ultrasound are the widely used techniques. Due to its lower cost, accuracy, short scan time, non-invasive nature and low radiation dose, DEXA is the most commonly used method for BMD measurements. BMD can be easily measured using this method which is quick, non-invasive, accurate and associated with minimal exposure to radiation. Ongoing developments in non-invasive imaging techniques almost certainly will lead to their improved and more widespread use in clinical diagnosis and decision-making in the near future.Citation6
Although our knowledge regarding the risk factors and outcomes associated with ROD has evolved, less is known about osteoporosis in predialysis patients. Since various parameters like calcium, phosphate, serum alkaline phosphatase and hormone like PTH, vitamin D clearly plays an integral part in determining bone health, it would be important to understand how these parameters are related to bone mass in patients with CKD. The modern era has seen important advances in the understanding and management of osteoporosis, but in patients with CKD it remains a complex issue that has yet to be clearly defined, hence the present study was undertaken.
Material and methods
This study was conducted on seventy five adult pre-dialysis of CKD stage III-V as per NKF-DOQI classification, on regular follow-up of kidney and dialysis clinic at Pt. B.D. Sharma PGIMS, Rohtak with age between 18 and 75 years. A pre-informed written consent for enrolment in the study was obtained. The study was duly approved by the ethical committee of Pt. B. D. Sharma University of Health Sciences Rohtak. Patient receiving medication known to influence bone and mineral metabolism such as corticosteroids, other immune suppressive agents, hormone replacement therapy, anticoagulants, lithium and anticonvulsants were excluded. Patients having clinical or biochemical evidence of other bone diseases such as osteomalacia, aluminium related bone disease and Paget’s disease, and so on and patients with prior parathyroidectomy were also excluded. Each patient was subjected to detailed general physical examination and the following relevant renal and other biochemical investigations were carried out.
Routine renal and other biochemical investigations including; blood urea (mg/dL), serum creatinine (mg/dL), serum corrected calcium levels (mg/dL), serum phosphorous levels (mg/dL), calcium phosphate product, serum protein (g/dL), iPTH levels (pg/mL), vitamin B12 levels(pg/mL), serum sodium (meq/L), serum potassium (meq/L), blood sugar were carried out as per the standard methods used in Dept. of Biochemistry, PGIMS, Rohtak. GFR was measured by collecting 24 h urine of the patient. The patients were divided into three groups A, B and C on the basis of severity of kidney disease using creatinine clearance. Each group consists of age and sex matched patients from CKD stage III, IV, and V respectively. Group A patients had GFR values from 30 to 59 mL/mt, Group B 15 to 29 mL/mt and Group C less than 15 mL/mt. PTH was measured by chemiluminescent immune assay (CLIA) method. Vitamin D level was measured by enzyme linked immunosorbent assay (ELISA) method.
BMD was measured by dual energy X-ray absorptiometry (DEXA, Hologic Explorer QDR series 90797) at the lumbar spine L1-L4 vertebrae. BMD results obtained in T score and in Z score. Z score is the number of standard deviations from the mean of a healthy age and gender matched normal population, which allows the comparison of BMD between patients of different age and gender. T score is the number of standard deviations from the mean of a healthy young adult population (20–40 years old); it is used for the definition of osteopenia (between −1.0 and −2.5 T score) and osteoporosis (less than −2.5 T score).
Statistical analysis
At the end of the study, the data was expressed as mean ± 1SD or range. Probability values of <0.05 were considered to be significant in all the analysis. The Statistical analyses were performed using Kruskal–Willis one way analysis of variance (ANOVA). The correlations were tested using Spearman’s Rank order correlation analysis. All statistical calculations were carried out using SPSS 20.0 software.
Results
Of total 75 patients, 51 were male and 24 were female, thus males comprising almost two third of the study group. Most common cause of CKD was diabetes mellitus followed by chronic glomerulonephritis, hypertension. Less frequent etiology included adult polycystic kidney disease, obstructive uropathy and renal amyloidosis. The mean body mass index of the three groups was 23.1, 22.9 and 22.0 and had no statistical difference (). As expected, the mean serum phosphate, serum alkaline phosphatase and iPTH levels increased steadily as CKD progressed with statistical difference among three groups. On the other hand, mean corrected serum calcium and Vitamin D levels decreased progressively in group A, B and C. The mean serum PTH values in group A, B and C were 137.16 ± 109.85, 265.02 ± 132.03 and 328.14 ± 119.23 pg/mL, respectively and there was statistically significant increase in mean PTH level from group A to group C (p < 0.05). The mean vitamin D level of group A was 38.14 ± 15.73, 31.16 ± 17.91 in group B and 21.92 ± 13.00 in group C. The mean level of vitamin D showed a trend of declination from group A to C (p < 0.05).
Table 1. Characteristics of three groups stratified into three groups on the basis of eGFR.
Bone densitometric analysis revealed progressive decline in the bone mineral density (BMD) with deterioration of renal function. Both T-score as well as Z-score decreased steadily as stage of CKD progressed. Z-score for group A, group B and group C was 1.11 ± 2.39, 0.87 ± 2.66 and −0.92 ± 1.59, respectively. Similarly, T score for the three groups were 0.47 ± 2.34, −0.4 ± 2.00 and −1.524 ± 1.42 (). There was statistically significant difference in the T-score and Z-score of group A, B and C.
Figure 1. Bone mineral density in patients divided into three groups based on the GFR. [(a) T-score in Group A, B and C: (b) Z score in Group A, B and C].
![Figure 1. Bone mineral density in patients divided into three groups based on the GFR. [(a) T-score in Group A, B and C: (b) Z score in Group A, B and C].](/cms/asset/1d1b94dd-8485-4927-8f2d-4f85c4ce0b86/irnf_a_815102_f0001_b.jpg)
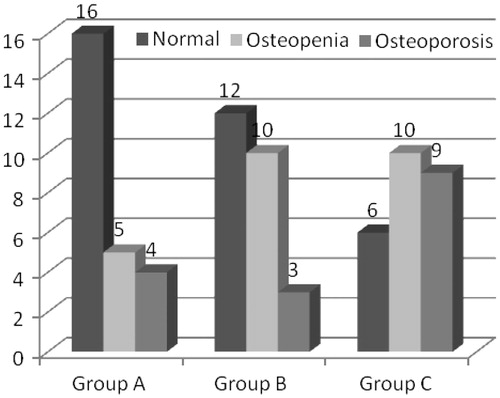
The prevalence of both osteopenia as well as osteoporosis increased with advancement of renal disease. Group A (stage III) had 16 patients with normal bone density as defined by WHO and 9 patients with reduced bone density (5 patients had osteopenia and 4 had osteoporosis). Group B (stage IV CKD) comprised of 12 patients with normal bone density, 10 patients with osteopenia and 3 with osteoporosis. Stage V predialysis patients (Group C) had 9 patients with osteoporosis and 10 with osteopenia. This group had only six patients with normal bone density (). When the three groups were compared, the results were found to be statistically significant (p < 0.05).
Figure 2. Prevalence of reduced bone density in various stage of CKD.
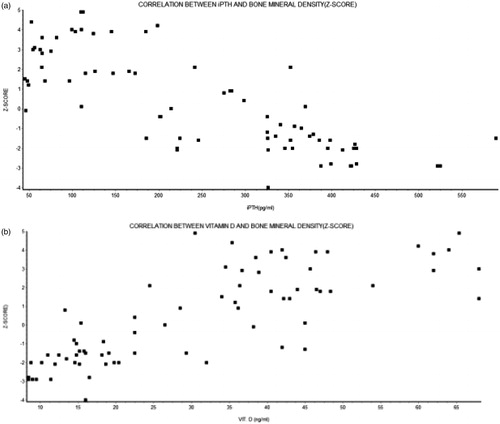
On correlation analysis, there was statistically significant association between GFR and Corrected serum calcium, Vitamin D, iPTH, serum phosphate level. The corrected serum calcium and vitamin D were positively correlated with the GFR while iPTH and phosphate were negatively correlated (). Both T-score and Z-score were positively correlated with GFR. On further analysis when the association between BMD (Z-score) and Vitamin D was studied, statistically significant positive correlation was observed. There was negative correlation between Z-score and iPTH ().
Figure 3. Scatter diagram demonstrating correlation between (a); GFR and T-score. (b); GFR and Z-score.
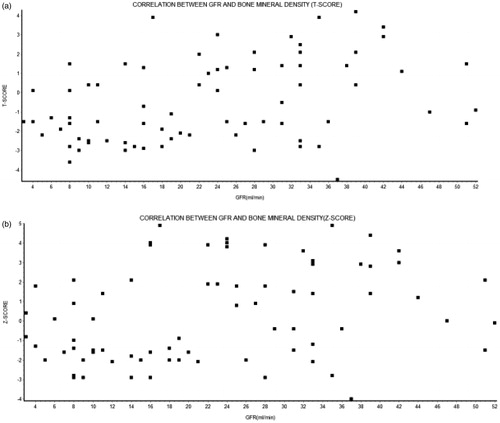
Figure 4. Scatter diagram demonstrating correlation between (a) Z-score and iPTH; (b) Z-score and Vitamin D.
Discussion
CKD-mineral and bone disorder (CKD-MBD) is considered to be a systemic disorder that is associated with fracture, cardiovascular disease, and mortality. It is associated with derangements in bone and mineral metabolism that leads to abnormal regulation of calcium, phosphorous, vitamin D, and parathyroid hormone (PTH). Because the early initiation of appropriate therapy may prevent or ameliorate the mineral and bone disorder that develops in late CKD, the ability to define the pathophysiologic process underlying abnormality is important. BMD is an important component of bone strength. A low BMD therefore is a good predictor of future fracture risk, particularly when coupled with age, prior fracture, and other risk factors emphasizing the importance of this investigation. The risk of fracture increases 1.5–3 times for each standard deviation decrease in the BMD.Citation7
Osteoporosis is a complex multi-factorial disease that remains asymptomatic until a fracture occurs, and strategies need to be developed to accurately identify “high risk” subjects who may benefit from preventive treatments before fractures occur. In osteoporosis, once a fracture occurs, the risk of a subsequent fracture is high. Therefore, the diagnosis of osteoporosis should be made before the first fracture occurs, so that the patient can undertake lifestyle changes and undergo treatment to prevent fractures. The only way to do this is to measure BMD.
Keeping in view these facts this study was planned to evaluate the BMD in 75 predialysis patients, 25 each from CKD stage III, IV and V, respectively. The three groups were similar in baseline characteristics including age, sex, ethnicity, geographical area, religion, economic status and education level. The present study demonstrated that BMD, as assessed by Z-score and T-score decreased significantly as the CKD progressed from stage III to stage V. There was a statistically significant difference between the three groups (p < 0.0046). The Z-score also showed similar pattern. These findings indicate that alteration in BMD although begin early in CKD, it is related to the severity of kidney function and majority of patient with advanced CKD have reduced bone density and subsequent increased risk of fractures. CKD encompasses several metabolic and hormonal abnormalities, including decreased renal synthesis of 1,25(OH)D, hyperphosphatemia, hypocalcemia, increased secretion of PTH, chronic metabolic acidosis, premature hypogonadism, and, more recently, recognized 25(OH) vitamin D deficiency; all may adversely affect the bone remodelling process in one or more of the following ways—increasing bone resorption, decreasing bone formation, or impairing mineralization of osteoid. These changes in bone remodelling have the potential to accelerate the deterioration of bone microstructure that accompanies normal aging—trabecular thinning and perforation, dropout of trabeculae, cortical thinning, and porosity—and therefore may prematurely decrease bone quality and strength and increase susceptibility to fragility fracture.Citation8,Citation9
Most of the studies done previously are in concordance with a reduced BMD in CKD patients. Labao et al. did a study to determine the prevalence and histological features of low BMD in 103 pre-dialysis CKD patients. Almost 50% patients had low BMD. In patients with low BMD bone histomorphometry revealed adynamic bone disease (52.5%) and osteomalacia (42.5%).Citation10 In another study Buchannan et al. suggested that occult renal insufficiency may contribute to bone loss in aging women, and that this effect may be mediated in part by 1,25(OH)D and PTH giving some insight about the underlying pathological mechanism.Citation11
We observed that both T-score as well as Z-score decreased with the progression of CKD. As severity of CKD increased, the total number of patients with reduced bone density (osteopenia and osteoporosis) increased from 9 in stage III to 19 in stage V. The prevalence of osteoporosis increased from 16% in Group A to 12% in Group B and 36% in Group C. The prevalence of patients with normal BMD decreased from 64% in Stage III CKD to 24% in Stage V. These findings have important therapeutic implications in terms of defining population at increased risk of fracture and preventive strategies can be instituted. The findings of our study corroborated with the previous studies. Bianchi et al. evaluated BMD in 69 patients with CKD and in healthy controls matched for age and sex. Patients were divided into three groups on the basis of creatinine clearance: group 1, 58 to 36 mL/min; group 2, 30 to 18 mL/min; group 3, 15 to 9 mL/min. BMD was found to be decreasing with the worsening of renal failure.Citation12 Another study done in 113 predialysis patients the prevalence of overt osteoporosis (T-score < −2.5) was found to be increased when compared with healthy sex, age, and weight-matched controls. The study included patients ranging from mild to severe degrees of renal failure, and the decrease in BMD was most pronounced in patients with the lowest levels of GFR. Debut of the renal disease before skeletal maturity was reached and diabetic nephropathy further increased the risk of low BMD. In multivariate analysis, GFR and BMI were the strongest predictors of BMD.Citation13
In early stages of renal dysfunction, renal function should be assessed by measuring creatinine clearance (eGFR) rather than the serum creatinine concentration since renal insufficiency can be masked by apparently normal circulating creatinine levels. We did a correlation analysis to assess the relationship between GFR and T-score and Z-score. The association between loss of renal function measured by GFR and BMD as measured by T-score was assessed by Spearman's Rank Order correlation test. There was a strong positive correlation which was statistically significant (p < 0.001). Similarly, a positive correlation was observed between GFR and Z-score (p < 0.005).
In order to determine the factors contributing to the reduced BMD, we did a correlation analysis. The BMD (Z-score) was negatively correlated with iPTH which was statistically significant (p < 0.0001). As elevated PTH levels are catabolic for cortical bone, these biochemical alterations could cause deterioration in cortical architecture, leading to reduced cortical density and increased cortical porosity much earlier in the course of CKD than previously thought.Citation14 As cortical bone contributes substantially to bone mechanical competence, these architectural changes could account for the increased fracture susceptibility noted in studies of patients with CKD.Citation15,Citation16 Several other investigators have also found a similar negative correlation between PTH levels using a variety of measurement of BMD.Citation17–19 Labao et al. did a histomorphometric analysis and observed a significant association between Adynamic bone disease and iPTH level less than 150 pg/mL (p < 0.05), whereas higher values of iPTH were associated with Osteomalacia.Citation10 The increased serum PTH causes an increase of bone turnover, which is usually associated with bone loss. Secondary hyperparathyroidism has been proposed as the principal mechanism whereby vitamin D deficiency could contribute to the pathogenesis of hip fractures in CKD population. The cortical porosity is increased in hyperparathyroidism, so it is not surprising that serum parathyroid level is an important predictor of BMD.
Vitamin D was positively associated with Z-score. There was a strong, positive correlation which was statistically significant (p < 0.0001) emphasizing the need for achieving adequate Vitamin D levels to maintain bone density and hence in prevention of fracture. Vitamin D insufficiency and deficiency are a well-known cause of secondary hyperparathyroidism and increased bone turnover in the general population and can aggravate the hyperparathyroidism found in CKD patients. Mucsi et al. assessed the association between vitamin D status and parathyroid function, bone turnover, bone mass and structure in 69 patients on maintenance hemodialysis. A high prevalence of potentially significant vitamin D3 deficiency was found in this patient group: 59% of the patients had a 25(OH)D3 level below 20 nmol/L.Citation20 In concordance to our results, there was a statistically significant negative correlation between serum 25(OH) D3 levels and serum intact parathyroid hormone (iPTH) (p < 0.05), and this association remained significant after controlling for potential co variables. Furthermore, they concluded that that serum 25(OH)D3 concentration is positively correlated with BMD (p < 0.01). In another study, it was observed that 1,25-(OH)2D values correlated positively with GFR and negatively with the log of plasma PTH and serum phosphorus concentrations. Log of plasma PTH correlated negatively with CCr and positively with FEP. The ionized calcium concentration correlated very weakly with CCr and the log of the plasma PTH level.Citation21
Some authors are however of the view that the decreased bone density in CKD patients may be due to confounding factors related to this cohort. To ascertain whether BMD is associated with fractures in participants with and without CKD in the Health, Aging, and Body Composition study, Robert et al. studied well functioning older individuals. CKD was defined as GFR <70 mL/min. They confirmed that BMD provides information on risk for fracture in older individuals regardless of renal dysfunction. They did not found patients with CKD at an additional risk. The inclusion of patients with early renal dysfunction (stage II) GFR < 70 mL/min may have resulted this because most of the metabolic abnormalities arise in the later stages of CKD.Citation22 In another study, Stehman-Breen et al. observed that factors that predict bone loss in the CKD-V population are similar to those in the general population and include female gender, Caucasian race, older age, chronic disease, and immobility.Citation23 Age and weight, more precisely the BMI (body mass index) is a well known predictor of BMD as evident in the previous studies,Citation17,Citation24 although some authors are of different opinion.Citation17,Citation18 However, in the present study these confounding factors were not present as the three groups had similar age profile and BMI. The mean age of the patients in group A, B and C were 50.24, 49.8 and 55.08 years, respectively. The mean BMI in group A, B, and C were 23.12, 22.9 and 22.04, respectively. Although BMI decreased with progression of CKD it was not statistically significant (>0.05). In another study, Hsu et al. analyzed data from a group of patients from the Third National health and Nutritional Examination (NHANES) III survey, and found that although subjects with worse renal function had reduced BMD, this was probably confounded by a list of known predictors of BMD principally age, sex and weight. However, in our study none of these confounders was significant. Hsu et al. concluded that the abnormalities in Vitamin D–PTH homeostasis and acid–base disturbances could be detrimental to the bone mass in patients with moderate to severe renal dysfunction while ESRD patients, that is CKD stage V develops osteoporosis because of prolonged immobilization and gonadal dysfunction.Citation25
In conclusion, a state of reduced bone density is seen early in the course of CKD (GFR < 60 mL/min) as estimated from reduced BMD levels, increased prevalence of osteoporosis and increased fracture risk and it worsens with the progression of CKD. Metabolic abnormalities in form of hypocalcemia, hyperphosphatemia, elevated serum PTH, reduced 1, 25-dihydroxyvitamin D levels commence well before the overt osteoporosis. In developing country like India where monetary constraints is common, useful information on the bone status can be obtained by using simple, inexpensive, outpatient based non invasive methods, such as BMD measurements and biochemical parameters of bone metabolism in patients with predialysis patients of CKD giving a vital opportunity to act and intervene so that complications like fracture can be reduced.
Declaration of interest
The authors report no conflicts of interest. The authors alone are responsible for the content and writing of this article.
References
- Hegarty J, Mughal MZ, Adams J, Webb N. Reduced bone mineral density in adults treated with high-dose corticosteroids for childhood nephrotic syndrome. Kidney Int. 2005;68:2304–2309
- Moe S, Druëke T, Cunningham J, et al. Definition, evaluation, and classification of renal osteodystrophy: a position statement from kidney disease: improving global outcomes (KDIGO). Kidney Int. 2006;69:1945–1953
- Martin KJ, Olgaard K, Coburn JW, et al. Bone Turnover Work Group. Diagnosis, assessment, and treatment of bone turnover abnormalities in renal osteodystrophy. Am J Kidney Dis. 2004;43:558–565
- Ferreira A, Drueke TB. Biological markers in the diagnosis of the different forms of renal osteodystrophy. Am J Med Sci. 2000;320:85–89
- London GM, Guerin AP, Marchais SJ, et al. Arterial media calcification in end-stage renal disease: impact on all-cause and cardiovascular mortality. Nephrol Dial Transplant. 2003;18:1731–1740
- Bellasi A, Raggi P. Diagnostic and prognostic value of coronary artery calcium screening. Curr Opin Cardiol. 2005;20:375–380
- Kanis JA, Melton JL, Christiansen C, Johnston CC, Khaltaev N. The diagnosis of osteoporosis. J Bone Miner Res. 1994;9:1137–1141
- Amling M, Grote HJ, Vogel M, et al. Three-dimensional analysis of the spine in autopsy cases with renal osteodystrophy. Kidney Int. 1994;46:733–743
- Schober HC, Han ZH, Foldes AJ, et al. Mineralized bone loss at different sites in dialysis patients: implications for prevention. J Am Soc Nephrol. 1998;9:1225–1233
- Lobao R, Carvalho AB, Cuppari L, et al. High prevalence of low bone mineral density in pre-dialysis chronic kidney disease patients: bone histomorphometric analysis. Clin Nephrol. 2004;62:432–439
- Buchanan JR, Myers CA, Greer RB. Effect of declining renal function on bone density in aging women. Calcif Tissue Int. 1988;43:1–6
- Bianchi ML, Colantonio G, Montesano A. Bone mass status in different degrees of chronic renal failure. Bone. 1992;13:225–228
- Rix M, Andreassen H, Eskildsen P, Langdahl B, Olgaard K. Bone mineral density and biochemical markers of bone turnover in patients with predialysis chronic renal failure. Kid Int. 1999;56:1084–1093
- Parfitt AM. A structural approach to renal bone disease. J Bone Miner Res. 1998;13:1213–1220
- Seeman E. Pathogenesis of bone fragility in women and men. Lancet. 2002;359:1841–1850
- Seeman E, Delmas PD. Bone quality—the material and structural basis of bone strength and fragility. N Engl J Med. 2006;354:2250–2261
- Asaka M, Iida H, Entani C, et al. Total and regional bone mineral density by dual photon absorptiometry in patients on maintenance hemodialysis. Clin Nephrol. 1992;38:149–153
- Foldes AJ, Arnon E, Popovtzer MM. Reduced speed of sound in tibial bone of hemodialysed patients: association with serum PTH level. Nephrol Dial Transplant. 1996;11:1318–1321
- Wittich A, Vega E, Casco C. Ultrasound measurement of the tibia in chronic hemodialysis patients. J Bone Miner Res. 1996;11:247–216
- Musci I, Almasi C, Deak G, Marton A. Serum 25(OH)-vitamin D levels and bone metabolism in patients on maintenance hemodialysis. Clin Nephrol. 2005;64:288–294
- Pitts TO, Piraino BH, Mitro R, et al. Hyperparathyroidism and 1,25-dihydroxyvitamin D deficiency in mild, moderate, and severerenal failure; prediction of creatinine clearance. J Clin Endocrinol Metab. 1998;67:876–881
- Yenchek RH, Ix JH, Shlipak MG, et al. Bone mineral density and fracture risk in older individuals with CKD. Clin J Am Soc Nephrol. 2012;7:1130–1136
- Stehman-Breen C, Sherrard D, Walker A, Sadler R, Alem A. Lendberg J. Racial differences in bone mineral density and bone loss among end-stage renal disease patients. Am J Kidney Dis. 1999;33:941–946
- Lindergard B, Johnell O, Nilsson BE, Winklund PE. Studies of bone morphology, bone densitometry and laboratory data in patients on maintenance hemodialysis treatment. Nephron. 1985;39:122–129
- Hsu CY, Cummings SR, McCulloch CE, Chertow GM. Bone mineral density is not diminished by mild to moderate chronic renal insufficiency. Kidney Int. 2002;61:1814–1820