Abstract
High body iron levels are found in type 2 diabetes mellitus (DM). Iron excess leads to tissue injury through free radical formation. We investigated the effect of iron restriction on renal damage in Otsuka Long-Evans Tokushima Fatty (OLETF) rats, a model of type 2 DM. OLETF rats (n = 18) were divided into three groups at 10 weeks of age: high fat diet containing 8% NaCl (HFS, n = 6), HFS diet with iron restricted (HFS + IR, n = 6), and HFS with hydralazine (HFS + Hyd, n = 6). Long-Evans Tokushima (LETO) rats served as control. Iron restriction decreased hemoglobin levels, systolic blood pressure, and urinary excretion of protein and 8-hydroxy-2'-deoxyguanosine in the OLETF rats fed with HFS diet. Compared to the HFS group, the expression of desmin, renal glomerular injury marker and iron deposition in the renal tubules were attenuated in the HFS + IR group but not in the HFS + Hyd group at 26 weeks of age. Moreover, renal hypoxia (evaluated as pimonidazole adducts) was improved in the HFS + IR group compared to the HFS group in spite of anemia. Iron restriction prevented the production of reactive oxygen species and the development of early stage nephropathy in OLETF rats. Iron restriction may be beneficial in prevention of nephropathy in type 2 DM.
Introduction
Iron is an essential element for life and playing an important role in many metabolic pathways. However, iron accelerates production of reactive oxygen species (ROS), and excess iron causes the injury to tissues because of hydroxyl radical formation, which results in glutathione consumption, lipid peroxidation and nucleic acid modification.Citation1 It has been reported that increased serum ferritin concentration, a marker of body iron stores, is associated with development of type 2 diabetes mellitus (DM).Citation2–4 The iron depletion improved diabetic metabolic control not only in patients with hemochromatosisCitation5 but also in type 2 DM patients with relatively high-ferritin levels.Citation6 The experimental study using obese (ob/ob lep−/−) mice model of type 2 DM showed that iron restriction improved their glucose tolerance.Citation7
Diabetic nephropathy is considered as one of the most significant long-term complications in terms of prognosis for patients with DM. Iron accumulation was observed in several models of renal diseaseCitation8,Citation9 and associated with the progression of renal disease.Citation10 Iron content in the kidney has been shown to be increased in streptozotocin diabetic rats.Citation11 In patients with DM, iron and carbohydrate restricted diet and polyphenol enriched diet showed renoprotective effect.Citation12 However, how iron associates with early stage of diabetic nephropathy has been unclear.
The Otsuka Long-Evans Tokushima Fatty (OLETF) rat is a model of type 2 DM characterized by a low grade and chronic course of diabetes, hyperlipidemia, obesity, and renal disease.Citation13 The renal pathological changes in the OLETF rat resemble those of human diabetic nephropathy. Here we investigated the effect of iron restriction on early stage of diabetic nephropathy using OLETF rats.
Materials and methods
Animals and experimental protocol
Four-week-old male OLETF rats (n = 18) and their normoglycemic control Long-Evans Tokushima (LETO) rats (n = 3) were supplied by Otsuka Pharmaceutical, Tokushima, Japan. All rats were housed at constant humidity (60 ± 5%), temperature (25 ± 1 °C). They were fed standard rat chow (CE-2: 0.005% FeC6H5O7 · H2O is contained, Clea Japan Inc., Tokyo, Japan) and given tap water ad libitum. OLETF were divided into three groups at ten weeks of age: high fat diet containing 8% NaCl for faster development of nephropathy (HFS, n = 6), iron restricted HFS diet (0.005% FeC6H5O7 · H2O is not contained) (HFS + IR, n = 6), and HFS diet and hydralazine 3 mg/kg/day in the drinking water (HFS + Hyd, n = 6) for 16 weeks. The analysis of urine and systolic blood pressure (SBP) were examined at 6, 10, 14, 18 and 26 weeks of age. Rats were sacrificed under sodium pentobarbital (50 mg/kg) anesthesia at 26 weeks of age. Blood sample was collected from abdominal aorta and both kidneys were removed for RNA, protein extraction and histomorphological analysis. All of our experimental procedures were approved by the Animal Research Committee of Hyogo College of Medicine.
Analysis of blood, urine samples, and SBP
Peripheral blood was measured using hematological analyzer (Pentra 60 LC-5000, Horiba, Kyoto, Japan). The serum was separated by centrifugation at 3000 rpm for 10 minutes at 4 °C. We measured serum iron by the nitroso-PSAP method (Shino Test Co., Tokyo, Japan) and erythropoietin (EPO) by using a commercially available kit (Mitsubishi Chemical Medience Co., Tokyo, Japan) by radioimmunoassay. Fasting blood glucose and insulin levels were measured with a blood glucose monitor (Medisafe, TERUMO, Tokyo, Japan) and an enzyme linked immunosorbent assays kit (Shibayagi Co. Ltd., Gunma, Japan), respectively. 24 hour urine was collected in metabolic cages for measuring urinary protein, creatinine, and 8-hydroxy-2′-deoxyguanosine (8-OHdG) levels. Urinary excretions of protein and creatinine were determined by an automated analyzer. 8-OHdG is formed when DNA is oxidatively modified by ROS and one of the markers for oxidative stress. Urinary 8-OHdG level was assessed by enzyme-linked immune sorbent assay (Nikken SEIL Co., Shizuoka, Japan). SBP of conscious rats was measured by the tail-cuff method using a blood pressure monitor (Model MK-2000, Muromachi Kikai Co., Tokyo, Japan).
RNA extraction and quantitative RT-PCR analysis of angiotensinogen
Total RNA from the tissue was extracted using TRIzol solution (Invitrogen, Carlsbad, CA) and then reverse-transcribed (RT) into cDNA. RT reactions were performed using cDNA Reverse Transcription Kits (Applied Biosystems, Foster City, CA). The synthesized cDNA served as the template for real-time PCR. Quantitative real-time PCR was performed with an ABI PRISM 7900 according to manufacturer’s recommendations (Applied Biosystems, Foster City, CA) by using TaqMan Universal PCR Master Mix and TaqMan Gene Expression Assays (Applied Biosystems, Foster City, CA) consisted of a PCR primers and a probe: angiotensinogen (Rn01426719_m1) and Glyceraldehyde-3-phosphatedehydrogenase (GAPDH) (Rn99999916_sl). GAPDH was used as endogenous control.
Detection of renal hypoxia
Renal hypoxia was detected by using pimonidazole hydrochloride (PIM) (HypoxyprobeTM-1, Hypoxyprobe Inc., Burlington, MA) which binds to tissues with pO2 levels below 10 mmHg. PIM (60 mg/kg) was injected intraperitoneally 1 hour before both kidneys were perfusion fixed. Distribution of protein-bound PIM was evaluated by immunohistochemistry.Citation14,Citation15
We also performed western blot for the quantification of renal hypoxia using PIM. The kidney tissues were homogenized and lysed with cell lysis buffer (Cell Signaling Technology, Inc., Danvers, MA), phenylmethyl sulfonyl fluoride and centrifuged (15,000 rpm) for 15 minutes at 4 °C. The supernatant total protein (50 µg) was separated by SDS-PAGE and transferred onto polyvinylidene fluoride membrane. The membrane was incubated with rabbit anti pimonidazole (Hypoxyprobe Inc., Burlington, MA 1:1000) and mouse anti β actin (Abcam, Cambridge, United Kingdom, 1:1000). The expression levels of proteins were visualized by an enhanced chemiluminescence kit (Thermo Scientific, Waltham, MA). The target bands intensities were normalized by that of β actin from the same sample.
Histology and immunohistochemistry
The kidneys were fixed with buffered 4% paraformaldehyde and were embedded in paraffin and cut into 4-μm-thick sections. Histological staining was performed using Prussian blue staining to detect iron deposits. For the immunodetection of desmin and PIM, the sections were deparaffinized and incubated at room temperature (RT) with 3% H2O2 and 80% methanol +0.6% H2O2 for 10 minutes, respectively. The sections were incubated with primary antibody for detecting desmin (mouse monoclonal antibody anti desmin 1:50, DAKO M0814, Tokyo, Japan) at RT for 1 hour, for PIM (rabbit anti pimonidazole 1:1000, Hypoxyprobe Inc., Burlington, MA) at 4 °C overnight. For antigen retrieval of desmin, the sections were treated with 95 °C water bath for 40 minutes. Immunoreactivity was detected using Dako Liquid DAB+ Substrate chromogen system (DAKO K3468, Tokyo, Japan).
Measurement of iron deposits areas per fields was done using 10 randomly selected cortical fields from each rat in a blinded fashion with the Image J software. For semiquantitative immunohistochemical analysis of desmin was analyzed all glomeruli (at least 50 glomeruli) in one slice of each kidney in a blinded fashion. The degree of glomerular desmin staining was expressed as a percentage of desmin-positive glomeruli.
Data and statistical analysis
Values are expressed as means ± SD. All statistical analyses were performed using commercially available statistical software (STATVIEW version 5.0, SAS Institute Inc., Cary NC). The data were analyzed using one-way analysis of variance and Dunnett test was used for statistical comparison. We took p-value <0.05 statistically significant.
Results
Changes in body weight and SBP
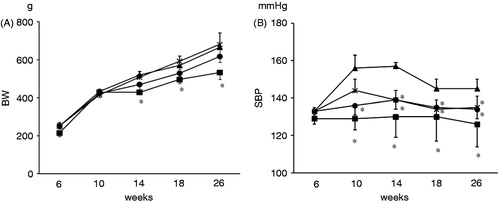
There was no difference in body weight (BW) among HFS, HFS + IR, and HFS + Hyd. groups (). Iron restriction did not affect the BW in HFS + IR group. SBP increased in the HFS group from 10 weeks of age. Iron restriction and hydralazine reduced SBP in OLETF rats and there was not different between the HFS + IR and the HFS + Hyd groups at 26 weeks of age ().
Figure 1. Body weight (BW) (A) and systolic blood pressure (SBP) (B) of OLETF HFS, HFS + Hyd, HFS + IR groups and LETO group at 6, 10, 14, 18, 26 weeks of age. OLETF HFS (▴), HFS + IR (×), HFS + Hyd (•), LETO (▪). Values are mean ± SD. *p < 0.05 versus OLETF HFS group.
Hemoglobin, hematocrit, serum iron, and EPO levels
At 26 weeks of age, levels of hemoglobin and hematocrit in the HFS + IR group were lower than those in the other groups. Levels of hemoglobin and hematocrit in the LETO group tended to be lower than in the HFS and HFS + Hyd groups. Serum iron levels were lower and EPO levels were higher in the HFS + IR group than in the other groups at 26 weeks of age ().
Table 1. Hemoglobin, hematocrit, serum iron and erythropoietin levels at 26 weeks of age.
Histological findings
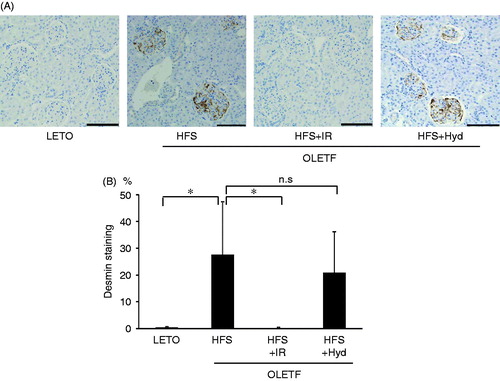
Iron accumulation was prominent in proximal tubular cells in the HFS group but negligible in the LETO group (). Iron restriction markedly decreased iron deposits areas in the kidney, whereas blood pressure lowering with hydralazine failed to attenuate iron deposition (). We performed immunohistochemistry of desmin for evaluating the presence of renal glomerular injury (). Semiquantitative analysis indicated that percentage of desmin-positive glomeruli was significantly higher in the HFS than in the LETO group. Iron restriction decreased desmin-positive glomeruli almost to the same level in the LETO group. Hydralazine treatment did not reduce renal glomerular injury.
Figure 2. Histological analysis of iron deposits of the kidney stained by Prussian blue (arrows) (A) and the degree of iron deposits was expressed as a percentage of Prussian blue positive areas per field (B) of OLETF HFS, HFS + IR, HFS + Hyd groups and LETO group at 26 weeks of age. n.s: not statistically significant. Scale bars represent 100 μm. Values are mean ± SD. *p < 0.05 versus OLETF HFS group.
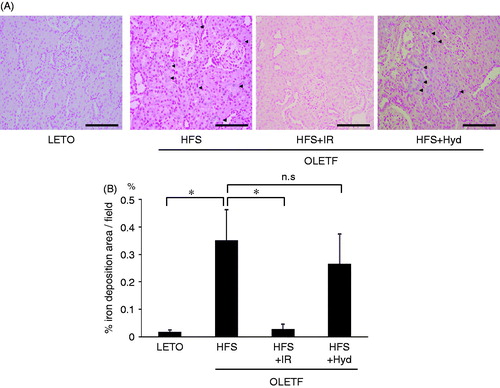
Figure 3. Photomicrographs of renal desmin expression (A) and semiquantitative analysis of immunostaining for desmin (B) of OLETF HFS, HFS + IR, HFS + Hyd groups and LETO group at 26 weeks of age. n.s: not statistically significant. Scale bars represent 100μm. Values are mean ± SD. *p < 0.05 versus OLETF HFS group.
Levels of urinary excretion of protein and 8-OHdG
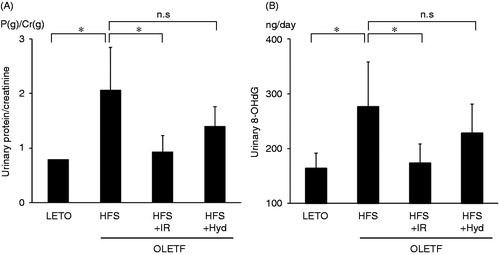
The levels of urinary excretion of protein and 8-OHdG were higher in the HFS than in the LETO group at 26 weeks of age (). Iron restriction, but not hydralazine treatment, decreased urinary protein and 8-OHdG excretion. These results suggested that iron restriction attenuated the development of nephropathy and the production of ROS in OLETF rats in a blood pressure-independent manner.
Figure 4. The ratio of urinary protein excretion to urinary creatinine excretion (A) and urinary 8-OHdG excretion (B) of OLETF HFS, HFS + IR, HFS + Hyd groups and LETO group at 26 weeks of age. n.s: not statistically significant. Values are mean ± SD. *p < 0.05 versus OLETF HFS group.
Gene expression of angiotensinogen in the kidney
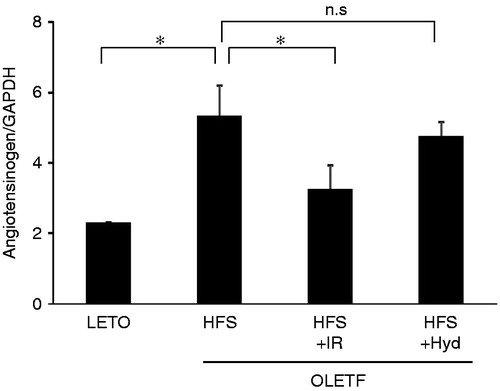
As shown in , the mRNA level of angiotensinogen in the kidney was increased in the HFS than in the LETO group at 26 weeks age. Iron restriction decreased the levels of angiotensinogen mRNA, but hydralazine did not alter the level of angiotensinogen mRNA in OLETF rats.
Figure 5. Angiotensinogen mRNA expression by RT-PCR in the kidney of OLETF HFS, HFS + IR, HFS + Hyd groups and LETO group at 26 weeks of age. n.s: not statistically significant. Values are mean ± SD. *p < 0.05 versus OLETF HFS group.
Hypoxic condition in the kidney
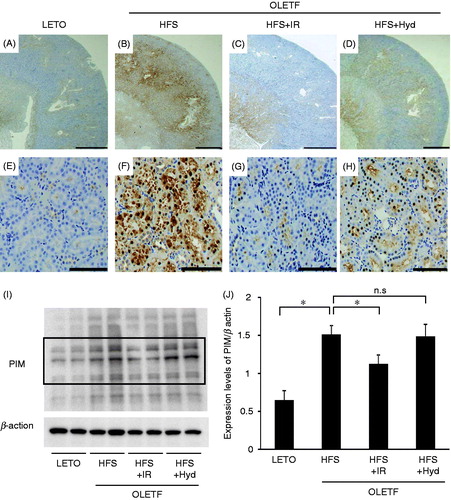
Hypoxic condition in the kidney was detected by using PIM. The intensity of PIM staining in the renal cortex was markedly increased in the HFS and the HFS + Hyd groups compared with the LETO group (). Iron restriction attenuated increased PIM staining in the renal cortex (). We evaluated intensity of PIM staining by using western blot. The intensity of the bands was increased in the HFS, which was decreased by iron restriction but not by hydralazine treatment (). Thus, iron restriction attenuated renal hypoxia in spite of systemic anemia.
Figure 6. Immunohistochemistry for hypoxia marker pimonidazole of OLETF HFS, HFS + IR, HFS + Hyd groups and LETO group at 26 weeks of age. Scale bars represent 1000 μm (A–D) and 100 μm (E–H) in the renal cortex. The western blot analysis for PIM (I) and the intensity of the bands which are inside the frame of bold line were measured and the quantitative data was normalized by the intensity of β actin (J). PIM: pimonidazole, n.s: not statistically significant. *p < 0.05 versus OLETF HFS group.
Discussion
In this study, we found that iron restriction decreased SBP, urinary excretion of protein and 8-OHdG, and gene expression of angiotensinogen in OLETF rats. Moreover, it improved renal hypoxic condition. These findings suggested that development of diabetic nephropathy was attenuated by iron restriction in OLETF rats.
Recently, diabetic nephropathy is considered as the most common condition in patients with end-stage renal diseaseCitation16 and become an important cause of morbidity and mortality in patients with type 2 DM. It was reported that iron accumulated in proximal tubular lysosomes in several models of renal disease, and its accumulation correlates with the degree of proteinuria.Citation8,Citation9 It was observed that iron deposits, 8-OHdG excretion, and renal glomerular injury were increased in the HFS group and were attenuated by iron restriction in this study. Through the Fenton reaction, iron generates various ROS such as hydroxyl radical which cause membrane lipid peroxidation and cellular damage. It was suggested that the lysosomal disruption induced by ROS was associated with proximal tubular damage.Citation8 Iron restriction might prevented renal damage by reducing iron deposits and oxidative stress in the kidney. Renin--angiotensin system (RAS) plays an important role in progression of diabetic nephropathy.Citation17 In type 2 DM patients, blocking RAS with angiotensin II type 1 receptor blockers or angiotensin converting enzyme inhibitors inhibit aggravation of nephropathy.Citation18,Citation19 Suzaki et al. reported that the increased ROS and the ROS associated activation of intrarenal angiotensinogen were involved in the development of renal injury in Zucker diabetic fatty rats.Citation20 In our study, we showed that iron restriction decreased ROS and gene expression of angiotensinogen of the kidney in OLETF rats. Iron restriction attenuates the development of nephropathy by reducing ROS itself and RAS activated by ROS. Furthermore, ROS, such as hydrogen peroxide and superoxide induced renal vascular constriction and caused hypoxia to the kidney.Citation21 Hypoxia induced tubulointerstitial damage causes interstitial fibrosis and loss of peritubular capillaries. The impairment of renal function correlates with the degree of tubulointerstitial damage.Citation22,Citation23 It has shown that renal tissue pO2 was decreased in diabetic kidney.Citation24,Citation25 In this study, we demonstrated that iron restriction caused anemia to OLETF rats, whereas improved renal hypoxic condition. Rosenberger et al. showed that ROS scavenger ameliorated hypoxia in diabetic rat kidney.Citation26 The reduction of ROS by iron restriction was likely to be involved in the improvement of hypoxic condition in the kidney of OLETF rats. Several studies reported that OLETF rats exhibited diabetic nephropathy showed apparent glomerular injury over 30 weeks of age.Citation13,Citation27 We demonstrated that iron restriction decreased production of ROS and prevented renal damage in early stage of diabetic nephropathy.
Increased serum levels of ferritin have been found in patients with DM and increased iron predicted the development of DM.Citation3,Citation4 Serum ferritin is considered as a marker of body iron stores. Iron affects insulin synthesis, sensitivity and secretion in the pancreas.Citation28 Thus, increased accumulation of iron could disturb glucose homeostasis. Blood donation has been associated with a low incidence of DM and phlebotomy induced reduction in body iron levels and improved insulin sensitivity in patients with DM.Citation29 The previous study showed that iron depletion improved glucose metabolism using OLETF rats at 43 weeks of age.Citation30 In this study, there was no difference in serum insulin and glucose levels between the HFS and the HFS + IR groups at 26 weeks of age (). Iron restriction may not influence on glucose metabolism in early stage of diabetic nephropathy. We demonstrated the efficacy of iron restriction on early stage of diabetic nephropathy. Current renoprotective treatment for diabetic nephropathy includes strict glycemic and blood pressure control, protein restriction, and the use of renin--angiotensin--aldosterone system blocking agents. We propose that iron restriction from early stage could be an effective strategy for preventing the development of type 2 DM nephropathy. The mechanisms for improvement in diabetic nephropathy with iron restriction should be investigated further.
Table 2. Fasting blood glucose and insulin levels at 26 weeks of age.
Conclusion
Iron restriction prevented the development of in the early stage of nephropathy in OLETF rats. Iron restriction may be beneficial in prevention of nephropathy in type 2 DM patients.
Declaration of interest
The authors report no conflicts of interest. The authors alone are responsible for the content and writing of the paper.
Acknowledgements
The authors are grateful to Noriko Kumon and Utako Kuze for their valuable assistance in the data management and for excellent technical assistance. We thank Dr Akari Furuse, Division of English, Hyogo College of Medicine, for critical reading of the manuscript. This study was supported by Grant-in-Aid for Scientific Research (C) from the Ministry of Education, Culture, Sports, Science and Technology of Japan.
References
- Aruoma OI, Halliwell B, Laughton MJ, Quinlan GJ, Gutteridge JM. The mechanism of initiation of lipid peroxidation. Evidence against a requirement for an iron(II)--iron(III) complex. Biochem J. 1989;258(2):617–620
- Jiang R, Manson JE, Meigs JB, Ma J, Rifai N, Hu FB. Body iron stores in relation to risk of type 2 diabetes in apparently healthy women. JAMA. 2004;291(6):711–717
- Salonen JT, Tuomainen TP, Nyyssönen K, Lakka HM, Punnonen K. Relation between iron stores and non-insulin dependent diabetes in men: case-control study. BMJ. 1998;317(7160):727
- Ford ES, Cogswell ME. Diabetes and serum ferritin concentration among U.S. adults. Diabetes Care. 1999;22(12):1978–1983
- Davis WD Jr, Arrowsmith WR. The treatment of hemochromatosis by massive venesection. Ann Intern Med. 1953;39(4):723–734
- Cutler P. Deferoxamine therapy in high-ferritin diabetes. Diabetes. 1989;38(10):1207–1210
- Cooksey RC, Jones D, Gabrielsen S, et al. Dietary iron restriction or iron chelation protects from diabetes and loss of beta-cell function in the obese (ob/ob lep-/-) mouse. Am J Physiol Endocrinol Metab. 2010;298(6):1236–1243
- Nankivell BJ, Chen J, Boadle RA, Harris DC. The role of tubular iron accumulation in the remnant kidney. J Am Soc Nephrol. 1994;4(8):1598–1607
- Harris DC, Tay C, Nankivell BJ. Lysosomal iron accumulation and tubular damage in rat puromycin nephrosis and ageing. Clin Exp Pharmacol Physiol. 1994;21(2):73–81
- Nankivell BJ, Boadle RA, Harris DC. Iron accumulation in human chronic renal disease. Am J Kidney Dis. 1992;20(6):580–584
- Nankivell BJ, Tay YC, Boadle RA, Harris DC. Lysosomal iron accumulation in diabetic nephropathy. Ren Fail. 1994;16(3):367–381
- Facchini FS, Saylor KL. A low-iron-available, polyphenol-enriched, carbohydrate-restricted diet to slow progression of diabetic nephropathy. Diabetes. 2003;52(5):1204–1209
- Kawano K, Hirashima T, Mori S, Saitoh Y, Kurosumi M, Natori T. Spontaneous long-term hyperglycemic rat with diabetic complications. Otsuka Long-Evans Tokushima Fatty (OLETF) strain. Diabetes. 1992;41(11):1422–1428
- Arteel GE, Thurman RG, Raleigh JA. Reductive metabolism of the hypoxia marker pimonidazole is regulated by oxygen tension independent of the pyridine nucleotide redox state. Eur J Biochem. 1998;253(3):743–750
- Varia MA, Calkins-Adams DP, Rinker LH, et al. Pimonidazole: a novel hypoxia marker for complementary study of tumor hypoxia and cell proliferation in cervical carcinoma. Gynecol Oncol. 1998;71(2):270–277
- de Zeeuw D, Ramjit D, Zhang Z, et al. Renal risk and renoprotection among ethnic groups with type 2 diabetic nephropathy: a post hoc analysis of RENAAL. Kidney Int. 2006;69(9):1675–1682
- Burnier M, Zanchi A. Blockade of the renin--angiotensin--aldosterone system: a key therapeutic strategy to reduce renal and cardiovascular events in patients with diabetes. J Hypertens. 2006;24(1):11–25
- Lewis EJ, Hunsicker LG, Bain RP, Rohde RD. The effect of angiotensin-converting-enzyme inhibition on diabetic nephropathy. The Collaborative Study Group. N Engl J Med. 1993;329(20):1456–1462
- Viberti G, Wheeldon NM. Microalbuminuria reduction with valsartan in patients with type 2 diabetes mellitus: a blood pressure-independent effect. Circulation. 2002;106(6):672–678
- Suzaki Y, Ozawa Y, Kobori H. Intrarenal oxidative stress and augmented angiotensinogen are precedent to renal injury in Zucker diabetic fatty rats. Int J Biol Sci. 2006;3(1):40–46
- Zou AP, Li N, Cowley AW Jr. Production and actions of superoxide in the renal medulla. Hypertension. 2001;37(2):547–553
- Nangaku M. Hypoxia and tubulointerstitial injury: a final common pathway to end-stage renal failure. Nephron Exp Nephrol. 2004;98(1):8–12
- Nangaku M. Chronic hypoxia and tubulointerstitial injury: a final common pathway to end-stage renal failure. J Am Soc Nephrol. 2006;17(1):17–25
- Palm F, Cederberg J, Hansell P, Liss P, Carlsson PO. Reactive oxygen species cause diabetes-induced decrease in renal oxygen tension. Diabetologia. 2003;46(8):1153–1160
- Ries M, Basseau F, Tyndal B, et al. Renal diffusion and BOLD MRI in experimental diabetic nephropathy. Blood oxygen level-dependent. J Magn Reson Imaging. 2003;17(1):104–113
- Rosenberger C, Khamaisi M, Abassi Z, et al. Adaptation to hypoxia in the diabetic rat kidney. Kidney Int. 2008;73(1):34–42
- Yagi K, Kim S, Wanibuchi H, et al. Characteristics of diabetes, blood pressure, and cardiac and renal complications in Otsuka Long-Evans Tokushima Fatty rats. Hypertension. 1997;29(3):728–735
- McClain DA, Abraham D, Rogers J, et al. High prevalence of abnormal glucose homeostasis secondary to decreased insulin secretion in individuals with hereditary haemochromatosis. Diabetologia. 2006;49(7):1661–1669
- Fernández-Real JM, Peñarroja G, Castro A, García-Bragado F, Hernández-Aguado I, Ricart W. Blood letting in high-ferritin type 2 diabetes: effects on insulin sensitivity and beta-cell function. Diabetes. 2002;51(4):1000--1004
- Minamiyama Y, Takemura S, Kodai S, et al. Iron restriction improves type 2 diabetes mellitus in Otsuka Long-Evans Tokushima fatty rats. Am J Physiol Endocrinol Metab. 2010;298(6):1140–1149