
Abstract
Aim: Surfactant proteins (SP-A and SP-D) were originally described in the lung; however, they are also present in the prostate. Purpose of this study, therefore, was to determine how surfactant proteins are altered in prostate adenocarcinomas (PCa) and find out any connection exists between their expressions and their staining patterns, prostate-specific antigen (PSA) values, Gleason score, age, tumor volume and tumor, node, metastases (TNM) clinical stage. Methods: Thirty-five tissue samples were obtained during radical prostatectomy. All specimens were classified to three groups based on the Gleason score <7, 7 and Gleason score >7. Surfactant proteins’ expressions were tested by immunohistochemical and Western blotting methods. Results: Immunoreactivity was detected in the cytoplasm from both basal cells and secretory epithelial cells in malignant and non-malignant areas. About 80% of the malignant basal cells were characterized as either weak or strong while non-malignant epithelial cells demonstrated strong immunoreactivity for SP-A. Also malignant (81.8%) and non-malignant cells (90.6%) were characterized as either weak or strong for SP-D. Decrement of SP-A and SP-D immunostaining tended to associate with an increasing Gleason score (p > 0.05, p < 0.05), tumor volume (p < 0.05, p > 0.05) and age (p > 0.05, p > 0.05). There was a strong positive correlation between Gleason score and tumor volume (p < 0.01). Also, either none or weak SP-A and SP-D immunoreactivity was observed specimens with Gleason score 7 or higher. SP-A and SP-D reacted with 34 kDa (SP-A) and 43 kDa (SP-D) immunoreactive single bands were decreased in tumor tissues. Conclusions: The development of prostate cancer may be related to decreased level of surfactant protein A and D.
Introduction
The surfactant proteins SP-A and SP-D are members of the class of collectins or collagenous C-type lectins of innate carbohydrate pattern recognition molecules.Citation1,Citation2 Both proteins are predominantly produced in the lung by the alveolar type II cells and bronchiolar Clara cells. SP-A is a 28–36 and SP-D a 43 kDa protein and both are involved in the innate defense system of the lung.Citation3–6 With their lectin domains, they can selectively recognize configurations of carbohydrates that are present on the outside of bacteria and fungi and on viral surface proteins, and inhibit infection with these pathogens by direct neutralization and agglutination, or by marking them for destruction by macrophages through opsonization.Citation7 However, the findings have been inconsistent. Until recently, SP-A and SP-D proteins are assumed to be associated exclusively with epithelial cells of the lungs but mRNA encoding for both molecules are also found in non-alveolar pulmonary sites including prostate. Oberley et al. reported that SP-D is present in human prostate and that it protects prostate epithelial cells from infection by Chlamydia in vitro.Citation8 Another study of Oberley et al. demonstrated that Escherichia coli infection stimulates SP-D protein production in the rat epithelium and showed that SP-D protein levels were significantly increased in early prostate infection.Citation9 Moreover, Northern blot analysis by Lu showed the presence of SP-A mRNA in human prostate.Citation10 Khubchandani and Synder detected both SP-A mRNA and ∼35 kDa SP-A protein in seminal fluid.Citation11 SP-A mRNA and protein have been reported in human prostate and seminal fluid.Citation10–12 SP-D has been described previously in human prostate,Citation8 rodent prostate,Citation9 and porcine prostate.Citation10 These studies also concluded that SP-A and SP-D in the prostate and prostatic secretions may be involved in host defense mechanisms in the male. The role of both SP-A and SP-D in the modulation of local inflammatory/immune responses is well described.
Therefore, we aimed to determine if SP-A and SP-D protein expression is altered in prostate adenocarcinoma. Based on the previous studies on prostate and male genital tract, the aim of our study was to analyze the human prostate for its ability to express and secrete SP-A and SP-D in healthy prostate and in adenocarcinoma of the prostate. In this study, we analyzed the relationship among age, tumor volume, tumor, node, metastases (TNM) clinical stage, Gleason score and prostate-specific antigen (PSA) with SP-A and SP-D expression by means of SP-A and SP-D immunostaining and Western blotting in samples of adenocarcinoma of the prostate obtained in radical prostatectomy.
Materials and methods
The experimental protocol for this study was approved by the Human Subjects Review Committee at the University of Akdeniz. Tissue samples were obtained during radical prostatectomy, and specimens were step-sectioned, entirely embedded, and evaluated.
Subjects
Patients with clinically localized prostate adenocarcinoma who agreed to have radical prostatectomy and signed a written informed consent form recruited to this study. Tumor specimens were classified according to TNM system by one pathologist. All specimens were classified to three groups based on the Gleason score <7, 7 and Gleason score >7. A value over 0.4 ng/mL PSA was accepted as cut off. Specimens were selected to represent a spectrum of Gleason scores ranging from 2 to 10 with a wide spectrum of pathologic stages.
Prostate tissues were collected during surgery for tumor removal, and were classified by clinical pathologists as prostate adenocarcinoma. Tissues adjacent to the adenocarcinoma tissue, but without histological features of adenocarcinoma, were used as normal controls.
Protein extraction from paraffin sections
The most representative tumor tissue blocks were chosen from each of the 35 cases evaluated. A region of abundant adenocarcinoma with homogeneous Gleason scores was circled on a whole-mount slide from each case, and regular-sized slide sections were cut from these areas for Western blotting. Isolation of protein from paraffin sections was done by a modified method of Ikeda et al.Citation13 Shortly, 4 μm thick prostate paraffin sections were cut for hematoxylin–eosin staining and 50 μm thick serial sections were cut for protein extraction. Sections mounted on plain glass slides were deparaffinized in xylene, rehydrated in graded ethanol, immersed in distilled water, and air-dried. The targeted areas and control regions were cut macroscopically with a fine needle. Collected control and tumor tissues were further cut into small pieces and placed in Eppendorf tube were sonicated (3 × 10 s bursts) in 0.15 M NaCl, with 0.005 M EDTA, at pH 7.4. Protein content of homogenates was determined using a Bio-Rad protein assay (Bio-Rad Laboratories, Hercules, CA).
Western blotting
Equal amount of human prostate homogenate (15–30 µg) protein (malignant and non-malignant) were separated by sodium dodecyl sulfate (SDS) polyacrylamide gel electrophoresis (PAGE). Proteins present in human prostate homogenates were subjected to one-dimensional SDS/PAGE (12, w/v, 1.5 mm thick polyacrylamide gels) by the method of LaemmliCitation14 with a Mini Protean II apparatus (Bio-Rad) in the presence of 5% mercaptoethanol. After electrophoresis, gels were used in Western blotting of antigens by transferring separated proteins onto the nitrocellulose membrane. Blots were probed with polyclonal SP- A antibody and monoclonal SP-D antibody diluted 1:500 with 0.05% TBS and incubated for 2 h at room temperature. Antigen–antibody complexes were detected by incubation of the membranes with the appropriate secondary antibodies (anti-mouse or anti-rabbit horseradish peroxidase-conjugated; Dako Japan, Kyoto, Japan) for 1 h at 22 °C. The bound secondary antibodies were detected by using the ECL Plus Western blotting detection system (Amersham, UK) according to the manufacturer’s instructions. Each membrane was exposed to the film for 2 min. SP-A and SP-D signal intensities in carcinoma and control extracts on autoradiographs were quantified using densitometry (Bio-Rad GS-670 Imaging Densitometer, Hercules, CA).
Immunohistochemistry
The SP-D antibody (monoclonal Hyb 245-01 mouse antihuman SP-D) was kindly provided by Dr. Uffe HolmskovCitation15 and the SP-A antibody (polyclonal rabbit anti-human SP-A) was donated by Hitomi Sano.Citation16 The specificity of the antibodies to human tissues was tested using Western blotting. Deparaffinized and rehydrated sections (4 µm) were microwaved for 10 min in buffer citrate, pH 6.0. Endogenous peroxidase was blocked for 20 min. Slides were rinsed with PBS and incubated in Ultra V Block solution. The primary antibodies against SP-A (SP-A, 100 µg/mL) and SP-D (SP-D, IgG 0.1 mg/0.1 mL) was incubated (1:500 dilution) at 4 °C for overnight. For negative controls, slides were incubated overnight with PBS or rabbit IgG. Bound primary antibodies were detected by Ultra Vision Detection System (LabVision Corporation, Fremont, CA) for 30 min and reaction was developed using diaminobenzidine and counter staining Mayers hematoxylin. Staining intensity was scored as 0 (no detectable stain), 1 (weak staining detected at intermediate to high power), 2 (moderate staining detected at low to intermediate power) to 3 (strong staining detected at low power). Staining percentage of immunoreactive cells (SP) was scored as 0 (0%), 1 (1–33% positive cells), 2 (34–66%), or 3 (67–100%). The total score was obtained by adding the scores of intensity and percentage of positive cells.
Evaluation of immunostaining
By light microscopy, representative and viable tissue sections were scored semi-quantitatively for immunostaining. Immunohistochemical labeling was quantified using a four-value intensity score (0 = negative; 1 = weak; 2 = intermediate; 3 = strong) and the percentage (0–100%) of the extent of reactivity in the tumor cells were evaluated at 200× magnification (20× objective + 10× ocular positioned with grids of 100 squares). Next, the expression score (immunoreactivity score; IRS) was obtained by multiplying the intensity and reactivity extension values (range, 0–300). These scores were assigned based on the staining pattern in the whole section. The histopathology and immunohistochemistry of all of the cases were reviewed by three of the authors (M.A. Ciftcioglu, C.I. Bassorgun, M.I.E. Karanis). All of the primary carcinomas were classified according to the Gleason’s grading system, which corresponds to tumor differentiation.
Statistical analysis
The statistical software SPSS version 12.0 (Chicago, IL) was used for statistical analysis. The Chi-square test and the Fisher’s exact test were used for studying categorical variables. ANOVA test was used for analyzing continuous variables. All values are expressed as means ± standard deviation. In all statistical comparisons, p < 0.05 was accepted as denoting significant differences.
Results
The levels of SP-A and SP-D expression were evaluated by immunohistochemistry in 35 radical prostatectomy specimens from patients treated for clinically localized prostate adenocarcinoma and quantified by Western blotting. In the present study, we sought correlations between surfactant proteins and the known prostate adenocarcinoma parameters, namely tumor volume, TNM stage, Gleason score, and PSA level. The clinical and histopathologic data are listed in .
Table 1. Clinical and histopathologic data (n = 35).
The patient age range was 52–79 years (mean 68.3 ± 1.2). The mean preoperative PSA value was 8.19 ng/mL (5.25–14.45 ng/mL). The average Gleason score was 6.8 (6–10) and most frequent pre-operative Gleason scores were 6 and 7. Tumor volume range was 1.00–49.34 cc (mean 8.07 cc ± 1.68). There was a strong positive correlation between Gleason score and tumor volume (p < 0.01). The TNM clinical stage was in 14 cases T2ab, in 16 cases T3a and in 5 cases T3b. Due to technical problems, we were unable to evaluate SP-A in malignant areas in one case and SP-D in two malignant and three non-malignant areas.
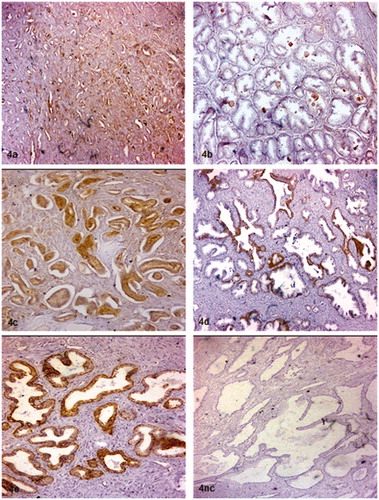
SP-A and SP-D immunostaining was uniformly intracytoplasmic in both malignant and non-malignant areas in same tissue sections (see and ). Positive immunoreactivity for SP-A and SP-D defined an intact basal cell layer surrounding the prostatic ductules and acini in non-malignant glands (see ). Additionally, strong positive SP-A and SP-D immunostaining particularly in inflammatory sites of non-malignant prostate tissue specimens was also observed (see ). The incidence of SP-A and SP-D immunostaining decreased in areas of malignant areas (see Figures 3a, c, e and 4a, c, e) compared to malignant areas (see Figures 3b, d, f and 4b, d) in the prostatectomy specimens. Relatively strong homogenous staining for SP-A and SP-D were detected in high-grade prostatic intraepithelial neoplasia (HGPIN, Figure not shown) in some cases. Overall, SP-A and SP-D immunoreactivity was found to be reduced in malignant areas in comparisons to areas of non-malignant areas in the same tissue sections. No immunoreactivity was observed in the negative staining controls incubated with pre-immune serum, or using the antibodies preabsorbed with an excess of purified antigens of SP-A and SP-D (see nc (negative control) and 3nc1). Immunostaining for SP-A was detected in 80% prostate adenocarcinomas and 85.3% of non-malignant areas in same tissue sections. Immunoreactivity for SP-D was 81.8% in malignant and 90.6% in non-malignant epithelial basal cells in the same tissue sections. An intensity score for SP-A was 1.38 ± 0.14 in non-malignant and 1.20 ± 0.14 in malignant areas. It was 1.72 ± 0.14 in non-malignant and 1.33 ± 0.13 in malignant areas for SP-D immunostaining. The distribution degree of SP-A immunostaining in malignant areas was as follows: no immunostaining in 7 cases, weak (1+) immunostaining in 11 cases, moderate immunostaining (2+) in 10 cases and strong (3+) immunostaining in 2 cases. In non-malignant areas, the degree of SP-A immunostaining was: no immunostaining in 5 cases, weak (1+) immunostaining in 14 cases, moderate immunostaining (2+) in 12 cases and strong (3+) immunostaining in 3 cases. Even though the distribution of the degree of immunostaining both SP-A and SP-D implied higher staining scores in non-malignant areas than malignant areas, the difference was not statistically different (p > 0.05). The negative association between the increasing Gleason score and SP-A immunostaining was not statistically significant (p > 0.05). An increase in tumor volume correlated negatively with the degree of SP-A immunostaining (p < 0.05).
Figure 1. (a) and (b): Immunohistochemical staining of basal cells with SP-A and SP-D proteins (original magnification was 200×).
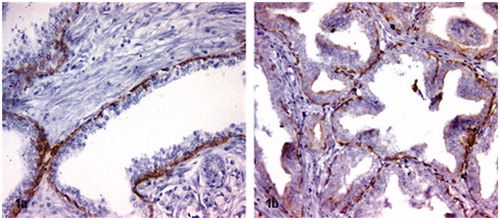
Figure 2. Strong positive SP-A (a) and SP-D (b) immunostaining particularly in inflammatory sites of non-malignant prostate tissue specimens. Note: Original magnifications for the images was 200×.
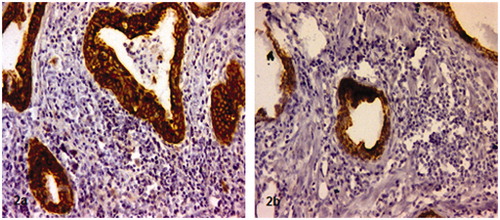
Figure 3. Immunohistochemical staining intensity scores. Prostate adenocarcinomas and non-malignant areas in same tissue sections stained with anti SP-A antibody (a) 1+ staining, (c) 2+ staining (e) 3+ staining. Non-malignant areas stained with anti SP-A antibody (b) 1+ staining, (d) 2+ staining (f) 3+ staining. Negative staining (nc1) of prostate adenocarcinoma, negative control staining of non-malignant areas (nc2). Note: Original magnifications of images; (a) 200×, (b) 50×, (c) 100×, (d) 100×, (e) 50×, (f) 50×, nc1; 50×, nc2: 100×.
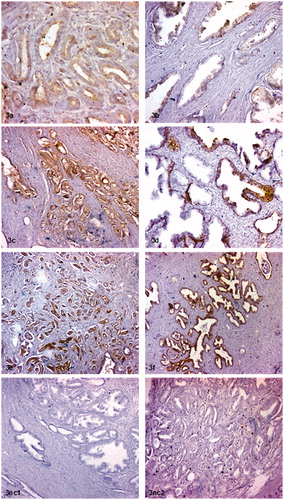
Figure 4. Immunohistochemical staining intensity scores. Prostate adenocarcinomas and non-malignant areas in same tissue sections stained with anti SP-D antibody (a) 1+ staining, (c) 2+ staining. Non-malignant areas stained with anti SP-D antibody (b) 1+ staining, (d) 2+ staining (e) 3+ staining. Negative control staining (nc). Note: Original magnifications of images; (a) 100×, (b) 50×, (c) 50×, (d) 50×, (e) 100, nc 50×.
There was no SP-A immunostaining of glandular epithelial cells in 14.7% of the cases (5 cases), but there was weak epithelial cell staining in 41.2% of the cases (14 cases), moderate epithelial cell staining in 35.3% of the cases (12 cases) and strong epithelial staining in 8.8% of the cases (3 cases) in non-malignant areas of prostate. There was no epithelial SP-D immunostaining in non-malignant areas in 9.4% of the cases (3 cases), weak epithelial staining in 21.9% of the cases (7 cases), moderate epithelial staining in 56.3% of the cases (18 cases) and strong epithelial staining in 12.5% of the cases (4 cases).
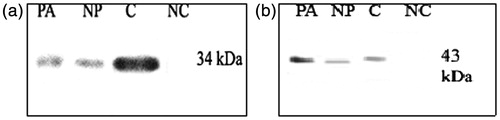
The distribution degree of SP-D immunostaining in malignant epithelial basal cells was as follows: no immunostaining in 6 cases, weak (1+) immunostaining in 10 cases, moderate immunostaining (2+) in 17 cases and no strong (3+) immunostaining. In non-malignant basal cells, the distribution of SP-A immunostaining was: no immunostaining in 3 cases, weak (1+) immunostaining in 7 cases, moderate immunostaining (2+) in 18 cases and strong (3+) immunostaining in 4 cases. Increasing Gleason score correlated negatively with SP-D immunostaining (p < 0.05), but such a correlation was not found between increase in tumor volume SP-D immunostaining (p > 0.05). Moreover, positive SP-A and SP-D immunostaining was observed in HGPINE regions in some specimens. Preoperative PSA value did not correlate with the tumor grade of SP-A and SP-D immunostained patients (p > 0.05). Increased Gleason score associated with decreased staining intensity of SP-A and SP-D. No or only weak staining was observed specimens with Gleason score 7 or higher. A positive correlation was found between the age of patients and PSA values (p < 0.05) and tumor volume (p < 0.05). The mean age correlated negatively with SP-D (p < 0.05) but not with SP-A (p > 0.05). Western blot analysis of SP-A and SP-D in malignant and non-malignant prostate tissue extracts revealed some differences in banding pattern. An intensity of positive reactivity in expected molecular weights; ∼34 kDa for SP-A and ∼43 kDa for SP-D were higher in non-malignant extracts than in malignant extracts. The positive pulmonary sample controls showed both the SP-A and SP-D bands, whereas no bands were observed in the negative method controls using SP-A and SP-D peptides for antigen preabsorption (see ). The same results were obtained from all samples.
Figure 5. (a) and (b) Western blot analysis of SP-A and SP-D in prostate from control and prostate adenocarcinoma. A. Western blot of prostate extracts obtained from noncadenocarcinomas site (NP) and adenocarcinoma field (PA) were probed with antibodies against SP-A (a) and SP-D (b). Note: PA; prostate adenocarcinoma, NP; normal prostate, C; control, NC; negative control.
Discussion
The presence of SP-A mRNA in the human prostate,Citation15,Citation17,Citation18 human seminal fluidCitation11 and testicular Leydig cellsCitation19 has been reported. Also, SP-D mRNA and protein are expressed throughout the mouse male reproductive tract. Infection of the rat prostate with E. coli results in increase of SP-D production and protein levels controlled by androgens.Citation9 Another study showed the SP-D mRNA is expressed in the epithelial cells of the prostate gland, and prostatic epithelial cells in culture. It was also demonstrated that SP-D protein inhibits the infection of prostate epithelial cells by Chlamydia trachomatis.Citation8
Present raw data are the first report to suggest decreases in both SP-A and SP-D protein immunoreactivity in prostate adenocarcinoma, compared to non-malignant prostate tissue. The decrease in SP-A and SP-D staining of malignant tissue was not only seen in the incidence of staining (for SP-A 85.3 vs. 80% and for SP-D 90.6 to 81.8%, respectively) but also in lower intensity scores (for SP-A 1.38 vs. 1.20 and for SP-D 1.72 vs. 1.33, respectively). In present study, immunohistochemistry were carried out manually so a study showed that the correlations between manual and automated measurements are quite high (around 90%); moreover, an averaged threshold measure scores are generally similar to the results obtained with manual scoring by an expert pathologist.Citation20 Published data regarding SP-A expression and distribution in benign and malignant lung adenocarcinoma tissue are conflicting; such as one of the pioneering study of Mizutani et al. showed that SP-A is a good marker to distinguish adenocarcinoma of the lung from other histologic types of lung cancer.Citation18 O’Reilly et al. reported that increased synthesis of SP-A in a cell line derived from a lung adenocarcinoma by using immunoblot analysis and ELISA.Citation21 Linnoila et al. suggested the high level of SP-A expression in adenocarcinomas with papillolepidic growth patterns by immunohistochemical analysis.Citation22 Moreover, Shijubo et al. found that 27 of 67 patients with lung adenocarcinomas had high levels of SP-A in their pleural effusions.Citation23,Citation24 On the other hand, Fujita et al. reported SP-A expression in only 1 of 16 lung cancer cell lines, 6 of which were adenocarcinomas using both immunohistochemical analysis, RT-PCR and sequencing.Citation25 Additionally, Zamecnik and Kodet observed significantly less SP-A immunoreactivity in poorly differentiated than in well-differentiated lung adenocarcinomas.Citation26 Tsutsumida et al. reported a reduced SP-A protein expression in tissue level of lung adenocarcinoma cases with a micropapillary pattern as observed in present study but in different tissues.Citation27
Additionally, we found that increased Gleason scores associated with decreased staining intensity of both SP-A and SP-D. Further, no or only weak staining was observed when the Gleason score was 7 or higher. Moreover, tumor volume correlated positively with Gleason score and there was a negative correlation between tumor volume and SP-A and SP-D expression levels. Generally speaking, SP-A and SP-D decreased upon increasing Gleason score, tumor volume, and age. A decrease in surfactant proteins A and D upon increasing Gleason score and tumor volume suggested that this might be a negative prognostic factor in prostate adenocarcinoma.
On the basis of our findings of expression of SP-A and SP-D by acinar epithelial cells and more rarely also by basal cells in non-malignant fields of human prostate and in particular increases in both SP-A and SP-D expression in glandular structures in inflammatory fields of non-malignant prostate support the well-known roles of surfactant protein A and D in innate immunity. Present findings are consistent with and extend the previous reports by Oberley et al.,Citation8,Citation9 so an increase of inflammatory cells in prostate tissue result in increases SP-A and SP-D proteins and their secretion, which may leads to leukocyte chemotaxis (see ). The reason for this decrease is unknown at present. This could be explained by excretion to prostatic secretions or release to serum and, therefore, decreased tissue levels in immunostaining and Western blotting. If this is the case, then future studies should analyze SP-A and SP-D in seminal fluid and serum as for their potential as biomarkers for prostate adenocarcinoma. It is also possible that malignant transformation may impairs the capacity of epithelial cells in prostate to produce SPA and SP-D, which could impair innate immune responses against malignantly transformed cells and secondary infections. In any case, in this particular point prostate adenocarcinoma seems to differ from lung carcinomas, suggesting different pathomechanisms underlying.
In conclusion, through their local barrier and defense functions, SP-A and SP-D in might have important roles in innate responses against infections and inflammation in prostate. We found that both protein levels are lowered in prostate carcinomas. With known anti-inflammatory properties: their decreased levels may be important in the progression of the malignant process and may contribute to the development and/or progress of the prostate cancer.
Declaration of interest
The authors report no conflicts of interests. The authors alone are responsible for the content and writing of this article.
Acknowledgments
The authors thank Uffe Holmskov (University of Southern Denmark), Hitomi Sano and Yoshio Kuroki, MD, PhD (Sapporo Medical University School of Medicine, Japan) for the monoclonal and polyclonal SP-A and SP-D antibodies and Professor David S. Phelps (College of Medicine, University of Pennsylvania) for the SP-A antiserum. The authors also acknowledge support from the University of Akdeniz, Antalya, and The University of Mehmet Akif Ersoy, Burdur, Turkey.
References
- Crouch E, Wright JR. Surfactant proteins A and D and pulmonary host defense. Annu Rev Physiol. 2001;63:521–554
- Crouch E, Hartshorn K, Ofek I. Collectins and pulmonary innate immunity. Immunol Rev. 2000;173:52–65
- White RT, Damm D, Miller J, et al. Isolation and characterization of the human pulmonary surfactant apoprotein gene. Nature. 1985;317:361–363
- Katyal SL, Singh G, Locker J. Characterization of a second human pulmonary surfactant-associated protein SP-A gene. Am J Respir Cell Mol Biol. 1992;6:446–452
- Crouch E, Rust K, Veile R, Donis-Keller H, Grosso L. Genomic organization of human surfactant protein D (SP-D). SP-D is encoded on chromosome 10q22.2-23.1. J Biol Chem. 1993;268:2976–2983
- Shimizu H, Fisher JH, Papst P, et al. Primary structure of rat pulmonary surfactant protein D cDNA and deduced amino acid sequence. J Biol Chem. 1992;267(3):1853–1857
- Crouch EC. Structure, biologic properties, and expression of surfactant protein D (SP-D). Biochim Biophys Acta. 1998;1408:278–289
- Oberley RE, Goss KL, Dahmoush L, Ault KA, Crouch EC, Snyder JM. A role for surfactant protein D in innate immunity of the human prostate. Prostate. 2005;65:241–251
- Oberley RE, Goss KL, Quintar AA, Madonado CA, Synder JM. Regulation of surfactant protein D in the rodent prostate. Reprod Biol Endocrinol. 2007;5:42–49
- Lu J. Collectins: collectors of microorganisms for the innate immune system. Bioessays. 1997;19:509–518
- Khubchandani KR, Snyder JM. Surfactant protein A (SP-A): the alveolus and beyond. FASEB J. 2001;15:59–69
- Ohtani K, Suzuki Y, Eda S, et al. The membrane-type collectin CL-P1 is a scavenger receptor on vascular endothelial cells. J Biol Chem. 2001;276(47):44222–44228
- Ikeda K, Monden T, Kanoh T, et al. Extraction and analysis of diagnostically useful proteins from formalin-fixed, paraffin-embedded tissue sections. J Histochem Cytochem. 1998;46(3):397–404
- Laemmli UK. Cleavage of structural proteins during the assembly of the head of bacteriophage T4. Nature. 1970;227:680–685
- Madsen J, Kliem A, Tornoe I, Skjodt K, Koch C, Holmskov U. Localization of lung surfactant protein D on mucosal surfaces in human tissue. J Immunol. 2000;164:5866–5870
- Murakami S, Iwaki D, Mitsuzaw H, et al. Surfactant protein A inhibits peptidoglycan-induced tumor necrosis factor – secretion in u937 cells and alveolar macrophages by direct interaction with toll-like receptor 2. J Biol Chem. 2002;277(9):6830–6837
- Luo JM, Wan YS, Liu ZQ, Wang GR, Floros J, Zhou HH. Regularity of distribution of immunoreactive pulmonary surfactant protein A in rat tissues. Int J Mol Biol. 2004;14:343–351
- Madsen J, Tornoe I, Nielsen O, Koch C, Steinhilber W, Holmskov U. Expression and localization of lung surfactant protein A in human tissues. Am J Respir Cell Mol Biol. 2003;29:591–597
- Mizutani Y, Nakajima T, Morinaga S, et al. Immunohistochemical localization of pulmonary surfactant apoproteins in various lung tumors: special reference to nonmucus producing lung adenocarcinomas. Cancer. 1988;61(3):532–537
- Choudhury KR, Yagle KJ, Swanson PE, Krohn KA, Rajendran JG. A robust automated measure of average antibody staining in immunohistochemistry images. J Histochem Cytochem. 2010;58(2):95–107
- O’Reilly MA, Gazdar AF, Morris RE, Whitsett JA. Differential effects of glucocorticoid on expression of surfactant proteins in a human lung adenocarcinoma cell line. Biochim Biophys Acta. 1988;970:194–204
- Linnoila RI, Mulshine JL, Steinberg SM, Gazdar AF. Expression of surfactant-associated protein in non-small-cell lung cancer: a discriminant between biologic subsets. J Natl Cancer Inst Monogr. 1992;13:61–66
- Shijubo N, Honda Y, Fujishima T, et al. Lung surfactant protein-A and carcinoembryonic antigenin pleural effusions due to lung adenocarcinoma and malignant mesothelioma. Eur Respir J. 1995;8:403–406
- Shijubo N, Tsutahara S, Hirasawa M, et al. Pulmonary surfactant protein A in pleural effusions. Cancer. 1992;69(12):2905–2909
- Fujita F, Ohtsuki Y, Bandoh S, et al. Expression of thyroid transcription factor-1 in 16 human lung cancer cell lines. Lung Cancer. 2003;39(1):31–36
- Zamecnik J, Kodet R. Value of thyroid transcription factor-1 and surfactant apoprotein A in the differential diagnosis of pulmonary carcinomas: a study of 109 cases. Virchows Arch. 2002;440:353–361
- Tsutsumida H, Goto M, Kitajima S, et al. Combined status of MUC1 mucin and surfactant apoprotein A expression can predict the outcome of patients with small-size lung adenocarcinoma. Histopathology. 2004;44:147–155