
Abstract
Background: Determination of fluid overload is important in chronic kidney disease. Early diagnosis and treatment of volume overload may decrease morbidity and mortality. We aimed to determine body composition by using bioelectrical impedance analysis, and studying other clinical characteristics, inferior vena cava diameter, and N-terminal pro-B natriuretic peptide associated with hydration status in chronic kidney disease Stages 3&4 and 5 in patients not undergoing dialysis. Method: We examined 62 patients with Stages 3&4 and 68 patients with Stage 5 chronic kidney disease. Plasma NT-proBNP was measured and analyzed after log transformation. Inferior vena cave diameter was measured with echocardiography and indexed for body surface area. Hydration status was assessed using multi-frequency bioelectrical impedance analysis. Overhydration was defined as overhydration/extracellular water >0.15. Results: Overhydration was more frequent in Stage 5 than in Stages 3&4 patients. Systolic and diastolic blood pressure, inferior vena cava index, and log NT-proBNP were higher in overhydrated compared to non-overhydrated patients. A significant positive correlation existed between overhydration/extracellular water and log NT-proBNP, systolic and diastolic blood pressures, and inferior vena cava index. In multiple linear regression analysis, the variables associated with hydration status were male sex, extracellular water/total body water, and extracellular water/intracellular water (greater overhydration), while serum albumin levels had a negative association with overhydration. Conclusion: Overhydration is more prevalent in Stage 5 chronic kidney disease patients than in Stages 3&4 patients. Bioelectrical impedance analysis, inferior vena cava diameter, and NT-proBNP analysis in chronic kidney disease are useful methods to determine the volume overload.
Introduction
Chronic kidney disease (CKD) is a syndrome characterized by chronic, progressive, irreversible nephron loss. Despite the fact that water clearance is usually preserved until the end stages of the renal disease, volume overload can occur because of the inability of the body to remove the excess fluid in intact nephrons at the late stages of renal disease. In this case, determining the degree of volume load is important. Because it is known that the most important cause of mortality in this patient population is cardiovascular disease, determination of fluid overload is very important.
Physical examination and PA-Chest radiography imaging for volume overload is generally ineffective in patients with Stages 3&4 chronic kidney disease. Therefore, new approaches have been developed to detect the volume overload. Some of these include measurement of inferior vena cava (IVC) diameter, natriuretic peptides, and bioelectrical impedance analysis (BIA). IVC diameter assessed by echocardiography is an important and useful parameter used to evaluate volume overload.Citation1 Furthermore, N-terminal pro-B natriuretic peptide (NT-proBNP), which is secreted depending on volume and pressure load, is also used to evaluate the volume overload.Citation2 Body fluid composition may also be evaluated by using Body Composition Monitoring devices and Bioelectrical Impedance Analysis (BIA) that was recently developed. BIA is a safe, applicable, noninvasive method that provides low-cost detailed informationCitation3–5 and can be used to determine hydration status, especially in patients with early stage chronic kidney disease.Citation6 This technology is based on flow transmission in the human body and measures the resistance of water, ions and reactants that occurs due to the capacitor characteristics of cell membranes.
In the present study, we aimed to determine body composition by using the BIA method, as well as studying other clinical characteristics, IVC diameter, and NT-proBNP associated with hydration status in CKD Stages 3&4 and 5 patients who are not undergoing dialysis.
Materials and methods
The study design included 62 patients with Stage 3&4 and 68 patients with Stage 5 chronic kidney disease who have been newly diagnosed and have not yet undergone renal replacement treatment at the Nephrology Department of Dicle University Hospital, Diyarbakır, Turkey from 2011 and 2012. The Local Human Research Ethics Committee approved the study protocol, and informed consent was obtained from all patients at the time of study enrollment.
The exclusion criteria were as follows: (1) patients who had received renal replacement therapy, (2) patients with ejection fraction <55%, (3) hemodynamically unstable patients, (4) patients whose general medical status were poor, (5) patients with cerebrovascular disease, (6) patients who have received diuretic treatment, (7) patients who had limb amputation, pacemakers, or metallic intravascular devices, and any malignant disease or pregnancy.
Patient demographics were obtained from patient’s registries and themselves. Systolic and diastolic blood pressures were measured on the right arm after at least a 15-min resting period by using an air manometer. Twenty-four hour urine samples were collected to assess the level of proteinuria. Glomerular filtration rate (GFR) was estimated using the four-variable Modification of Diet in Renal Disease (MDRD) formulaCitation7 and expressed in mL/min per 1.73-m2 body surface area (BSA). Stage 3, 4, and 5 CKD (estimated GFR 30–59, 15–29, and <15 mL/min/1.73 m2, respectively) were defined according to Kidney Disease Outcomes Quality Initiative (K/DOQI) classification.Citation8 Blood samples were collected from all patients for the biochemical, hematological, hormonal and serological parameters after a 12-h fasting period and on the same day as the BIA measurements. NT-proBNP was measured in serum using Elecsys proBNP sandwich immunoassay (Roche Diagnostics, Mannheim, Germany).
IVC diameter was measured during expiration while the patient was in the supine position after 10 min of rest at the level just below the diaphragm in the hepatic segment by 2D-guided M-mode echocardiography (Vivid 7, GE Healthcare, Horten, Norway) in the cardiology polyclinic by the same cardiologist. IVC diameter was indexed for body surface area (BSA) as IVC index (mm/m2).
A multi-frequency BIA device (Body Composition Monitor, BCM, Fresenius Medical Care D GmbH), which measures 50 different frequencies from 5 to 1000 kHz was used to assess hydration status. With this device, parameters such as body fluid configurations, total body fluid, extracellular fluid, and volume excess were analyzed by performing Bioelectrical Impedance Analysis. The measurements were performed after a 20-min resting period with the patient in the supine position. Metal and electronic devices that might interact with the transmission were removed. The procedure was performed after ensuring that patients had not consumed a heavy meal in at least 4 to 5 h, had not exercised for 12 h before the test, and had not consumed any beverages including alcohol and caffeine within 24 h before the test. Electrodes of the BCM device were placed on patients’ wrists and ankles. The following parameters were collected: overhydration (OH), extracellular water (ECW), intracellular water (ICW), total body water (TBW) in liters (l), ECW/TBW, ECW/ICW, and OH/ECW ratio. Overhydration was defined as OH/ECW ratio greater than 0.15 according to previous reports.Citation9,Citation10 Patients were divided into 2 groups: overhydrated (OH/ECW > 0.15) and non-overhydrated (OH/ECW ≤ 0.15).
Statistical analysis
Data analyses were performed using Statistical Package for Social Sciences (SPSS), Version 18.0 for Windows (SPSS Inc., Chicago, IL). The variables were investigated using visual (histograms, probability plots) and analytical methods (Kolmogorov–Simirnov test) whether or not they were normally distributed. Serum NT-proBNP levels were logarithmically transformed to normalize the distribution of the concentrations. Descriptive analyses are presented using means and standard deviations for normally distributed variables. The Student t test was used to compare the means of the continuous variables with normal distribution for related and independent samples. The proportions of patients with overhydration are presented using cross tabulations between groups. The chi-square test was used to compare these proportions in different groups. Correlations of parameters with OH/ECW were studied using Pearson’s correlation. A multiple linear regression analysis was performed to identify independent predictors of OH/ECW.
Results
A total of 130 patients were enrolled in the study; 62 patients with CKD Stages 3&4 and 68 patients with CKD Stage 5. The distribution of underlying renal diseases in both groups is presented in . There was no difference in age between the patients with CKD Stages 3&4 (54.14 ± 13.52 years) and patients with CKD Stage 5 (51.05 ± 17.64 years) or gender distribution (52.3% male vs. 47% male, respectively).
Table 1. The distribution of underlying renal diseases in both study groups.
GFR (p < 0.001) and residual urine (p < 0.001) were significantly higher, while proteinuria (p = 0.020), IVC index (p < 0.001; ), log NT-proBNP (p < 0.001; ), systolic blood pressure (p = 0.008), diastolic blood pressure (p = 0.003), creatinine (p < 0.001) and urea (p < 0.001) were significantly lower in patients with CKD Stages 3&4 than in patients with CKD Stage 5. As regards the derived parameters of BIA, patients with CKD Stage 5 had significantly higher values of OH/ECW (0.18 ± 0.05 vs. 0.12 ± 0.03, p < 0.001; ), OH (3.91 ± 0.83 vs. 2.26 ± 0.47, p = 0.001), ECW (19.67 ± 4.61 vs. 17.70 ± 3.84, p = 0.010), ECW/TBW (0.51 ± 0.05 vs. 0.46 ± 0.04, p < 0.001), and ECW/ICW (1.09 ± 0.25 vs. 0.94 ± 0.18, p < 0.001) than patients with CKD Stages 3&4. depicts patient demographics, and clinical, laboratory, and BIA characteristics.
Figure 1. The box plots shows (a) the IVC index, (b) log NT-proBNP and (c) OH/ECW values in patients with CKD stage 3&4 and 5.
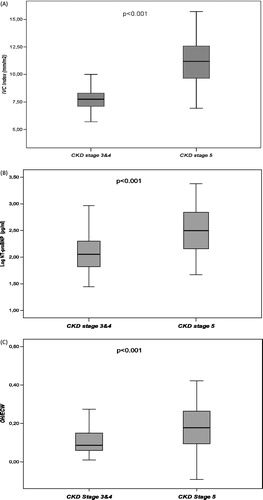
Table 2. Demographic, clinical, laboratory and BIA characteristics of the groups.
As shown in , the presence of overhydration according to OH/ECW was statistically more frequent in patients with CKD Stage 5 than in patients with CKD Stages 3&4 (60.3% vs. 29.0%, p < 0.001). Systolic blood pressure (137.20 ± 18.64 vs. 123.52 ± 15.59, p < 0.001; ), diastolic blood pressure (85.33 ± 9.77 vs. 78.38 ± 8.73, p < 0.001; ), IVC index (10.83 ± 2.54 vs. 8.76 ± 1.87, p < 0.001; ) and log NT-proBNP (2.55 ± 0.37 vs. 2.10 ± 0.48, p < 0.001; ) were significantly higher in overhydrated CKD patients (n = 59) compared to non-overhydrated CKD patients (n = 71).
Figure 2. (a) Comparison of systolic blood pressure (SBP) between overhydrated CKD patients and non-overhydrated CKD patients; (b) comparison of diastolic blood pressure (DBP) between overhydrated CKD patients and non-overhydrated CKD patients.
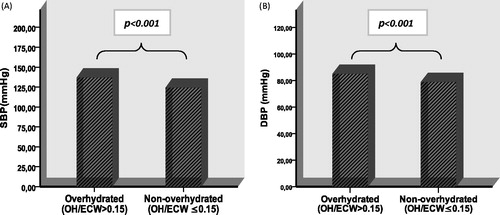
Figure 3. (a) Comparison of IVC index between overhydrated CKD patients and non-overhydrated CKD patients; (b) comparison of log NT-proBNP between overhydrated CKD patients and non-overhydrated CKD patients.
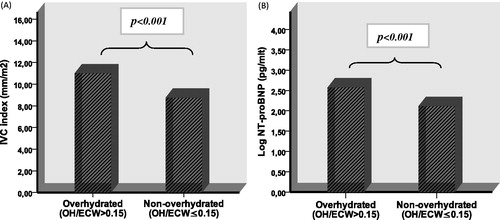
Table 3. Evaluation of the overhydration between the groups.
There was a significant positive correlation between OH/ECW and log NT-proBNP, proteinuria, SBP, DBP, urea, creatinine, OH, ECW, TBW, ECW/TBW, ECW/ICW, and IVC index and a negative correlation with albumin, residual urine, and GFR ().
Table 4. Correlations between OH/ECW and study parameters.
Using multiple linear regression (), the variables that were associated with hydration status, denoted as OH/ECW, were male gender, ECW/TBW and ECW/ICW (greater overhydration), while serum albumin levels showed a negative association with overhydration.
Table 5. Covariables associated with OH/ECW by multiple linear regression.
Discussion
Sodium and water balance in the body is preserved until advanced stages of the disease; however, the volume overload increased by progression of the disease increases morbidity and mortality. Due to this close relationship, early diagnosis and treatment of the volume overload are very important, and may result in decreased morbidity and mortality. The accurate assessment of fluid status is a major clinical issue. Along with traditional methods for detection of the volume overload, volume overload determined with echocardiography, analysis of NT-proBNP, which is a biochemical parameter, and detection of the quantity of body fluid and configuration by Body Composition Monitoring (BCM) have become important approaches.
Body composition assessment has been increasingly used in clinical settings, and has the potential to improve the care of patients.Citation11 This method indicates the degree of volume overload during early CKD stages.Citation12 Although BIA derived parameters, such as OH, ECW/TBW, and OH/ECW ratio (relative hydration status) are used as markers of the volume status in patients with CKDCitation9,Citation10,Citation13,Citation14 OH/ECW ratio seems to be at the forefront of volume overload detection.
Dumler et al., in a prospective study including 40 patients with a mean GFR 36 ± 12 mL/min/1.72 m2, revealed that overhydration was developed in 62% of patients.Citation15 In another study, Caravaca et al. found that overhydration was much lower (10.8%) in a similar patient population (patients with eGFR < 40 mL/min).Citation6 In the present study, we found that patients with CKD Stage 5 had significantly higher values of OH, ECW, and OH/ECW than patients with CKD Stage 3&4. In contrast to the findings by Caravaca et al., but in agreement with the findings of Dumler et al., our study demonstrated that the presence of overhydration according to OH/ECW was found more frequently in patients with CKD Stage 5 than in patients with CKD Stages 3&4 (60.3% vs. 29.0%, respectively, p < 0.001). The findings of this study suggest that overhydration begins to occur in patients with mild to moderate CKD, and becomes apparent in the late stage of CKD. As kidney failure progresses, fluid and electrolyte homeostasis becomes disrupted, leading to volume overload, and emerges as a major clinical issue in the end stage of CKD.
Volume overload in CKD is closely related with body fluid configuration. In the present study, OH, ECW, OH/ECW, ECW/TBW, and ECW/ICW, derived parameters of BIA measurements were found to be significantly higher in patients with CKD Stage 5 than in patients with CKD Stages 3&4, whereas ICW was not significantly different between the groups. Also, OH/ECW, which was used to assess volume overload, was significantly positively correlated with ECW/TBW and ECW/ICW, but not with ICW. On further analysis by using multiple linear regression, the variables that were associated with hydration status, denoted as OH/ECW, were male gender, ECW/TBW, and ECW/ICW (greater overhydration), while serum albumin levels showed a negative association with overhydration. Our data indicate that the increase in total body fluid occurs in extracellular compartments. Male gender was found to be a risk factor for overhydration. This finding is in agreement with previous studies.Citation6,Citation16,Citation17 Hypoalbuminemia causes fluid to move from blood into the tissue. The kidney perceives the decrease of fluid in the blood, which results in fluid retention.
Hypertension is very frequent in patients with renal disease, and its prevalence increases as renal disease progresses.Citation18 It has been shown in many studies that increased volume overload is basically in an extracellular fluid compartment, which results in hypertension.Citation19,Citation20 Our study by using the BIA determinations OH/ECW revealed the association between volume overload and hypertension. We found that SBP and DBP were significantly higher in overhydrated CKD patients. Blood pressure increasing with the volume overload is clinically important. Since hypertension contributes to the worsening of CKD, strict control of blood pressure is essential in the management of the disease. Normotension can be achieved by the control of fluid balance in such patients.
Transthoracic echocardiography is one of the most common methods used clinically to determine volume overload. Cheriex et al.Citation1 defined overhydration as IVC index >11.5 mm/m2 in hemodialysis patients. Oe et al. found a correlation between IVC diameter and ECW/TBW and ICW/ECW in a study of 19 peritoneal dialysis (PD) patients.Citation21 IVC index was significantly higher in patients with CKD Stage 5 than in patients with CKD Stages 3&4 in this study. In addition, IVC index was significantly higher in overhydrated CKD patients compared to non-overhydrated CKD patients, and it was positively correlated with OH/ECW (reflecting overhydration). The inferior vena cava is the largest vessel of the venous system, and low pressure and enlargement reflect volume excess to a certain degree. Therefore, IVC diameter is a valuable parameter for the assessment of hypervolemia. Increased extracellular fluid induced vascular luminal site dilatation and vascular wall hypertrophy and changes endothelial functions. Consequently, changes appear in vascular structures and function in those with end-stage kidney disease.Citation22 Measurement of different diameters and volumes in the heart and large vascular structures is important while assessing volume load. The measurement of IVC diameter is also operator-dependent and may be influenced by various cardiovascular diseases, which, therefore, limits its use.
NT-proBNP is secreted in the heart as a response to the increased tension and/or volume in ventricular myocytes. Disrupted kidney function is associated with increased circulating natriuretic peptide levels and also increases when GFR decreases.Citation23,Citation24 Nevertheless, it has been debated as to whether increased levels of NT-proBNP in patients with CKD are the result of decreased renal clearance of NT-proBNP or volume overload. In the present study, NT-proBNP increased as GFR decreased. This finding is in agreement with previous studies. Van Kimmenade et al. found an inverse correlation between clearance of peptides with small molecular weight, such as BNP, NT-proBNP, and GFR.Citation25 Sandeep et al. found that both NT-proBNP and BNP increased below a threshold eGFR of 90 mL/min/1.73 m2.Citation26 Spanaus et al have shown that natriuretic peptides increased in patients diagnosed with CKD independent from cardiac functions and such an increase was associated more with NT-proBNP.Citation27 Jacobs et al. in a prospective study including 44 hemodialysis (HD) patients found that extracellular water (ECW)/TBW ratio (reflecting overhydration) had a positive effect on BNP and NT-proBNP concentrations.Citation28 In another study by Booth et al, a strong association was found between NT-proBNP and the predialysis ratio of extracellular water/total body water.Citation29 Our study agrees with these previous reports by showing that NT-proBNP was significantly higher in the CKD patients with overhydration compared to patients without, and it was significantly positively correlated with OH/ECW (reflecting overhydration).
In conclusion, overhydration is more prevalent in patients with CKD Stage 5 than in patients with CKD Stages 3&4. Bioelectrical impedance analysis, IVC diameter, and NT-proBNP analysis in CKD are useful methods to determine volume overload. OH/ECW, a derived parameter of fluid load measured by BIA, was significantly correlated with SBP, DBP, IVC index, and NT-proBNP. Also, SBP, DBP, IVC index and NT-proBNP were significantly higher in CKD patients with overhydration compared to patients without.
Declaration of interest
The authors declare no conflicts of interest.
References
- Cheriex EC, Leunissen KM, Janssen JH, Mooy JM, van Hooff JP. Echography of the inferior vena cava is a simple and reliable tool for estimation of “dry weight” in hemodialysis patients. Nephrol Dial Transplant. 1989;4:563–568
- Vickery S, Price CP, John RI, et al. B-type natriuretic peptide (BNP) and amino-terminal proBNP in patients with CKD: relationship to renal function and left ventricular hypertrophy. Am J Kidney Dis. 2005;46(4):610–620
- Buchholz AC, Bartok C, Schoeller DA. The validity of bioelectrical impedance models in clinical populations. Nutr Clin Pract. 2004;19:433–446
- Kyle UG, Bosaeus I, De Lorenzo AD, et al. Bioelectrical impedance analysis, part II: utilization in clinical practice. Clin Nutr. 2004;23:1430–1453
- Levin NW, Zhu F, Seibert E, Ronco C, Kuhlmann MK. Use of segmental multifrequency bioimpedance spectroscopy in hemodialysis. Contrib Nephrol. 2005;149:162–167
- Caravaca F, Martínez del Viejo C, Villa J, Martínez Gallardo R, Ferreira F. Hydration status assessment by multi-frequency bioimpedance in patients with advanced chronic kidney disease. Nefrologia. 2011;31(5):537–544
- Levey AS, Coresh J, Greene T, et al. Using standardized serum creatinine values in the modification of diet in renal disease study equation for estimating glomerular filtration rate. Ann Intern Med. 2006;145:247–254
- National Kidney Foundation. K/DOQI clinical practice guidelines for chronic kidney disease: evaluation, classification, and stratification. Am J Kidney Dis. 2002;39(2 Suppl 1):S1–S266
- Devolder I, Verleysen A, Vijt D, Vanholder R, Van Biesen W. Body composition, hydration, and related parameters in hemodialysis versus peritoneal dialysis patients. Perit Dial Int. 2010;30(2):208–214
- Wizemann V, Wabel P, Chamney P, et al. The mortality risk of overhydration in hemodialysis patients. Nephrol Dial Transplant. 2009;24(5):1574–1579
- Earthman C, Traughber D, Dobratz J, Howell W. Bioimpedance spectroscopy for clinical assessment of fluid distribution and body cell mass. Nutr Clin Pract. 2007;22(4):389–405
- Essig M, Escoubet B, de Zuttere D, et al. Cardiovascular remodelling and extracellular fluid excess in early stages of chronic kidney disease. Nephrol Dial Transplant. 2008;23(1):239–248
- Passauer J, Petrov H, Schleser A, Leicht J, Pucalka K. Evaluation of clinical dry weight assessment in hemodialysis patients using bioimpedance specctroscopy: a cross-sectional study. Nephrol Dial Transplant. 2010;25(2):545–551
- Lopot F, Nejedlý B, Novotná H, Macková M, Sulková S. Age-related extracellular to total body water volume ratio (Ecv/TBW) – can it be used for “dry weight” determination in dialysis patients? Application of multifrequency bioimpedance measurement. Int J Artif Organs. 2002;25(8):762–769
- Dumler F, Kilates C. Prospective nutritional surveillance using bioelectrical impedance in chronic kidney disease patients. J Ren Nutr. 2005;15(1):148–151
- Cader RA, Gafor HA, Mohd R, et al. Assessment of fluid status in CAPD patients using the body composition monitor. J Clin Nurs. 2013;22(5–6):741–748
- Wabel P, Moissl U, Chamney P, et al. Towards improved cardiovascular management: the necessity of combining blood pressure and fluid overload. Nephrol Dial Transplant. 2008;23(9):2965–2971
- Ridao N, Luño J, García de Vinuesa S, Gómez F, Tejedor A, Valderrábano F. Prevalence of hypertension in renal disease. Nephrol Dial Transplant. 2001;16(Suppl 1):70–73
- Alvarez-Lara MA, Martín-Malo A, Espinosa M, Rodríguez-Benot A, Aljama P. Blood pressure and body water distribution in chronic renal failure. Nephrol Dial Transplant. 2001;16(Suppl 1):94–97
- Celik G, Kara I, Yilmaz M, Apiliogullari S. The relationship between bioimpedance analysis, hemodynamic parameters of hemodialysis, biochemical parameters and dry weight. J Int Med Res. 2011;39(6):2421–2428
- Oe B, de Fijter CW, Geers TB, Vos PF, Donker AJ, de Vries PM. Diameter of inferior caval vein and impedance analysis for assessment of hydration status in peritoneal dialysis. Artif Organs. 2000;24(7):575–577
- London GM. Alterations of arterial function in end-stage renal disease. Nephron. 2000;84(2):111–118
- Tagore R, Ling LH, Yang H, Daw HY, Chan YH, Sethi SK. Natriuretic peptides in chronic kidney disease. Clin J Am Soc Nephrol. 2008;3(6):1644–1651
- Carr SJ, Bavanandan S, Fentum B, Ng L. Prognostic potential of brain natriuretic peptide (BNP) in predialysis chronic kidney disease patients. Clin Sci (Lond). 2005;109(1):75–82
- van Kimmenade RR, Januzzi JL Jr, Bakker JA, et al. Renal clearance of B-type natriuretic peptide and amino terminal pro-B-type natriuretic peptide a mechanistic study in hypertensive subjects. J Am Coll Cardiol. 2009;53(10):884–890
- Das SR, Abdullah SM, Leonard D, et al. Association between renal function and circulating levels of natriuretic peptides (from the Dallas Heart Study). Am J Cardiol. 2008;102(10):1394–1398
- Spanaus KS, Kronenberg F, Ritz E, et al. Mild-to-Moderate Kidney Disease Study Group. B-type natriuretic peptide concentrations predict the progression of nondiabetic chronic kidney disease: the Mild-to-Moderate Kidney Disease Study. Clin Chem. 2007;53(7):1264–1272
- Jacobs LH, van de Kerkhof JJ, Mingels AM, et al. Inflammation, overhydration and cardiac biomarkers in hemodialysis patients: a longitudinal study. Nephrol Dial Transplant. 2010;25(1):243–248
- Booth J, Pinney J, Davenport A. N-terminal proBNP–marker of cardiac dysfunction, fluid overload, or malnutrition in hemodialysis patients? Clin J Am Soc Nephrol. 2010;5(6):1036–1040