
Abstract
Background: Original peritoneal equilibration test (PET) is an implementation that requires hard work for peritoneal dialysis (PD) staff. Therefore, several authors have attempted to validate short and fast PET protocols, with controversial results. The aim of this study was to evaluate the concordance between the mini-PET and original PET in children. Methods: In 26 stable continuous ambulatory PD patients, we performed an original PET with 2.27% (4 h) and a mini-PET with 3.86% glucose PD fluid (1 h) and compared ultrafiltration (UF) and small solute transports obtained with the two methods. Results: Twenty-six children, 14 males, mean age 11.4 ± 5.6 (range 2.5–19 years), were included. Meantime on PD at time of enrollment was 35.2 ± 24.5 months (range 6–84 months). Based on the 4-h creatinine D/P data, the number of the patients within each transport category was as follow: high, 5; average, 18; low, 3. Kappa test showed a significant concordance between original PET and mini-PET (k = 0.610). Based on the 4-h glucose D/D0 data, the number of the patients within each transport category was as follow: high, 5; average, 17; low, 4. Kappa test showed a moderate agreement between original PET and mini-PET (0.514, p = 0.000). When Pearson correlation analysis between original PET and mini-PET was performed, there were significant positive correlations between original 2.27% PET and mini-PET (r = 0.720, p = 0.000, r = 0.638, p = 0.000, respectively). When comparing the numeric results of mini-PET and 4 h of original PET for D/Creatinine, by simple regression analysis, we found statistically significant correlation among PETs. Conclusions: In this study, we showed concordance between the mini-PET and original PET. The 3.86% mini-PET is simple and fast methods to assess free water transport. This also gives information about total UF and small solute transports and it is in good agreement with the original PET.
Introduction
Different tests can be used to provide valuable information about the function of the peritoneal membrane. The most widely used peritoneal function test is the peritoneal equilibration test (PET), developed and described by Twardowski.Citation1 It is based on a dialysis dwell of 4 h using 1100 mL/m2 exchange with a 2.27–2.5% glucose-based dialysis solution; the preceding exchange is with a 1.36–1.5% glucose solution. It measures peritoneal solute transport and ultrafiltration (UF), and it gives the possibility to categorize patients (high, high-average, low-average and low transporters).Citation2–4 However, the time spent in the clinic by the patient to complete the 4-h original PET is long and requires many lab samplings. Many other tests have been tested the short and fast PET methods.Citation5–13
Recently developed test, mini-PET, is promising tools to assess free water transport (FWT).Citation6–9,Citation11 The mini-PET is performed with a 3.86% glucose-based solution, but the dwell time is only 1 h. More recently, D/P creatinine at mini-PET showed a relationship with D/Pcreatinine at 4 h 3.86% modified PET that was dependent on the actual value.Citation6,Citation7,Citation11
Most of the studies that short and fast PET protocols compared with original PET have been made in adult peritoneal dialysis (PD) patients.Citation6–10,Citation12,Citation13 The studies on this topic in children are limited number.Citation5,Citation11,Citation12 Peritoneal permeability has varies in children and adult due to differences in the effective surface area and the maturation of peritoneal membrane.Citation14,Citation15
In this study, the D/D0 glucose, D/Pcreatinine and UF results of mini-PET were compared with original PET in pediatric PD patients. Additional measurements obtained with mini-PET (FWT, D/PNa, DipNa and UF through the small pores (UFSP)) were also evaluated.
Patients
After having given their informed consent 26 children on PD (14 males, 12 girls; mean age 11.4 ± 5.6) were enrolled in the study. The duration of PD was 35.2 ± 24.5 (range 6–84 ) months. The patients were peritonitis free during the four weeks preceding the first test, during the tests. All patients used commercially available dialysis solutions (Eczacibasi-Baxter Healthcare, Istanbul, Turkey). No patient had any clinical sign of over hydration and or dehydration. This study was approved by ethics committee of the Erciyes University Medical Faculty, Kayseri.
Methods
A prospective protocol was applied at the Division of Pediatric Nephrology, Erciyes University, Kayseri, Turkey, between November 2011 and January 2012.
From the records of the study patients, we obtained demographic data, dialysis parameters (time on dialysis, previous peritonitis and hydration condition of patients), main comorbidities and drug therapies.
All patients were underwent an original PET (4 h), followed after 48 h by a mini-PET with 3.86% glucose PD fluid (1 h).
Original (4 h) PET
The abdomens of patients were drained completely for 20 min and then 1100 mL/m2 of 2.27% glucose dialysate was infused over 10 min. For the original PET, 10 mL of dialysate samples were drawn at times zeros, second and fourth hour, which entails the patient remaining in the hospital during the whole of this test. Glucose, urea, sodium and creatinine values of the dialysate were analyzed at each time point. A blood sample was drawn at the zero and fourth hour point to determine the glucose, sodium, urea and creatinine values. All serum and dialysate samples were centrally analyzed. After the fourth hour sample, effluent was drained completely for at least 20 min and its volume was measured, net ultrafiltration (netUF240) was calculated using the formula: Dialysate volume In–Dialysate volume Out (240 min). The dialysate to plasma (D/P) ratios for each solute at each sampling time were formed by using the average of the two corrected plasma concentrations in the denominator with the numerator consisting of the dialysate concentration. The D/P ratios for urea, creatinine and sodium, and the ratio of dialysate glucose to initial dialysate glucose concentration (D/D0) were calculated in the original manner.
Mini-PET
The 3.86% mini-PET was performed after 48 h from the original PET. In all the cases, the dwell before the mini-PET (the overnight dwell) was performed using a PD solution containing a glucose concentration of 3.86% with lactate as the buffer; the overnight solution was instilled at approximately 23:00 h in the evening before the test and was drained at about 07:00 h. After the overnight drain, a fresh 1100 mL/m2 3.86% glucose solution was infused in 10 min. The fresh PD fluid samples were taken from the bags at the end of the infusion. The first PD fluid sample was taken from the bag at the end of the infusion (20 mL, minute 1). After 1 h, another dialysate sample was obtained (20 mL, minute 60). Later, the dialysate was drained and collected by gravity for at least 20 min. The volume of the infused PD solution and the drained dialysate was measured by weighing the bags and then subtracting the weight of the empty bags. All samples obtained under noncompliance conditions were discarded. Blood samples were taken at the start of the test and 20 mL dialysate samples were taken after 1 and 60 min (D1′ and D60′). Plasma and dialysate Na, urea and creatinine (enzyme assay) was measured in each sample. Dialysate glucose was measured fresh 3.86% dialysis fluid and 60 min dialysate sample.
Calculations
The ratio of dialysate glucose concentrations (D/D0) was calculated dividing the dialysate glucose concentrations at the end of mini-PET (3.86% mini-PET) by that of the fresh PD solution. D/PCreatinine, D/Purea and D/PNa were calculated at the end of mini-PET; the plasma concentrations of creatinine, urea and sodium were considered.
Net UF60 was calculated as: Dialysate volume In–Dialysate volume Out (60 min).
Using formulas validated by La Milia et al.,Citation6 UFSP and FWT are calculated using the results of the 3.86% mini-PET.
Na sieving is considered as ΔDNa after 60 min of the test with the 3.86% solution, ΔDNa being the difference in Na concentration (mmol/L) between the “fresh” solution and the dialysate drained after 60 min.
The absolute dip of dialysate sodium concentration (DipNaD) during the mini-PET was calculated as
where Dialysate-In was the fresh PD solution.
The D/PNa was assessed at the start (D/PNa0) and at 60 min (D/PNa60) of the mini-PET. The D/PNa was also assessed at the start (D/PNa0) and at 240 min (D/PNa240) of the original PET.
The dip of D/PNa, during the mini-peritoneal equilibration test, was calculated as
DipD/PNa = D/PNa60 − D/PNa0, and during the original PET, was calculated as DipD/PNa = D/PNa240 − D/PNa0.
During the mini-PET, the FWT was calculated as follows:
During the mini-PET, UFSP is assessed using the Na clearance. UFSP was calculated as follows:
NaR (mmol) is the Na removed during the 3.86% mini-PET. NaR is calculated as follows:
[VolumeDialysateOut(L) • NaDialysateOut(mmol/L)] − [VolumeDialysateIn(L) • NaDialysateIn(mmol/L)]. We also calculated NaR for original PET at the end of 4 h.
Nap was the ionized sodium plasma water concentration assessed by direct ion selective electrode.
Abbreviations are: netUF, ultrafiltration rate at end of tests; Dialysate volume In, initial infused volume (1100 mL/m2); Dialysate volume Out, drained dialysate volume after 1 h or 4 h; UFSP, ultrafiltration across small pores; D/D0, ratio of dialysate glucose concentrations at end and at start of tests; NaP, plasma sodium concentration; NaDialysate In, sodium concentration at the start of the test in the fresh PD solution; NaDialysate Out, dialysate sodium concentration at the end of the test; D/P, dialysate-to-plasma ratio; DipNaD, difference of dialysate sodium concentration at end and at start of test; NaR, sodium removal during the tests.
Statistics
All tests were performed using SPSS for Windows 15.0. First, the distributions of all parameters were determined by using a Shapiro–Wilk test. The parameters with normal distribution were expressed as mean ± SD, and the parameters with abnormal distribution were expressed as median (minimum–maximum).
Comparisons of proportions were performed with a Pearson-chi-squared test. According to the mean values ±1 SD of D/D0 and D/PCreat, the patients were categorized as high (H), average (A) and low (L) peritoneal transporters. The concordance between the original PET (4-h D/Pcreat) and mini-PET as categorical variables were calculated with Kappa test (contingency table). Kappa values >0.80, 0.61–0.80 and 0.41–0.60 were considered to reflect very good, good and moderate agreement, respectively.
Pearson correlation analysis was used to investigate relationships between D/PCreatinine and D/D0 glucose, total UF, D/Purea, D/PNa, DipD/PNaD, DipD/PNa, NaR, FWT, UFSP of original 2.27%-PET (4 h) and 3.86%-mini-PET. Simple linear regression analysis was used to investigate possible relationships between peritoneal equilibrium tests. A p value < 0.05 was accepted as statistically significant. The linear correlation analysis was performed between FWT and Dip NaD, DPNa during the 3.86% mini-PET. The Bland–Altman analysis was also applied to evaluate the agreement between the PET techniques. A p value of <0.05 was considered significant.
Results
Twenty-six children, 14 males, mean age 11.4 ± 5.6 (range 2.5–19 years), were included. Meantime on PD at time of enrollment was 35.2 ± 24.5 months (range 6–84 months). At study entry, 73% of patients were on automated PD.
summarizes the mean values of the clinical indices, which were expressed as UF, UFSP, D/D0, D/PCreat, DipNaD, D/PNa, NaR and FWT, of 2.27% original-PET and the 3.86% mini-PET outcomes, together with the correlation coefficients between these indices and creatinine D/P, which represents the PET classification of the patients.
Table 1. Peritoneal transport characteristic from mini-PET (after 1 h of dwell time) and original PET (after 4-h dwell time), clinical data for 26 patients (mean ± SE) and their correlation with D/Pcreatinine.
Net ultrafiltration from mini-PET, netUF60, was, as expected, considerably higher than netUF240 from original-PET, and there was statistically significant correlation between netUF60 and creatinine D/P60 and such correlation was also observed for netUF240 and creatinine D/P 240 (). Creatinine D/P was also correlated with for D/P Na, D/P urea and D/D0 glucose after 1 h of mini-PET and 4 h of 2.27 PET.
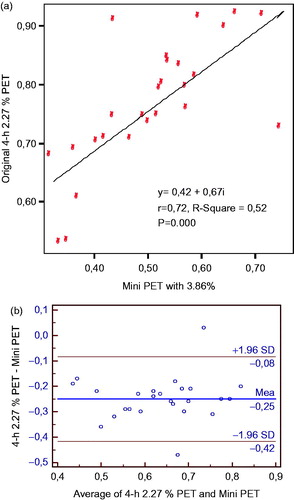
In and , we reported the patient distribution in groups of peritoneal transporters (low, average and high) categorized according to values of D/D0 and D/PCreat (as reported in ) during the original 2.27% PET, and mini-PET. Based on the 4-h creatinine D/P data, the number of the patients within each transport category was as follow: high, 5; average, 18; low, 3. Kappa test showed a significant concordance between original 2.27% PET and mini-PET (0.610, p = 0.000). Based on the 4-h glucose D/D0 data, the number of the patients within each transport category was as follow: high, 5; average, 17; low, 4. Kappa test showed a moderate agreement between original 2.27% PET and mini-PET (0.514, p = 0.000). When Pearson correlation analysis between original 2.27% PET and mini-PET was performed, there were significant positive correlations between original 2.27% PET and mini-PET, (r = 0.720, p = 0.000, r = 0.638, p = 0.000, respectively).
Table 2. Comparison of peritoneal transport groups categorized according to D/PCreat during both peritoneal equilibrium tests.
Table 3. Comparison of peritoneal transport groups categorized according to D/D0 glucose during both peritoneal equilibrium tests.
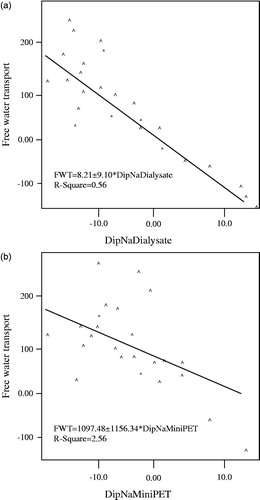
shows linear correlations of DipNa Dialysate and D/PNa with FWT. They clearly indicate that absolute DipNaD is better predictors of FWT than D/PNa (R2 of −0.56 and −0.26, respectively).
Figure 1. (a) The linear correlation of D/PCreatinin among the peritoneal equilibrium tests. (b) The linear correlation of D/PCreatinin among the peritoneal equilibrium tests by the Bland–Altman plot.
There are also significant positive correlations between mini-PET and original-PET in terms of D/PNa, DipNaD, DipD/PNa and Na sieving.
When comparing the numeric results of mini-PET and 4 h of PET for D/Creatinine, by simple regression analysis, we found statistically significant correlation among PETs (). Bland–Altman plots showed a high level of the agreement between the two PET techniques ().
Figure 2. The linear correlation between FWT and Dip NaDialysate, D/PNa during the 3.86% mini-PET.
Discussion
This study clearly showed that the results of mini-PET (1 hour) and original PET (4 h) provide identical characterization of peritoneal membrane transport capacity for the same solutes.
Original peritoneal equilibrium test is an implementation that requires hard work for PD staff. Therefore, several studies have been attempted to validate short and fast PET protocols, with controversial results.Citation5–13 In recent years, a short 2-h version of the original PET has been validated in pediatric clinical practice.Citation5,Citation12 However, although most centers use this test to prescribe PD therapy, morbidity and mortality secondary to cardiovascular disturbances remains the main complication in PD patients, and the best method to quantify UF capacity of the peritoneum has become a critical question. In the original paper, La Milia et al.Citation6 described the mini-PET, simple and fast methods to assess free water and small solute transport across the peritoneal membrane. In their study, a 3.86%, 4-h-long PET and a 3.86% 1-h-long mini-PET were performed to 52 stable PD patients. With the aim of assessing FWT and comparing the mini-PET with the 4-h 3.86% PET, these authors evaluated peritoneal transport characteristics of adult patients on chronic PD. They suggested that the mini-PET gives information about additional measurements, e.g. maximal UF capacity after 1 h, measures of Na sieving, FWT and UFSP, in comparison with 4-h 3.86% PET. This original paper on the mini-PET reported a good relationship with the 3.86% 4 h PET (modified PET) on the division of patients in transport categories.
We categorized the patients as high, average and low peritoneal transporters on the basis of the values of D/D0 and D/PCreat obtained during the original 2.27% PET and the 3.86% mini-PET. We found a good agreement of categorization of peritoneal transporters among the two peritoneal equilibration tests for both the two parameters. Also, the values of D/Pcreatinine, obtained during the 2.27% PET and the 3.86% mini-peritoneal equilibration test were good correlated.
Most of the studies on mini-PET were compared with the results of modified 3.86% PET.Citation4–6,Citation8 More recently, Galach et al.Citation16 published sequential peritoneal equilibration test that includes PET (glucose 2.27%, 4 h) followed by mini-PET (glucose 3.86%, 1 h) as a new method for assessment of peritoneal transport in adult CAPD patients. They compared with the three-pore model and sequential PET. They found that fluid transport parameters from the 3p model were independent of the PET D/Pcreatinine, but correlated with fluid transport characteristics from PET and mini-PET. In our study, data from mini-PET compared with original PET, and between the small solute transport and fluid transport characteristics were found significant correlations.
The studies on short and fast PET protocols, especially mini-PET, in children are limited number. More recently, Cano et al.Citation11 reported that the results of mini-PET in pediatric PD patients. This study was the first characterized FWT in PD children through the mini-PET. In this study, they found a significant correlation between left ventricular hypertrophy and FWT and suggested that FWT could be a useful tool to evaluate UF in PD children.
La milia et al. found a mean FWT value of 215 ± 86 mL, which shows a good correlation with total UF after the 4-h 3.86% PET. In their study, a significant inverse correlation between Dip Na and Dip D/PNa with FWT was found, concluding that absolute Dip NaD and Dip D/PNa were better predictors of FWT than was D/PNa. Cano et al.Citation11 found mean FWT was lower than in adults (133.9 ± 85.7 mL). DipD/PNa showed a negative correlation with FWT, with a lower value compared with adult patients.
In our study, same as report of Cano et al.,Citation11 mean FWT was lower than in adults (79.3 ± 15.6 mL). Dip D/PNa, DipNaD and D/PNa showed a negative correlation with FWT, with a lower value compared with adult patients, and FWT also showed a good correlation with net UF60 and UF240.
Our study is the first comparing the outcomes of mini-PET and original PET in pediatric PD patients. We found a good correlation between two PET methods. As shown in the previous papers and our study, FWT, DipNa D/P, NaD/P and Dip NAD values obtained with mini-PET could be useful tool to information when analyzing UF and fluid overload in pediatric PD patients. These results indicate that the 3.86% mini-peritoneal equilibration test may be used instead of original (4 h) PET to evaluate peritoneal membrane transport capacity.
Conclusion
We think the 3.86% mini-peritoneal equilibration test is a simple and short way, gives information on total UF and small solute transport in good agreement to the 2.27% peritoneal equilibration test, lasting 4 h, which explains peritoneal characteristics in children on PD. On the other hand, there could be significant cost savings using the mini-PET because of the minimal staff involvement and decreased sample analysis as there will be no need for the patients to stay for the full four hours in the hospital. The mini-PET is easy to perform and to calculate and it corresponds with the standard PET. As a result it can be used to guide the PD prescription and monitor peritoneal transport with time. Further studies evaluating normal values of the different transports and net UF parameters obtained with this method are expected.
Declaration of interest
The authors report no conflicts of interest. The authors alone are responsible for the content and writing of the paper.
References
- Twardowski ZJ, Nolph KD, Khanna R, et al. Peritoneal equilibration test. Perit Dial Bull. 1987;7:138–147
- La Milia V. Peritoneal transport testing. J Nephrol. 2010;6:633–647
- Coester AM, Smit W, Struijk DG, Krediet RT. Peritoneal function in clinical practice: the importance of follow-up and its measurement in patients. Recommendations for patient information and measurement of peritoneal function. NDT Plus. 2009;2:104–110. doi:10.1093/ndtplus/sfn203
- van Biesen W, Heimburger O, Krediet R, et al. ERBP working group on peritoneal dialysis Evaluation of peritoneal membrane characteristics: clinical advice for prescription management by the ERBP working group. Nephrol Dial Transplant. 2010;7:2052–62. doi:10.1093/ndt/gfq100
- Bradley A. Warady and Janelle Jennings the short PET in pediatrics. Perit Dial Int. 2007;27:441–445
- La Milia V, Di Filippo S, Crepaldi M, et al. Mini-peritoneal equilibration test: a simple and fast method to assess free water and small solute transport across the peritoneal membrane. Kidney Int. 2005;68:840–846
- Cnossen TT, Smit W, Konings CJ, Kooman JP, Leunissen KM, Krediet RT. Quantification of free water transport during the peritoneal equilibration test. Perit Dial Int. 2009;5:523–527
- Waniewski J, Debowska M, Lindholm B. Ultrafiltration and absorption in evaluating aquaporin function from peritoneal transport of sodium. Perit Dial Int. 2007;6:687–690
- La Milia V, Limardo M, Virga G, et al. Simultaneous quantification of osmotic conductance to glucose and free water transport of peritoneal membrane. Kidney Int. 2007;72:643–650
- Twardowski ZJ, Prowant BF, Moore HL, et al. Short peritoneal equilibration test: impact of preceding dwell time. Adv Perit Dial. 2003;19:53–58
- Cano F, Rojo A, Azocar M, et al. The mini-PET in pediatric peritoneal dialysis: a useful tool to predict volume overload? Pediatr Nephrol. 2013;28:1121–1126. doi:10.1007/s00467-013-2447-2
- Cano F, Sanchez L, Rebori A, et al. The short peritoneal equilibration test in pediatric peritoneal dialysis. Pediatr Nephrol. 2010;25:2159–2164
- Kazancioglu R, Topcuoglu D, Kiricimli N, Cinkilic A, Celik H. Comparison of fast peritoneal equilibrium test with the standard method: a pilot study. J Ren Care. 2012;1:29–33
- Mendley SR, Majkowski NL. Peritoneal equilibration test results are different in infants, children, and adults. J Am Soc Nephrol. 1995;6:1309–1312
- Warady BA, Alexander SR, Hossli S, et al. Peritoneal membrane transport function in children receiving long-term dialysis. J Am Soc Nephrol. 1996;7:2385–2391
- Galach M, Antosiewicz S, Baczynski D, Wankowicz Z, Waniewski J. Sequential peritoneal equilibration test: a new method for assessment and modelling of peritoneal transport. Nephrol Dial Transplant. 2013;2:447–454. doi:10.1093/ndt/gfs592