
Abstract
Objective: The aim of this study was to evaluate the roles of podocalyxin (PCX) and connective tissue growth factor (CTGF) in spontaneously hypertensive rats. Methods: Spontaneously hypertensive rats (SHR) and normotensive control Wistar–Kyoto (WKY) rats were divided into groups referred to as SHR 12W, SHR 24W, WKY 12W and WKY 24W. Systolic blood pressure and 24-hour total uric protein were measured every two weeks in the respective groups. CTGF, PCX, alpha-smooth muscle actin (α-SMA) and collagen-III were evaluated via immunohistochemical staining. In addition, CTGF, PCX, and α-SMA gene expression levels were determined by analyzing mRNA levels. Results: More kidney lesions occurred alongside foot processes effacement in SHR 24W rats than in SHR 12W rats. In SHR 12W rats, blood pressure and 24-hour total uric protein level were elevated and continued to increase thereafter. In the SHR 12W and SHR 24W groups, the expression of CTGF, α-SMA and collagen-III was significantly increased. Immunohistochemical staining showed that PCX expression was significantly reduced in the SHR group and CTGF expression was increased. A significant decrease in PCX mRNA and an increase in CTGF mRNA were observed in SHR 24W rats relative to SHR 12W rats. Conclusion: Both the overexpression of CTGF and the loss of podocalyxin reflect renal damage in spontaneously hypertensive rats. CTGF and PCX may be involved in the mechanisms of podocyte injury and apoptosis induced by hypertension.
Introduction
The kidney has a precise and complex structure and plays an important role in the pathogenesis of hypertension. Hypertension is a major cause of end-stage renal disease through glomerulosclerosis, interstitial fibrosis and mesangial cell growth. Hypertension as a disease category is the second leading cause of ESRD following diabetes. A variety of mechanisms have been suggested to explain renal damage. Glomerular and tubular changes are the major pathological events that lead to renal insufficiency. The renin-angiotensin-aldosterone system (RAAS) and proteinuria play critical roles in the development of renal disease. Recent studiesCitation1,Citation2 showed increased serum and urine levels of CTGF in hypertensive nephrosclerosis and a significant association with glomerulosclerosis and interstitial fibrosis. Tubulointerstitial changes vary with the severity of renal development.
Podocyte injury likely plays a crucial role in the renal damage associated with hypertensive nephrosclerosis. A change in podocyte morphology often accompanies proteinuria. Other evidence indicates that podocyte depletion is a major pathomechanism mediating proteinuria and glomerulosclerosis. A few studies have explored the involvement of podocyte damage in experimental hypertensive glomerulopathy, and recently, sensitive markers for podocyte injury were identified. However, the underlying mechanism remains unclear despite the progress made by many studies in understanding renal damage induced by hypertension. In the present study, our aim was to investigate the expression of podocalyxin and CTGF in kidneys of a rat hypertensive model and to explore their mechanisms of action and significance in spontaneously hypertensive rats (SHR).
Materials and methods
Animals and study design
We maintained 20 12-week-old male SHR rats and 20 12-week-old normotensive control Wistar–Kyoto (WKY) rats in a temperature-controlled room that was set at 23°C and on a 12:12-h light–dark cycle. The animals were allowed unlimited access to chow and tap water. We randomly divided the rats into four groups: SHR 12W, SHR 24W, WKY 12W and WKY 24W. All animals were fed the same normal diet. WKY 12W and SHR 12W rats were sacrificed after 12 weeks, the rest of groups were sacrificed after 24 weeks.
Urinalysis and blood pressure measurements
The blood pressure of conscious rats was measured every 2 weeks using tail-cuff plethysmography (RBP-1 Non-Invasive Blood Pressure Analyzer, China–Japan Friendship Hospital). Mean blood pressure was monitored at night over 6 h in a conscious and unrestrained condition, and three measurements were averaged. Each rat was placed in a metabolic cage for a 24-hour urine collection for determining 24-hour uric total protein (UTP/24 h). Methods to detect by immune turbidimetric test. And blood samples also were obtained before death.
Immunohistochemistry
Kidney samples were fixed in 10% neutral formalin and embedded in paraffin, and then 3-µm-thick sections were cut, dewaxed in xylene, and dehydrated in alcohol. Staining using the SP method kit (Fuzhou Maixin Biotech. Co., Ltd., China) was manually performed according to the instructions. Sections were incubated twice in xylene for 5 min each, followed by dehydration using a gradient of histological grade ethanol for 5 min each, then rehydrated, and rinsed in phosphate-buffered saline (PBS). Slides were then incubated in 30% H2O2 for 10 min at room temperature and washed twice with distilled water and PBS. Rabbit serum (1:100 dilation, Santa Cruz Biotechnology, Santa Cruz, CA) was added for 15 min. Then excess serum was removed and goat anti-mouse CTFG antibody (Santa Cruz Biotechnology) or podocalyxin polyclonal antibody (Santa Cruz Biotechnology) were added, followed by incubation for 1 h at room temperature. After three washes with PBS for 3 min each, the secondary antibodies (1:10,000 dilution; Cell Signaling Technology, Danvers, MA) were added and incubated for 15 min at room temperature followed by three 3-min washes with PBS. The sections were incubated with anti α-SMA mouse monoclonal antibody (Santa Cruz Biotechnology, USA) at 4°C overnight, with the secondary antibody at room temperature for 30 min. Streptavidin–biotin complex staining was used to detect the expression of collagen-III. Semi-quantitative analysis was performed using an ultraviolet spectrophotometer. We selected 40 complete non-overlapping fields of view in the renal cortex and determined the optical density value for each sample separately. Positive cells were counted in 20 randomly selected cortical fields under a 20× objective.
Immunofluorescence
Rat kidneys were perfused with periodate-lysine-paraformaldehyde fixative buffered with 0.1 M phosphate buffer (pH 7.4) and immersed in the same fixative. The 5-µm-thick cryosections were prepared and incubated for 2 h at room temperature with primary antibodies (goat anti-mouse PCX antibody, diluted 1:50, Santa Cruz Biotechnology). Sections were then incubated with FITC-labeled secondary antibodies (diluted 1:100; Thermo Scientific, Waltham, MA) for 1 h at room temperature. All sections were examined with a confocal laser scanning microscope (Olympus Optical Co., Ltd).
Renal morphology
The portion of the kidney that was removed from each animal was fixed in 10% formalin in phosphate buffer (pH 7.4), and paraffin-embedded sections of the kidney were prepared, stained by the Periodic acid-Schiff method, and examined by light microscopy.
Electron microscopy
Small pieces of the cortex were fixed in 1.5% glutaraldehyde and 1% paraformaldehyde for 24 h and then stored in 0.1 M cacodylate buffer with 6% sucrose. After postfixation in 1% reduced osmium in 0.1 M cacodylate buffer, the samples were dehydrated and embedded in EPON. Ultrathin sections were contrasted with uranyl acetate and lead citrate and were examined with a JEOL JEM-1011 electron microscope.
RT-PCR
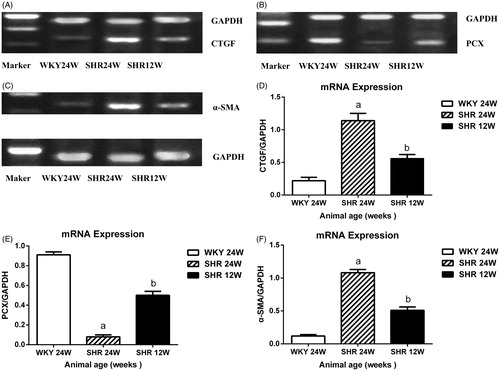
Total RNA was exacted from frozen kidney tissue using Trizol reagent according to the manufacturer’s protocol, converted into cDNA, and subjected to quantitative reverse transcriptase polymerase chain reaction (RT-PCR). The primers and probes were synthesized by Invitrogen, Carlsbad, CA. The primer sequences and sizes of the expected PCR products were as follows: CTGF, left 5′-CAA GGG TCT CTT CTG CGA CT-3′, right 3′-TTC TGT GTA AAC CGG GAC TG-5′, 239 bp; podocalyxin, left 5′-GCA TCA CTA CAT TGC CCC TCT C-3′, right 3′-CTA CCC TAC TGG ACT GTC TCC G-5′, 343 bp; and α-SMA, left 5′-CTC TTC CAG CCA TCT TTC ATT-3′, right 3′-AGG TAA CAG GTG GCG TTT ACG-5′, 342 bp. The control was GAPDH: left 5′-TCC CTC AAG ATT GTC AGC AA-3′, right; 5′-AGA TCC ACA ACG GAT ACA TT-3′, 448 bp. These primer pairs were obtained from Shanghai Shinegene Molecular Biotechnology Co., Ltd. PCR amplification was carried out with TaqDNA polymerase, and the amplified fragments were analyzed on a 1.5% agarose gel.
Statistical analysis
All data are expressed as mean ± standard deviation (SD). Statistical analyses were performed using SPSS 13.0 software (SPSS, Inc., Chicago, IL). For comparisons between more than two groups, statistical analysis is one-way analysis of variance (ANOVA) for normally distributed variables. A p value of <0.05 was considered statistically significant. Pearson’s rank-order correlation was applied to test associations between gene expression levels and clinical parameters.
Results
Baseline renal histological data
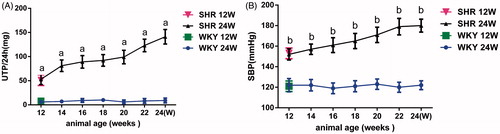
Proteinuria was increasingly evident in both groups of SHR rats in comparison with WKY rats of the same age (p < 0.01). The blood pressure of the SHR rats was significantly higher than that of WKY rats of the same age (p < 0.01). The increases in both indices were greater in the SHR 24W group than in the SHW 12W group. WKY rats remained free of proteinuria throughout the course of the study ().
Figure 1. Twenty-four hours urinary total protein excretion (A) and blood pressure (B) in WKY and SHR rats. Notes: At 12 weeks of age, the blood pressure and proteinuria of SHR rats was significantly higher than that of WKY rats, ap < 0.01, bp < 0.01 versus age-matched WKY rats.
Immunohistochemical analysis
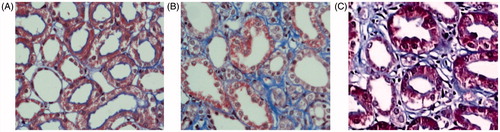
Immunohistochemical analysis showed a significant increase in CTGF and α-SMA expression as well as collagen-III expression in tubular epithelial cells and mesangial cells and interstitially in the SHR12W group compared to the WKY group, and more kidney lesions were found in the SHR 24W group. There was almost no expression of α-SMA or collagen-III in the WKY rats. The optical density values corresponding to the four indices showed significant differences among the three groups ( and ).
Figure 2. Immunohistochemical staining for CTGF, α-SMA, Collagen-III and PCX in SHR and WKY glomerular. Immunocytochemistry of CTGF (A), α-SMA (B), Collagen-III (C), PCX (D) in kidney.
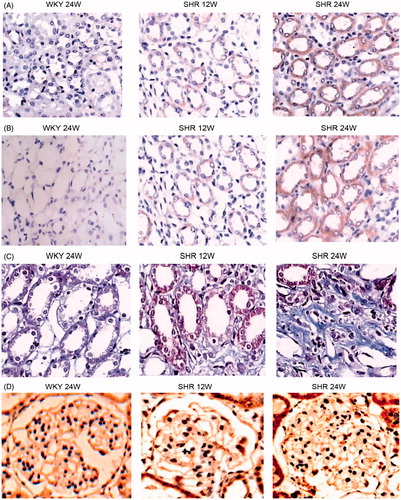
Table 1. OD value of CTGF, PCX, α-SMA and Collagen-III in SHR and WKY rats ().
Immunofluorescence analysis
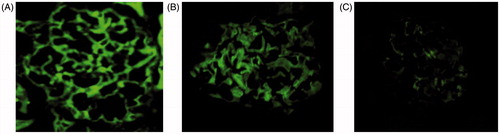
A bright fluorescent signal indicating CTGF and podocalyxin expression was seen in WKY rats (). Less intense fluorescence was seen in SHR 12W rats (), and markedly reduced but still positive fluorescence was seen in the SHR 24W rats ().
Figure 3. Indirect immunofluorescence of mouse renal cortex cryostat sections. Notes: The photomicrographs are developed to the same intensity of signal. ×400. (A) WKY 24W; (B) SHR 12W; (C) SHR 24W.
Renal structure at the microscopic level
shows typical light micrographs of renal and glomerular sections stained using the Periodic Acid–Schiff technique. Glomerular morphology was grossly normal in WKY rats at 24 weeks (). However, SHR rats at 12 weeks exhibited moderate focal-segmental or global glomerulosclerosis, together with arteriosclerosis, and tubular cast formation (). In addition, SHR 24W rats showed severe lesions (). As shown in , glomerular segmental sclerosis and tubulointerstitial injury (i.e., tubular dilation, atrophy of tubular epithelial cells, increased mesangial matrix, fibrosis, and infiltration of inflammatory cells) were observed in SHR 12W rats (). These conditions have continued to progress in SHR 24W rats (). No such effect was noted in WKY rats.
Figure 4. The alteration of renal structure. Note: PAS × 400. (A) WKY 24W, (B) SHR 12W, (C) SHR 24W.
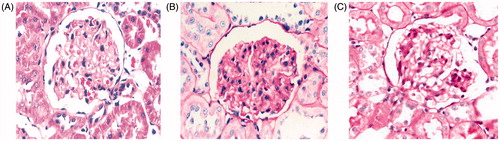
Figure 5. Tubular and interstitial lesions in kidney using Masson’s trichrome stain. Note: ×400 (A) WKY 24W, (B) SHR 12W, (C) SHR 24W.
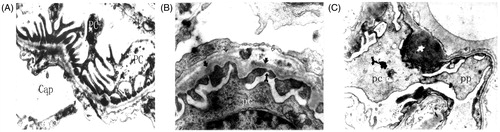
Ultrastructural analysis of podocytes
Electron microscopy showed that normal glomerular ultrastructure and morphology were generally observed in the WKY rats (). In SHR 12W rats (), subtle coarsening of the foot process was occasionally seen, together with protein droplets in the podocyte cell bodies and major processes. Major processes were blunted and widened in SHR 12W rats, and the foot processes appeared shortened and thickened in SHR 12W rats in contrast to their usual thin morphology. Even fingerlike processes were seen in SHR 24W rats ().
Figure 6. Ultrastructure analysis of podocytes. Notes: Electron microscopy×10,000 Podocyte foot processes were already effaced in some glomeruli in SHR rats. (A) WKY 24W, (B) SHR 12W, (C) SHR 24W.
mRNA expression
The gene expression levels of CTGF and α-SMA were markedly higher in the SHR 24W and SHR 12W groups than in WKY rats (). In contrast, PCX gene expression was lower in both groups (). The CTGF and α-SMA mRNA levels were significantly greater in SHR 24W rats compared with SHR 12W rats (), mirroring the decreased PCX protein expression in SHR 24W rats compared with SHR 12W rats (). A significant positive association was found among CTGF and α-SMA gene expression and UTP/24 h levels, but PCX gene expression was significantly negatively associated with CTGF and α-SMA gene expression and UTP/24 h in SHR rats (CTGF mRNA vs. α-SMA mRNA: r = 0.827, p < 0.01; PCX mRNA vs. CTGF mRNA: r = −0.854, p < 0.01; PCX mRNA vs. α-SMA mRNA: r = −0.739, p < 0.01; CTGF mRNA vs. UTP/24 h: r = 0.613, p < 0.01; PCX mRNA vs. UTP/24 h: r = −0.587, p < 0.01).
Figure 7. Genes expression in the glomeruli. Notes: RT-PCR analysis of the CTGF (A) PCX (B) α-SMA (C) Quantitative analysis of CTGF (D) and PCX (E) and α-SMA (F) ap < 0.01, bp < 0.01.
Discussion
Hypertensive glomerular lesions are conventionally characterized by mesangial proliferation, matrix accumulation, and glomerulosclerosis.Citation3 The present study demonstrates that hypertension induced podocyte damage and proteinuria. CTGF, a regulator and member of the CCN (Cyr61/CCN2/Nov) family that includes four domain areas, is implicated to be important in fibrosis through extracellular matrix (ECM) induction and an important downstream mediator in the fibrotic action of transforming growth factor. Terada et al.Citation4 demonstrated that aldosterone promotes the expression and activity of CTGF by stimulating its transcription through activating serum as well as glucocorticoid-inducible protein kinase-1 and nuclear factor-kappa B. De las Heras et al.Citation5 reported that vascular and renal damage is associated with stimulation of the CTGF gene and protein content and considered that CTGF may be a downstream mediator of angiotensin II (Ang II) in hypertensive renal damage. In this study, we found that the signals from CTGF and α-SMA proteins and genes are widely distributed in tubular epithelial cells and mesangial cells as well as interstitially with mesangial hypertrophy, widening and expansion. Afferent artery walls and basement membrane showed thickening and tubular twisting as well as ECM deposition. Our findings are consistent with those of the aforementioned studies. Microalbuminuria is an independent early signal of hypertensive renal damage and has toxic effects on the kidneys. Microalbuminuria is both the reason for and the result for renal injury.
Podocytes are characterized by their special structure and function. Podocytes line the outer aspect of the basement membrane and serve as the final defense against urinary protein loss in the normal glomerulus. Many structural changes in podocytes that have been observed in hypertensive glomerulopathy are shared with other chronic nephropathies (e.g., diabetic nephropathy, diabetic nephropathy, focal segmental glomerulosclerosisfocal, and immune factors). Podocytes oppose the high intraglomerular hydrostatic pressure by forming a molecular sieve to maintain kidney filtration. Thus, the interdigitating pattern of podocyte foot processes is the morphological basis for the high hydraulic conductivity of glomerular capillaries.Citation6 Because the wall tension generated by the hydraulic pressure in the glomerular capillaries is counterbalanced by podocytes, podocytes are invulnerable to stress injury. However, podocyte injury is an important factor for glomerulosclerosis and proteinuria.Citation7–10 Podocalyxin is an extensively O-glycosylated and sialylated type I transmembrane protein that is normally expressed in the apical surface of kidney podocytes. It is thought to play an important role in the maintenance of the podocyte structural integrity and morphogenesis. As a key protein of podocytes, podocalyxin plays an important role in renal injury in hypertension. Kai et al.Citation11 demonstrated that under normal conditions, PCX stains more intensely along glomerular epithelial cells, whereas with acute hypertension, PCX staining is unclear with a disarranged distribution. They also reported that the mRNA levels were significantly decreased. Kretzler et al.Citation12 revealed that podocytes appeared to not be able to adapt to cover the increased area of tufted surfaces and developed severe lesions in cell architecture, leading to denudation of glomerular basement membrane (GBM) areas in chronic uninephrectomy-desoxycorticosterone-trimethylacetate hypertensive rats. Naked GBM showed hyalinosis thrombosis and synechia formation, and this damage would attribute to podocyte failure.
In the present study, we found that the glomerulus showed a decrease in volume, thickening and stenosis of the afferent artery wall, and renal interstitial congestion. The ultrastructure of the podocytes showed local pathological changes involving podocyte swelling and loss, and the foot processes showed widening, retraction, fusion, or even disappearance, leaving the GBM exposed to be infiltrated by inflammatory cells. Our findings are consistent with those of previous studies.Citation13,Citation14
Ang II is thought to be a key factor in hypertension.Citation15 Ang II contributes to renal injury through hemodynamic factors as well as non-hemodynamic factors. One study showed that podocytes express mRNA for angiotensinogen, renin, angiotensin-converting-enzyme, and Ang II receptors.Citation16 The renin-angiotensin system (RAS) mediates podocyte function through physiological and pathological processes. Podocytes, for which the foot processes overlay on the glomerular capillary tufts, are known to be quite sensitive to mechanical stress.Citation17 Ang II production has been shown to occur when podocytes are exposed to mechanical strain.Citation18 This suggests that Ang II may induce changes in nephrin expression and podocyte apoptosis in Ang II-infused rats.Citation19 Podocyte damage is likely an important factor contributing to the impairment of endothelial and mesangial cells and further proteinuria and glomerulosclerosis.Citation20
Based on these findings, we propose the following mechanisms of action for the effects of CTFG and podocalyxin in hypertensive rats: (1) under normal conditions, CTGF is present in podocytes and parietal epithelial cells but not in mesangial cells.Citation21 The present data showed that unlike that in the WKY groups, CTGF was expressed at high levels in glomerular epithelial cells, tubular epithelial cells, and interstitial areas. Such differences could be explained by strong interaction between podocytes (podocalyxin) and CTGF. (2) CTGF mainly plays a role in excess extracellular matrix deposition and glomerulosclerosis.Citation22 Upregulation of CTGF would lead to hypertension-induced podocyte damage.Citation23 It has been suggested that the expression of α-SMA by tubular cells and podocytes represents their transdifferentiation into a fibroblastic lineage, and thus, these cells could contribute to interstitial fibrosis. It is well known that most published research has paid close attention to the transdifferentiation of tubular epithelial cells but often disregarded podocytes and tubular epithelial cells. Both podocyte and tubular epithelial cell lines are derived from the mesenchyme of the mesoderm, and thus, we can speculate that these cells can undergo epithelial–mesenchymal transition (EMT) in pathological states.Citation24 Actually, podocytes do show EMT and lose their specific markers. Kimura et al.Citation25 found that glomerular expression of α-SMA was enhanced in kidneys of SHR, and the enhancement was significantly inhibited by treatment with anti-hypertensive agents. Le Jemtel et al.Citation26 also reported that a higher amount of α-SMA mRNA was found in the aorta of SHR. The interstitial space is very sparse and not detectable, and the expression of α-SMA is exclusively confined in the intrarenal arteries in WKY groups.Citation27 It is possible that tubular epithelial cells, mesangial cells, and interstitial cells can transform into myofibroblasts, and these changes reflect dedifferentiation of renal tissue during the injury/repair process (hypertensive). The present results showing enhanced expression of CTGF, α-SMA, and collagen-III in the kidney with glomerular sclerosis and interstitial fibrosis, predicts a disrupted interaction between podocytes and CTGF. This process causes morphological changes in podocytes in hypertension.Citation28 (3) Podocytes, which are subjected to increased mechanical forces because of intraglomerular hypertension, hyperfiltration, or hypertrophy, may cause foot process effacement, podocyte hypertrophy, EMT, and detachment or apoptosis. Podocytes express both type 1 and type 2 AT receptors and play important roles in the progression of chronic kidney disease, which results from the local activation of RAS.Citation29 The activation of a local tissue angiotensin system leads to an increase in podocyte apoptosis, mainly in an AT1R-mediated fashion. Inhibition of RAS attenuates the progression of apoptosis of podocytes.Citation30 Our studies demonstrate not only pathological changes in the kidney but also alterations to podocytes (e.g., foot process effacement, widening, or even disappearing; cell hypertrophy; morphologic flattening; and reduction in podocyte number),Citation31 which indicate on one hand that Ang II altered the glomerular hemodynamics and that the Ca2+ concentration was increased through mechanical strain. These changes cause podocyte structure injury. On the other hand, injury of the glomerular filtration membrane barrier, as a result of an increase in inflammatory cells, cytokines, and vasoactive substances, is thought to be due to alteration of podocytes and podocalyxin expression.
Conclusion
Our findings indicate a potential role of early podocalyxin injury in the pathogenesis of proteinuria. We suggest that a reduction in the number of podocytes may be mediated, at least in part, via CTGF. Our results indicate that podocyte injury plays an important role in the pathogenesis of renal damage in hypertension and implicates podocytes as an important therapeutic target in hypertensive renal disease. We hypothesized that the changes in expression represent a compensatory reaction of podocytes to damage.
Declaration of interest
This work was supported by the National Natural Science Foundation of Hubei Province (Grant No. 2011CDB499 and a Program for Science and Technology Development Grant No. 2007AA301B35-4).
Acknowledgments
The authors would like to thank the Department of the Laboratory of Pathophysiology, Wuhan University, for technical help.
References
- de Las HN, Ruiz-Ortega M, Ruperez M, et al. Role of connective tissue growth factor in vascular and renal damage associated with hypertension in rats. Interactions with angiotensin II. J Renin Angiotensin Aldosterone Syst. 2006;7(4):192–200
- Rodriguez-Iturbe B. Arteriolar remodeling in essential hypertension: Are connective tissue growth factor and transforming growth factor involved?. Kidney Int. 2006;69(7):1104–1105
- Diamond JR, Karnovsky MJ. Focal and segmental glomerulosclerosis: Analogies to atherosclerosis. Kidney Int. 1988;33(5):917–924
- Terada Y, Ueda S, Hamada K, et al. Aldosterone stimulates nuclear factor-kappa B activity and transcription of intercellular adhesion molecule-1 and connective tissue growth factor in rat mesangial cells via serum- and glucocorticoid-inducible protein kinase-1. Clin Exp Nephrol. 2012;16(1):81–88
- de Las HN, Ruiz-Ortega M, Ruperez M, et al. Role of connective tissue growth factor in vascular and renal damage associated with hypertension in rats. Interactions with angiotensin II. J Renin Angiotensin Aldosterone Syst. 2006;7(4):192–200
- Endlich N, Endlich K. Stretch, tension and adhesion – Adaptive mechanisms of the actin cytoskeleton in podocytes. Eur J Cell Biol. 2006;85(3–4):229–234
- Li Y, Kang YS, Dai C, et al. Epithelial-to-mesenchymal transition is a potential pathway leading to podocyte dysfunction and proteinuria. Am J Pathol. 2008;172(2):299–308
- Barisoni L. Podocyte biology in segmental sclerosis and progressive glomerular injury. Adv Chronic Kidney Dis. 2012;19(2):76–83
- Reiser J, Sever S. Podocyte biology and pathogenesis of kidney disease. Annu Rev Med. 2013;64:357–366
- Kriz W, Lehir M. Pathways to nephron loss starting from glomerular diseases-insights from animal models. Kidney Int. 2005;67(2):404–419
- Li K, Wang J, Yin X, et al. Alteration of podocyte protein expression and localization in the early stage of various hemodynamic conditions. Int J Mol Sci. 2013;14(3):5998–6011
- Kretzler M, Koeppen-Hagemann I, Kriz W. Podocyte damage is a critical step in the development of glomerulosclerosis in the uninephrectomised-desoxycorticosterone hypertensive rat. Virchows Arch. 1994;425(2):181–193
- Kirsch T, Kaufeld J, Korstanje R, et al. Knockdown of the hypertension-associated gene NOSTRIN alters glomerular barrier function in zebrafish (Danio rerio). Hypertension. 2013;62(4):726–730
- Berman S, Abu HR, Efrati S. Mesangial cells are responsible for orchestrating the renal podocytes injury in the context of malignant hypertension. Nephrology (Carlton). 2013;18(4):292–298
- Lewis EJ, Hunsicker LG, Bain RP, et al. The effect of angiotensin-converting-enzyme inhibition on diabetic nephropathy. The Collaborative Study Group. N Engl J Med. 1993;329(20):1456–1462
- Liebau MC, Lang D, Bohm J, et al. Functional expression of the renin-angiotensin system in human podocytes. Am J Physiol Renal Physiol. 2006;290(3):F710–F719
- Nagase M, Shibata S, Yoshida S, et al. Podocyte injury underlies the glomerulopathy of Dahl salt-hypertensive rats and is reversed by aldosterone blocker. Hypertension. 2006;47(6):1084–1093
- Durvasula RV, Petermann AT, Hiromura K, et al. Activation of a local tissue angiotensin system in podocytes by mechanical strain. Kidney Int. 2004;65(1):30–39
- Jia J, Ding G, Zhu J, et al. Angiotensin II infusion induces nephrin expression changes and podocyte apoptosis. Am J Nephrol. 2008;28(3):500–507
- Patrakka J, Tryggvason K. New insights into the role of podocytes in proteinuria. Nat Rev Nephrol. 2009;5(8):463–468
- Roestenberg P, van Nieuwenhoven FA, Joles JA, et al. Temporal expression profile and distribution pattern indicate a role of connective tissue growth factor (CTGF/CCN-2) in diabetic nephropathy in mice. Am J Physiol Renal Physiol. 2006;290(6):F1344–F1354
- Forbes JM, Fukami K, Cooper ME. Diabetic nephropathy: Where hemodynamics meets metabolism. Exp Clin Endocrinol Diabetes. 2007;115(2):69–84
- Yokoi H, Mukoyama M, Mori K, et al. Overexpression of connective tissue growth factor in podocytes worsens diabetic nephropathy in mice. Kidney Int. 2008;73(4):446–455
- Li JJ, Kwak SJ, Jung DS, et al. Podocyte biology in diabetic nephropathy. Kidney Int Suppl. 2007;106:S36–S42
- Kimura K, Suzuki N, Ohba S, et al. Hypertensive glomerular damage as revealed by the expression of alpha-smooth muscle actin and non-muscle myosin. Kidney Int Suppl. 1996;55:S169–S172
- Le Jemtel TH, Lambert F, Levitsky DO, et al. Age-related changes in sarcoplasmic reticulum Ca(2+)-ATPase and alpha-smooth muscle actin gene expression in aortas of normotensive and spontaneously hypertensive rats. Circ Res. 1993;72(2):341–348
- Liu X, Lu L, Tao BB, et al. Amelioration of glomerulosclerosis with all-trans retinoic acid is linked to decreased plasminogen activator inhibitor-1 and alpha-smooth muscle actin. Acta Pharmacol Sin. 2011;32(1):70–78
- Dai HY, Zheng M, Lv LL, et al. The roles of connective tissue growth factor and integrin-linked kinase in high glucose-induced phenotypic alterations of podocytes. J Cell Biochem. 2012;113(1):293–301
- Tuncdemir M, Ozturk M. The effects of angiotensin-II receptor blockers on podocyte damage and glomerular apoptosis in a rat model of experimental streptozotocin-induced diabetic nephropathy. Acta Histochem. 2011;113(8):826–832
- Ding G, Reddy K, Kapasi AA, et al. Angiotensin II induces apoptosis in rat glomerular epithelial cells. Am J Physiol Renal Physiol. 2002;283(1):F173–F180
- Barisoni L, Schnaper HW, Kopp JB. Advances in the biology and genetics of the podocytopathies: Implications for diagnosis and therapy. Arch Pathol Lab Med. 2009;133(2):201–216