
Abstract
Objective: To investigate the effect of urokinase-type plasminogen activator (uPA) on mesangial matrix in the kidney of diabetic rats and its related mechanisms. Methods: Diabetic Sprague-Dawley (SD) rats induced by intraperitoneal injection of streptozotocin (STZ) were randomly and evenly divided into two groups: DM + vehicle, and DM + uPA (2500 U kg−1 uPA via tail vein once a day for four weeks). The normal SD rats without diabetes were considered as control group. Rats in the three groups were executed and the heart blood was sampled for determination of blood glucose and serum creatinine. Meanwhile, kidney tissues of rats were also harvest for measurement of glomerular area, volume, and mesangial area by periodic acid silver methenamine (PASA) staining. The expression of urokinase-type plasminogen activator receptor (uPAR), plasminogen activator inhibitor-1 (PAI-1), and collagen IV in renal tissues was tested with immunohistochemistry. Results: Compared with control, the DM rats had obvious albuminuria, significantly (p < 0.01) increased glomerular volume and mesangial matrix area, and significantly (p < 0.05) higher expression of uPAR, PAI-1 and collagen IV in mesangial matrix, significantly up-regulated (p < 0.05) glomerular uPAR, PAI-1, and collagen IV expression. After treated with uPA, the diabetic rats had significantly (p < 0.05) reduced albuminuria, significantly (p < 0.01) improved glomerular volume and mesangial matrix, significantly (p < 0.05) down-regulated PAI-1 and collagen IV expression in mesangial matrix. However, the uPAR expression in renal tissues were unchangeable (p > 0.05) and PAI-1 and collagen IV expression were significantly (p < 0.05) reduced when diabetic rats were treated with uPA. Conclusion: uPA can down-regulate glomerular PAI-1 expression in the DM rats but not significantly influence uPAR expression, suggesting that uPA might regulate the mesangial cell (MC) and its matrix expression and improve diseased diabetic mesangial matrix via its combination with uPAR to uptake PAI-1 and accelerate its degradation.
Introduction
The high plasminogen activator inhibitor 1 (PAI-1) expression in mesangial cells (MC) can result in mesangial matrix accumulation, which is one of principle pathophysiological mechanisms. As the most important PAI, PAI-1 can inhibit activity of tissue type PA (tPA) and urokinase type PA (uPA). It also can activate mitogen-activated protein kinase (MAPK) signaling pathway in MC, stimulate expressions of transforming growth factor β1 (TGF-β1), and hence promote the synthesis of mesangial matrix.Citation1–3 The synthesis of PAI-1 can be regulated by many factors. However, only one factor can mediate the PAI-1 degradation. The PAI-1 has to be bound to uPAR in cell membrane to form a low-density lipoprotein receptor (LRP) uPA-uPAR-PAI-1 complex, to remove it through an endocytic pathway. However, it is not clear if this mechanism can be used to remove PAI-1 in diabetic rats. We have previously demonstrated that uPA suppression cell proliferation and phenotypic transformation of MCs induced by high glucose through inhibiting Akt signaling pathway and uPA affected uPAR, PAI-1, and collagen IV expression in diabetic rat renal tissues.Citation1 But meaning of the change in rat renal was not studied before. Therefore, in this study, we investigated whether PAI-1 could be removed and the glomerular mesenteric damage could be partly protected in exogenous uPA-treated Kidney.
Materials and methods
Diabetic rat models
Thirty Sprague-Dawley (SD) rats (male, 150–200 g, specific pathogen free) were provided by Laboratory Animal Center, Wuhan University, China. The left kidney of all rats was removed under intraperitoneal anesthesia. After 6 days, ten rats were randomly selected as control group and the other twenty rats which were intraperitoneal injected by 35 mg kg−1 streptozotocin (STZ Sigma Corporation, St. Louis, MO). After 72 h, the fasting blood glucose in the twenty rats was detected. The rat with the fasting blood glucose ≥16.7 mmol L−1 was considered as a successful diabetic rat model. In our studies, all of the twenty rats were successfully made into diabetes models. In nine weeks after diabetic rat models were constructed, ten of the diabetic rats were randomly selected as DM group. The other ten rats were injected uPA (Livzon Pharmaceutical Group Inc., Guangdong, China) through tail veins, 2500 U kg−1 a day for four weeks. Before injection of each day, tail vein blood of rats in the three groups was sampled and detected for its activated coagulation time (ACT). If ACT value was three times larger than the normal value, the uPA injection was stopped for one day. During the whole experiment period, all the rats were fed freely.
Blood and kidney sampling
At the end of four weeks after diabetic rats were expose to uPA, the 24 h urine samples were taken from rats in the three groups for detection of urine protein by sulfosalicylic acid precipitate turbidimetry. At 29 d, rats were anesthetized by 2% pentobarbital sodium to take their heart blood samples. The blood serum was separated from the heart blood for determination of its blood glucose and serum creatinine on a Biochemical Analyzer (Beckman, provided by our inspection center). Meanwhile, the right kidneys of rats were taken, lavaged in phosphate buffer at 4 °C, and weighed. The mean kidney weight was divided by its body weight, yielding a ratio of kidney weight/body weight. The two ends of kidney was fixed in 4% paraformaldehyde and embedded by paraffin wax for pathological analysis of rat glomeruli and immunohistochemistry (IHC) analysis of uPAR, PAI-1, and collagen IV expression in rat rental tissue. The remaining kidney was kept in a refrigerator at −70 °C for western blotting test for uPAR, PAI-1, and collagen IV expression in rat rental tissues.
Pathological analysis of rat glomeruli
At high magnification (400×), thirty glomeruli were randomly selected from Periodic Acid-Silver Methenamine (PASM) staining sections and glomerular mean areas (AG), mean volume (VG), and mesangial areas (AM) were determined by a pathology imaging analysis system software (Beijing University of Aeronautics, Beijing, China).
IHC analysis of uPAR, PAI-1, and collagen IV expression in renal tissue
Four-μm-thick sections, sliced from wax packed specimens, were routinely dewaxed into solution, blocked with 3% H2O2 methanol endogenous peroxidases, incubated with mouse antirat uPAR monoclonal antibody (1:50), rabbit antirat PAI-1 multiclonal antibody (1:100), and rabbit antirat collagen IV multiclonal antibody (1:100) at 4 °C overnight, incubated with secondary antibodies (1:200) (Boster Company) at room temperature for 30 min, colorized with DAB, recolonized with hematoxylin, and dried. Under a microscope, renal tissue change was observed. The renal tissue that had brown particles or linear sediments in its cytoplasm or cell membrane was considered to be positive. Five samples were selected randomly from each group and five slices were randomly selected from each sample. Ten renal glomerulus’ were randomly selected for each slice. The mean light density was detected and its average denotes protein expression intensity.
Data analysis
Three replicates were designed for each group of the experiment. All data were expressed as mean ± standard deviation and analyzed with SPSS 19.0 software package (Chicago, IL). One-way analysis of variance (ANOVA) and Newman-kueuls (Q) test were used for intergroup comparisons. For all analysis, probability smaller than 0.05 (p < 0.05) was considered as significant difference among groups.
Results
Effect of uPA on blood glucose, serum creatinine, urine protein, kidney weight/rat weight
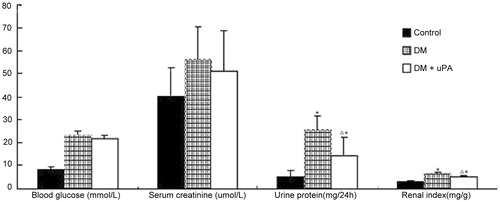
The blood glucose, serum creatinine, urine protein, kidney weight/rat weight are shown in . Significantly increased urine protein was detected in DM group compared with control group (p < 0.05), though blood serum creatinine manifested no distinct difference between groups (p > 0.05). And the application of uPA reduced urine protein in diabetic rats remarkably (p < 0.05).
Figure 1. Effect of uPA on blood glucose, serum creatinine, urine protein, and kidney weight of rats in control, diabetic rats (DM), and diabetic rats treated with uPA (DM + uPA) group. *p < 0.01, compared with control group. Δp < 0.01, compared with diabetic rat group.
Effect of uPA on glomerular mesangial matrix expansion in diabetic rat model
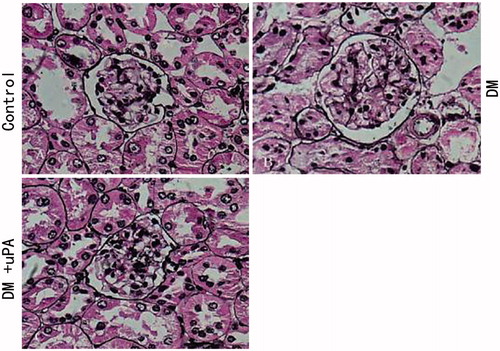
PASM staining revealed that glomerular volume in diabetic rats had significantly increased when compared to the rats in the control group, so did the proliferation of mesangial matrix (). And this effect could be partially reversed in uPA-treated kidney ().
Figure 2. Effect of uPA on AG, AM, and VG in rat renal tissues of control, diabetic rats (DM), and diabetic rats treated with uPA (DM + uPA) group. AG, glomerular mean area. AM, mesangial area. VG, glomerular mean volume. All the data are expressed as mean ± standard deviation. *p < 0.01, compared with control group. Δp < 0.01, compared with diabetic rat groups.
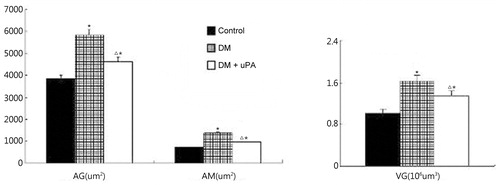
Figure 3. Pathologic change of rat renal tissues of the three groups (PASM × 400). (A) Control group. (B) diabetic (DM) group. (C) Diabetes treated with uPA (DM + uPA) group. AG, glomerular mean area. AM, mesangial area. VG, glomerular mean volume.
Effect of uPA on uPAR, PAI-1, and collagen IV expression in glomerular mesangial matrix of diabetic rats
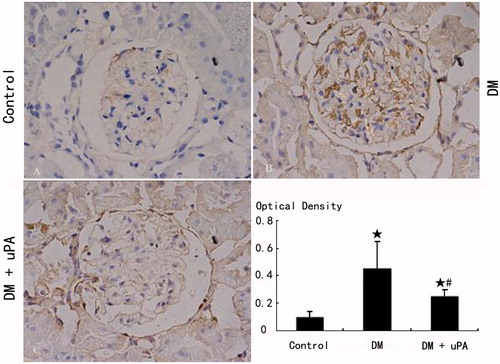
The expression of uPAR, PAI-1, and collagen IV in rat mesangial matrix of control group was not detectable (). Compared with control, the expression of uPAR, PAI-1, and collagen IV was significantly (p < 0.05) higher in diabetic rats (DM). uPA did not significantly (p > 0.05) affect uPAR expression in mesangial matrix of diabetic rats, but significantly (p < 0.05) down-regulated PAI-1 and collagen IV expression.
Figure 4. Glomerular uPAR expression in rats of the three groups (IHC × 400). (A) Control group. (B) Diabetic (DM) group. (C) Diabetes treated with uPA (DM + uPA) group. ☆p < 0.01, compared with control group. #p < 0.01, compared with diabetic rat group.
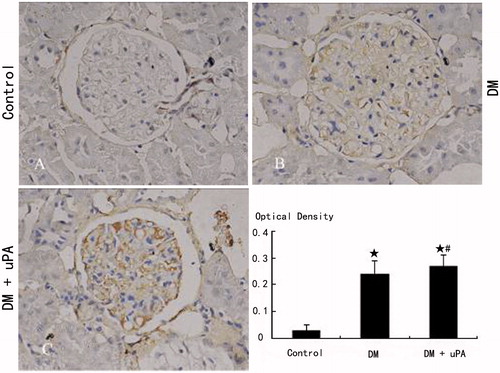
Figure 5. Glomerular PAI-1 expression in rats of the three groups (IHC × 480). (A) Control group. (B) Diabetic (DM) group. (C) Diabetes treated with uPA (DM + uPA) group. ☆p < 0.01, compared with control group. #p < 0.01, compared with diabetic rat group.
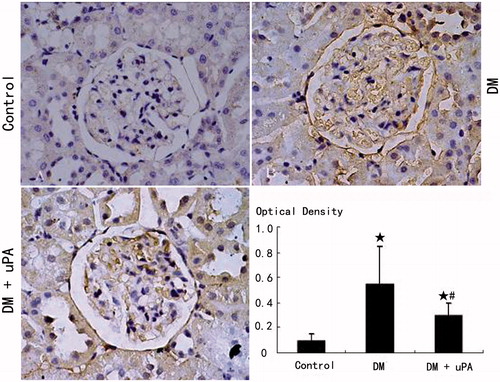
Figure 6. Glomerular collagen IV expression in rats of the three groups (IHC × 480). (A) Control group. (B) Diabetic (DM) group. (C) Diabetes treated with uPA (DM + uPA) group. ☆p < 0.01, compared with control group. #p < 0.01, compared with diabetic rat group.
Discussion
Under diabetic status, high-glucose can activate rennin–angiotensin–aldosterone system (RAAS), reactive oxygen species (ROS), and TGF-β1, and induce the high PAI-1 expression in glomerular MC. PAI-1 gene knockout can significantly lower glomerular mesangial matrix expansion, albuminuria, and collagen synthesis in diabetic rats.Citation4 Kenichi et al. found that uPA, uPAR, PAI-1, and collagen IV expression in glomerular MC of diabetic rats induced by STZ are high, indicating MC self-regulating function disorder under diabetic status breaks plasmin and anti-plasmin balance in mesangial matrix and hence results in the coexistence of plasmin and anti-plasmin activator molecules.Citation5 It might be an important mechanism mediated diabetic glomerular mesangial matrix change. However, it is not clear about the exact molecular mechanisms in pathophysiology.Citation6 This study showed that diabetic rats induced by STZ and with one kidney removed had significantly increased level of glomerular volume, PAI-1, uPAR, collagen IV expression, and glomerular extracellular cell matrix content. The results confirmed the coexistence of plasmin and anti-plasmin activator molecules mediated a significant expansion of glomerular mesangial matrix.
As a multifunctional enzyme, uPA can affect cell biology via multiple mechanisms.Citation6 After combined with uPAR on cell surface, uPA can activate tyrosine kinase (Src, Hck, FAK et al), serine or threonine in cells (ERK, MARP), and activate their corresponding signaling pathways, subsequently resulting in cell chemotaxis.Citation7 The combination of uPA and uPAR on cell surface starts plasminogen activator system, and activate matrix metalloproteases, leading to extracellular matrix protein hydrolysis and producing cascade reaction of protein cleavage. During the process, uPAR regulates uPA activity combined on cell surface, uPA distribution in normal tissues, and subsequently protein hydrolysis on cell surface mediated by plasminogen via fixation of uPA on cell surface and selective endocytosis and degradation of uPA/PAI-1 complex.Citation4,Citation7,Citation8 PAI-1 is an important regulator factor in uPA-uPAR, and it can induce endocytosis and degradation of combined uPA-uPAR.
It is reported that vein injection of uPA can improve glomerular fibrin deposition induced by lipopolysaccharide.Citation9 The uPA used to IgA patients with obvious down-regulated uPA expression in their epithelia of renal tubules alleviates renal fibrosis and delays the development of IgA nephropathy.Citation10,Citation11 However, it is not clear whether the uPA treatment is suitable for diabetic glomerular damage. In this study, we found that uPA significantly lowered PAI-1 and collagen IV expression in diabetic rats but did not affect uPAR expression. The half life of PAI-1 is extremely short and hence it has to be bound to matrix vitronectin in order to play its role.Citation2 The high affinity of PAI-1 and uPA can induce its combination with uPA-uPAR complex in cell membrane, forming uPA-uPAR-PAI-1 low-density lipoprotein related receptor, and starts cell endocytosis, and removes it.Citation12 Zhang et al. also confirmed that uPAR knockout upregulates PAI-1 expression in rat renal tissues.Citation13 Our study showed that uPA significantly downregulates glomerular PAI-1 expression of diabetic rats but did not significantly affect uPAR expression, which indicates that uPA might uptake and promote PAI-1 degradation via being bound to uPAR, subsequently regulating MC and its matrix expression and improving diseased diabetic mesangial matrix.
Declaration of interest
The authors report no conflicts of interest. The authors alone are responsible for the content and writing of this article.
References
- Cheng H, Chen C, Wang S, Ding G, Shi M. The effects of urokinase-type plasminogen activator (uPA) on cell proliferation and phenotypic transformation of rat mesangial cells induced by high glucose. Diabetes Res Clin Pract. 2014;103(3):489–495
- Ma LJ, Fogo AB. PAI-1 and kidney fibrosis. Front Biosci. 2009;14:2028–2041
- Nicholas SB, Aguiniga E, Ren Y, et al. Plasminogen activator inhibitor-1 deficiency retards diabetic nephropathy. Kidney Int. 2005;67(4):1297–1307
- Collins SJ, Alexander SL, Lopez-Guisa JM, et al. Plasminogen activator inhibitor-1 deficiency has renal benefits but some adverse systemic consequences in diabetic mice. Nephron Exp Nephrol. 2006;104:23–34
- Kenichi M, Masanobu M, Takehiko K, et al. Renal synthesis of urokinase type-plasminogen activator, its receptor, and plasminogen activator inhibitor-1 in diabetic nephropathy in rats: Modulation by angiotensin-converting-enzyme inhibitor. Jf Lab Clin Med 2004;144:69–77
- Zhang G, Eddy AA. Urokinase and its receptors in chronic kidney disease. Front Biosci. 2008;13:5462–5478
- Tada H, Tsukamoto M, Ishii H, et al. A high concentration of glucose alters the production of tPA, uPA and PAI-1 antigens from human mesangial cells. Diabetes Res Clin Pract. 1994;24:33–39
- Lupia E, Elliot SJ, Lenz O, et al. IGF-1 decreases collagen degradation in diabetic NOD mesangial cells: Implications for diabetic nephropathy. Diabetes. 1999;48:1638–1644
- Xi C, Chen X, Sun X, et al. Effects of alterations of glomerular fibrin deposition on renal inflammation in rats at different age stages. J Gerontol A Biol Sci Med Sci. 2005;60:1099–1110
- Cove-Smith A, Hendry BM. The regulation of mesangial cell proliferation. Nephron Exp Nephrol. 2008;108:74–79
- Awazu M, Omori S, Ishikura K, et al. The lack of cyclin kinase inhibitor p27Kip1 ameliorates progression of diabetic nephropathy. J Am Soc Nephrol. 2003;14:699–708
- Li Y, Knisely JM, Lu W, et al. Low density lipoprotein (LDL) receptor-related protein 1B impairs urokinase receptor regeneration on the cell surface and inhibits cell migration. J Biol Chem. 2002;277:42366–42371
- Zhang G, Kim H, Cai X, et al. Urokinase receptor modulates cellular and angiogenic responses in obstructive uropathy. J Am Soc Nephrol. 2003;14:1254–1271