
Abstract
Purpose: Urinary stones are common and can be diagnosed with computed tomography (CT) easily. In this study, we aimed to specify the opacity characteristics of various types of calcified foci that develop through the urinary system by using an image analysis program. With this method, we try to differentiate the calculi from the non-calculous opacities and also we aimed to present how to identify the characteristic features of renal and ureteral calcules. Materials and methods: We obtained the CT studies of the subjects (n = 48, mean age = 41 years) by using a dual source CT imaging system. We grouped the calculi detected in the dual-energy CT sections as renal (n = 40) or ureteric (n = 45) based on their locations. Other radio-opaque structures that were identified outside but within close proximity of the urinary tract were recorded as calculi “mimickers”. We used ImageJ program for morphological analysis. All the acquired data were analyzed statistically. Results: According to thorough morphological parameters, there were statistically significant differences in the angle and Feret angle values between calculi and mimickers (p < 0.001). Multivariate logistical regression analysis showed that Minor Axis and Feret angle parameters can be used to distinguish between ureteric (p = 0.003) and kidney (p = 0.001) stones. Conclusions: Computer-based morphologic parameters can be used simply to differentiate between calcular and noncalcular densities on CT and also between renal and ureteric stones.
Introduction
Stones in the urinary tract are common and can be diagnosed by current technology.Citation1 However, computed tomography (CT) scans, especially obtained in emergent conditions can lead to difficulties in differential diagnosis of urinary tract stones and calcifications that develop along the urinary tract or within its close proximity.Citation2 In this study, we aimed to specify the detailed morphologic characteristics of ureteric stone, renal stone and non-calculary opacities by using an image analysis program that detects micro-structural characteristics of urinary stones. In this way, we aimed to analyze the automatically differentiation and definition of opacities that may cause a diagnostic dilemma near or within the urinary tract.
Materials ad methods
Ethics and CT technique and patients
This study was approved by the Institutional Review Board and Ethics Committee. Informed consent was obtained from all the cases. Imaging of cases (n = 38, 27 male, 11 female, mean age: 41 years) obtained from dual energy CT system (Somatom Definition Flash, Dual Source CT, Siemens, Erlangen, Germany) in our center. Dual energy CT (DE-CT) examinations were obtained using a two-acquisition protocol. First, a lower-dose and then higher-dose unenhanced acquisition from the upper kidney lobe to the pubic symphysis was performed with tube potentials, 80 and 140 kV, tube current, 340 and 90 mAs, collimation, 2 × 64 × 0.6 mm; pitch, 1.2; rotation time, 0.5 s; image reconstruction thickness, 1 mm; reconstruction interval, 0.8 mm). This protocol is routinely used at our institution to diagnose patients with acute flank pain suspected to have renal colic.
The calculi that were detected at DE-CT images were grouped as renal (n = 40) and ureteric (n = 45). These urinary calculi in 38 cases were also confirmed with another modality [ultrasonography (n = 13), IVP (n = 18), CT-urography (n = 7)]. Other radio-opaque structures at CT sections that were identified outside but within close proximity of the urinary tract (atherosclerotic calcifications in iliac arteries, phleboliths in pelvis, and calcifications inside or around the prostate or cervix) were all recorded as “mimickers” (n = 43).
Image processing technique
DECT images were created automatically as 80 kV+ 140 kV hybrid images and DICOM formats of images were transferred into an image processing program named as ImageJ. ImageJ is a java based, open source code “multithreaded” image processing and analyzing program developed by National Institute of Health (NIH), USA.Citation3 ImageJ plug-in is code particles written in Java language that can be run on ImageJ platform and it was developed to add a new function to ImageJ platform.Citation4
The images used in this study had a 1268 × 1936 resolution and 8 bit color depth. The demarked calcification zone to be analyzed was cut and detached from the picture, and then the cut segments were converted into black-white (binary) image using the threshold command of ImageJ program ().
Figure 1. (a–h) Especially, a calculus that shows the stages in processing some of the parameters that are statistically significant in the ImageJ programme (a) original axial CT image, (b) the cut zone from the image, (c) the black-white image after running threshold command, (d) determination of the border of object, (e) drawing of an ellipse best fit to the border of object, (f) Feret diameter of object, (g) measuring the angle, (h) measuring the Feret angle.
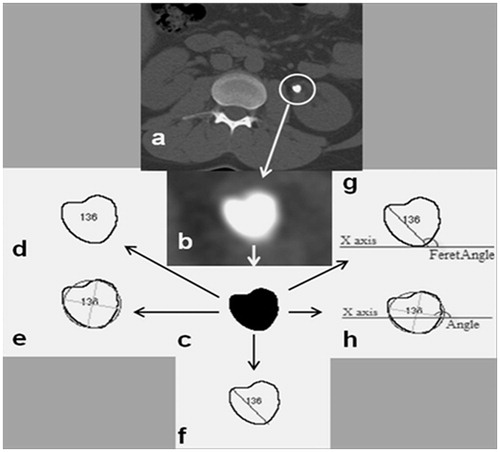
When this command is run it turns to black above a threshold level and to white below. Finally, morphological analysis was done using ImageJ plug-in on the created black-white image. Area value represents the occupied place by the object in pixel. Perimeter value represents the circumference of the object in pixel. Major, minor and angle are the values related to “best fitting ellipse” to that object. Major and minor represents the length of primary and secondary axes of the ellipse whereas angle value represents the angle between primary axis and x axis of image. Circularity and solidity values give the roundness of the object in numerical value. Circularity value is only “1” for a complete circle. When the value comes close to zero the object gets an elongated shape. The last calculated values were Feret measurements of the object. The straight line drawn between the farthest two points on the border of the selected object using callipers was called Feret angle. Feret value represents the length of this line. FeretX and FeretY values give the initial coordinate values of Feret diameter. MinFeret value represents the distance between the nearest two points on the border of the object. Feret angle represents the angle between Feret diameter and horizontal axis. The morphological terminology was summarized in .
Table 1. The morphological characteristics of calculi or calcification evaluated by ImageJ.
After the evaluation of turbidities for each of the three groups using ImageJ, the provided data were transferred into excel tables and recorded.
Statistical analysis
All of the statistical analyses were performed by using the SPSS v15 (SPSS Inc., Chicago, IL) package for Windows. Homogeneity of variance test analysis was performed to test the distribution of groups. For Gaussian-distributed variables, the data are expressed as arithmetic mean ± standard deviation (SD). For those variables that were not Gaussian distributed, the data are indicated as median (25th–75th interquartile range). Comparisons among the three groups were undertaken by using the one-way analysis of variance or Kruskal–Wallis variance analysis for Gaussian and non-Gaussian-distributed variables, respectively. If the differences were significant, pair-wise comparisons would be based on the Student t-test or Mann–Whitney U-test with adjustment for Bonferroni correction to reveal which subgroups were different, respectively. All of the reported p values were two-tailed, and those less than 0.005 were considered to be statistically significant. Because total area, minor, angle, Feret angle and minferet did not indicate normal distribution, non-parametric tests were applied. For the rest of the morphological characteristics parametric tests were used. The diagnostic accuracy of the biochemical variables was assessed by calculating the areas under the receiver operating characteristic (ROC) curves, sensitivity, specificity and odds ratio. ROC curves were used to determine the best cut-off points to identify the presence of renal or ureteral opacity. The odds ratio values for each variable were assessed by using multivariate logistic regression analysis.
Results
The mean value (±2 SD) of data for each variable calculated for opacities at ureteric, renal and other groups detected via ImageJ program was shown in .
Table 2. The mean value (±2 SD) for all variables at groups of renal, ureter and other turbidities.
Furthermore, the values related to calculous and non-calculous opacities were summarized to make a general comparison. The ROC curves constituted after the evaluation of ROC analysis of variables () and the AUC and p values related to these data were shown in .
Figure 2. Combined ROC curve graphs of parameters that have statistically significant characteristics.
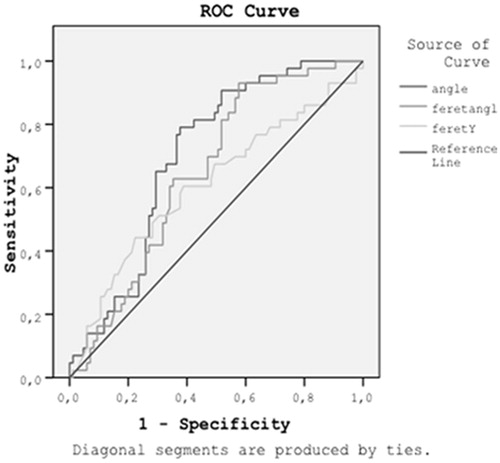
Table 3. The comparison of mean parametric values of calculous and non-calculous turbidities.
As for values obtained from and the constituted ROC curves; no statistical significant difference was found between three groups for all variables except those for angle and Feret angle. There was statistically significant difference between calculi group and non-calculous opacities for these two (angle and Feret angle) parameters (p < 0.001; p = 0.006, respectively).
The mean values for angle parameter at renal, ureter and other opacities were 80,598 ± 7692 (4.20–169.32), 69.341 ± 5.278 (2.50 – 133.62) and 1.023 ± 4.983 (41.70 – 172.90), respectively.
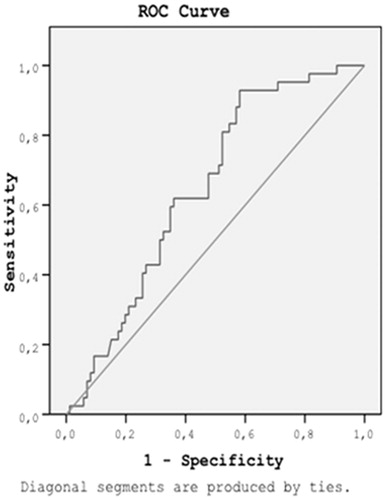
The mean values for Feret angle at renal, ureter and other opacities were 88.275 ± 7.511 (6.01 – 168.02), 68.959 ± 4.976 (12.53 – 128.66) and 97.886 ± 5.204 (16.93 – 167.74), respectively. The data for angle and Feret angle were shown in separate information with ROC curve graphs ( and ). According to the statistical data, sensitivity and specify rates obtained at different threshold values were constituted. For angle, considering the cut-off value of 83; it is possible to differentiate the calculi with 79% sensitivity, 61% specificity. For Feret angle, considering the cut-off value of 68.6; it is possible to differentiate the calculi with 82% sensitivity, 48% specificity.
Figure 3. ROC curve and the statistical data related to angle ((a) under the non-parametric assumption and (b) null hypothesis: valid area = 0.5).
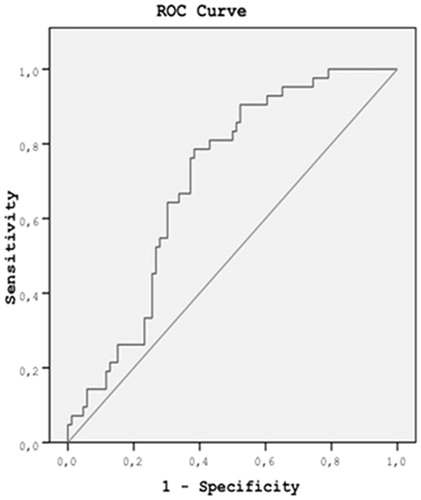
Figure 4. ROC curve and the statistical data related to feret angle. There is a correlation between the positive actual state group and the negative actual state group at Feret angle. Statistics may be biased. ((a) Under the non-parametric assumption and (b) null hypothesis: valid area = 0.5).
The analysis performed for calculous and non-calculous group showed that angle and Feret angle are most effective parameters for differentiation. The multivariate logistic regression analysis of renal and ureteric calculi group showed that these two groups have discriminative differences (statistically significant) only for Feret angle and Minor parameters ().
Table 4. The difference between renal and ureteric calculi variables in the equation.
Multivariate logistic regression analysis showed that, high minor (OR 8.060, 95%CI 2.018–32.201, p = 0.003) and high Feret angle (OR 5.477, 95%CI 1.946–15.418, p = 0.001) were statistically significant parameters to distinguish the renal calculus from ureteral stones. The odds ratio for Feret angle was 5.477. This demonstrates the probability of renal stone formation is 5.477 fold increases as the Feret angle value exceeds 80.45 compared with below 80.45. The odds ratio for Minor variable was 8.060. This means that the probability of renal stone formation is 8.060 fold increases as the minor value exceeds 19.89 compared with below 19.89.
Discussion
The incidence of nephrolithiasis has been increasing in recent years.Citation1 Many examinations have been performed to evaluate the urinary stone disease diagnosed in men up to 12% and in women 6%. This common pathology led to innovations in radiological technology. Currently, CT technology offers more diagnostic alternatives beyond three-dimensional imaging that enhances orientation of urinary system anatomy, like spectral modalities that can detect the chemical composition of the stones in vivo. In comparison with the past years, these modalities can be performed under lower-dose alternatives.Citation5,Citation6
In the light of these technological developments, currently, DECT can be used as an advanced technique for examining patients diagnosed with urinary stones. All the characteristics of stones that can be critical for clinical evaluation can be detected using DECT, with low dose protocols becoming more common in daily practice.Citation7 With these modalities instead of making multiple examinations like direct graph, US, IVU, spiral CT, and MR-urography; the location, size, chemical composition and obstructive effect of stones can be evaluated using DECT in single session, with lower doses and high resolution.Citation8
The accuracy of CT is higher than US, IVU and MRI in the detection and evaluation of stones.Citation9 The low sensitivity of US in small calculi and gas superposition results in suboptimal examinations frequently. Also, MRI can be impractical for evaluating non-obstructive urolithiasis cases due to the artifacts and signal inadequacy. CT, the most common modality at present, is used for evaluating urinary stone disease, which has become widespread with the MDCT technology, and dosage exposure decreased more than 50% via iterative reconstruction software.Citation9
In addition to this, the evaluation of patients with renal colic or suspicion of calculi with CT is also useful for leaving out other clinical or surgical conditions (appendicitis, diverticulitis, etc.) that may act as/give symptoms like the renal colic.Citation10–13 Until now, some data can be found on differential diagnosis of mimickers settled in the distal periureteral tissue.Citation2,Citation14 However, systematic or detailed study about mimicking opacities except clinical mimickers cannot be found. Our study provides some data to fill the gap in this area. Along with differentiation of the calculi and non-calculous opacities, ureteric and renal stones were successfully differentiated with statistical analysis.
When processed with the program we use (ImageJ), urinary stone characteristics in CT section showed statistically significant differences in the angle and Feret angle values for calculi and other opacities. Setting the binary threshold to 69.4 for the angle led to a sensitivity of 91% (p < 0.001), and setting it to 52.7 for the Feret angle led to a sensitivity of 95% (p = 0.006) were found in differentiation of the calculous and non-calculous opacities. Furthermore, multivariate logistical regression analysis showed that Minor Axis and Feret Angle parameters can be used to distinguish between ureteric and kidney calculi with the values of 8.060 versus 5.477 (p = 0.003 and p = 0.001), respectively.
Obviously, only very low “p” values were recognized as statistically significant in this study. However, this study also had some limitations. First of all, as a preliminary study on this area, no comparison could be made with other similar studies. On the other hand, as a quantitative study, we do not consider it as a significant handicap. This study involved no bladder calculi. The analysis of these stones might give additional information. Nevertheless, questions like “Is it primary? Or passed through ureters?” may lead to confusion. Therefore, absence of this group seems to be accurate indirectly. One of the most critical limitations of this study is the need to confirm the results with larger series and integrate this system to CAD systems. In this way, examinations with lower-dose protocols, even the quality of images, were distorted. This may lead us to diagnose calculi rapidly, especially in spite of specifying hundreds of sections obtained by multidetector CT examinations.
Conclusion
Morphologic parameters that are computed based on binary morphological analysis can help us to distinguish the calculi along the urinary tract from other radio-opaque structures. The same approach can also be used to automatically differentiate renal and ureteric calculi. In near future, we believe that computer-aided diagnosis tools can be developed based on the findings presented in this study to identify urinary opacities in CT images.
Declaration of interest
The authors report no conflicts of interest.
References
- Scales CD Jr., Curtis LH, Norris RD, et al. Changing gender prevalence of stone disease. J Urol. 2007;177:979–982
- Cheng PM, Moin P, Dunn MD, Boswell WD, Duddalwar VA. What the radiologist needs to know about urolithiasis: Part 2 – CT findings, reporting, and treatment. AJR Am J Roentgenol. 2012;6:548–554
- Rasband WS. ImageJ. U.S. National Institutes of Health, Bethesda, MD, 2007. Available at: http://rsb.info.nih.gov/ij/index.html. Accessed December 2012
- Bailer W. Writing ImageJ Plugins – A Tutorial. Version 1.71, 2006. Available at: http://rsb.info.nih.gov/ij/download/docs/tutorial171.pdf. Accessed December 2012
- Kaza RK, Platt JF, Cohan RH, Caoili EM, Al-Hawary MM, Wasnik A. Dual-energy CT with single- and dual-source scanners: Current applications in evaluating the genitourinary tract. Radiographics. 2012;32:353–369
- Manglaviti G, Tresoldi S, Guerrer CS, et al. In vivo evaluation of the chemical composition of urinary stones using dual-energy CT. AJR Am J Roentgenol. 2011;197:76–83
- Matlaga BR, Kawamoto S, Fishman E. Dual source computed tomography: A novel technique to determine stone composition. Urology. 2008;72:1164–1168
- Saw KC, McAteer JA, Monga AG, Chua GT, Lingeman JE, Williams JC Jr. Helical CT of urinary calculi: Effect of stone composition, stone size, and scan collimation. AJR Am J Roentgenol. 2000;175:329–332
- Yilmaz S, Sindel T, Arslan G, et al. Renal olic: Comparison of spiral CT, US and IVU in the detection of ureteral calculi. Eur Radiol. 1998;8:212–217
- Rucker CM, Menias CO, Bhalla S. Mimics of renal colic: Alternative diagnoses at unenhanced helical CT. Radiographics. 2004;24:11–28
- Nada R, Awasthi A, Mete U, Husain S, Joshi K. Carcinosarcoma of urinary bladder mimicking vesical calculus: A case report. Indian J Pathol Microbiol. 2007;50:833–835
- Sergeant G, Slabbaert K, Werbrouck P. Recurrent flank pain caused by eosinophilic ureteritis mimicking urinary stone disease: A case report. Int Urol Nephrol. 2004;36:23–25
- Rupar G, Beham-Schmid C, Gallé G, Zigeuner R, Langner C. Interdigitating dendritic cell sarcoma of urinary bladder mimicking large intravesical calculus. Urology. 2005;66:1109
- Cheng PM, Moin P, Dunn MD, Boswell WD, Duddalwar VA. What the radiologist needs to know about urolithiasis: Part 1-pathogenesis, types, assessment, and variant anatomy. AJR Am J Roentgenol. 2012;198:540–547