
Abstract
Objective: This study seeks to account for the possibility that single kidney glomerular filtration rate (SKGFR) and donor/recipient (D/R) body surface area (BSA) ratio could act as cofactors for evaluating potential living related donors. Methods: The study population included 204 cases of LKRs with a functional graft that were regularly followed up for more than 2 years. Based on SKGFR and D/R BSA ratio, the recipients were divided into six groups: group A (SKGFR < 40 mL/min, D/R BSA ratio ≤ 0.8), group B (SKGFR < 40 mL/min, 0.8 < D/R BSA ratio < 1.2), group C (SKGFR < 40 mL/min, D/R BSA ratio ≥ 1.2), group D (SKGFR ≥ 40 mL/min, D/R BSA ratio ≤ 0.8), group E (SKGFR ≥ 40 mL/min, 0.8 < D/R BSA ratio < 1.2), and group F (SKGFR ≥ 40 mL/min, D/R BSA ratio ≥ 1.2). The database included donor, recipient, and transplant variables. Renal function of the recipients was recorded at 1 week, 2 weeks, 1 month, 3 months, 6 months, 12 months, and 24 months post-transplantation, respectively. Results: The declining rate of SCr and graft eGFR in stable periods post-transplantation in group A were always worse than the other five groups, and the difference was statistically significant (p < 0.05). The declining rate of SCr and graft eGFR in stable periods post-transplantation in groups C and F were always better than the other four groups, and the difference was statistically significant (p < 0.05). Conclusions: Both SKGFR and D/R BSA ratio should be considered for choosing potential living related donors. Donors with SKGFR < 40 mL/min and D/R BSA ratio ≤ 0.8 should be carefully selected. Satisfactory graft function in donors with SKGFR < 40 ml could be achieved if their D/R BSA ratio is >0.8.
Introduction
Organ shortage is a global problem, which is also rampant in China. Living related kidney transplantation (LRKT) is a practical solution for this problem, especially in undeveloped regions of China.Citation1,Citation2 LRKT is associated with longer graft and patient survival as compared to deceased donor kidney transplantation.Citation3,Citation4 The improved outcomes associated with LRKT are best explained by a reduction in ischemic injury, shorter waiting time on dialysis, and the transplantation of “healthier” kidney tissue when compared to deceased donor kidney transplantation.
Pre-donation kidney function and volume are crucial factors in determining graft outcomes in kidney transplant recipients, but the data are controversial, and mainly derived from indirect observations in deceased donor kidney transplantation.Citation5–8 Glomerular filtration rate (GFR) is a valuable indicator to precisely evaluate the potential donor kidney function [9]. Although most guidelines recommended that the SKGFR of a planned kidney transplant had to be over 40 mL/min,Citation9,Citation10 the lowest acceptable level of SKGFR was not defined with respect to donor safety or recipient benefit. Body size is another important independent predictor for kidney volume and GFR.Citation11,Citation12 Poggio et al.Citation13 reported a strong correlation between donor body surface area (BSA) and renal function. Lee et al.Citation14 indicated that graft kidney volume/recipient BSA ratio was a predictor of graft function 12 months after kidney transplantation. This study seeks to determine the impact of SKGFR of a planned kidney transplant and the subsequent graft function in LRKTs. Our analysis supplements the current level of knowledge by assessing the impact of D/R BSA ratio on graft function, and accounting for the possibility that SKGFR and D/R BSA ratio could act as cofactors for evaluating potential living related donors.
Patients and methods
Study design
This study was performed in accordance with the ethical standards laid down in the 7th revision of the Declaration of Helsinki,Citation15 and was approved by the first affiliated hospital of Zhengzhou University. In addition, all donors and recipients gave their informed consent prior to their inclusion in the study. The initial dataset included 217 primary LKRs who underwent transplantations between October 2007 and October 2011 at our institute. In order to evaluate the influence of baseline donor renal function only, and to exclude factors that were not primarily determined by a donor kidney, 13 recipients were excluded from the analysis due to the death of recipients in the first year post-transplant (2 recipients due to severe pneumonia), slow graft function (1 recipient owing to prolonged warm ischemia time), and incomplete follow up (10 recipients). The remaining 204 recipients with a functional graft who regularly followed up at our institute for more than 2 years comprised the population that was analyzed in this study.
Donation procedure
The relationship between the donors and recipients complied with the Regulations of Organ Transplantation of the People’s Republic of China: LRKTs are limited to spouses, lineal blood relatives, or collateral blood relatives within three generations. The relationships between the donors and recipients are shown in . Each pair of donor and recipient underwent HLA typing and complement-dependent cytotoxicity. All the donors and recipients submitted applications and written informed consent to the ethics committees of the health department of Henan Province. All documents were approved by the committees before the surgeries were scheduled.
Table 1. Data of donors and recipients.
Pre-operative medical examination of donors
The kidney donors were subjected to an extensive medical, physical, and radiological examination according to the Chinese Practice Guidelines for Kidney Transplantation.Citation16 Briefly, all donors were healthy with no history of tumor or psychiatric disorders, no clinical hypertension, no abnormal findings in routine blood tests, liver function tests and renal function tests, and no proteinuria. Negative serological findings for hepatitis B and C viruses, syphilis, and AIDS were also required. Chest CT scans and electrocardiographs (ECG) were normal; kidney ultrasound and CT angiography were performed routinely. Serum creatinine (SCr) level and the 99mTc-DTPA glomerular filtration rate (total and relative contributions of each kidney to overall glomerular filtration rate) were used for the assessment of global kidney function before donation. Donor and recipient BSA was calculated using the formula of Mosteller:Citation17 BSA (m2) = ([Wt × Ht]/3600)1/2, in which Wt was body weight in kilograms and Ht was height in centimeters. For each recipient, the ratio between donor BSA and recipient BSA (D/R BSA ratio) was then calculated. D/R BSA radio is a reliable indicator of nephron dosing. In order to optimize graft function in living donor kidney transplantation, three groups were formulated using different D/R BSA ratio as previously described.Citation18 Briefly, D/R BSA ratio ≤ 0.8 group, 0.8 < D/R BSA ratio < 1.2 group, and D/R BSA ratio ≥ 1.2 group. Estimated GFR (eGFR) was calculated using the MDRD formula:Citation19 eGFR [mL min−1·(1.73 m2)−1] = 186 × Scr−1.154 × age−0.203 × 0.742 (if female). As most guidelines recommended that the SKGFR of a planned kidney transplant had to be over 40 mL/min,Citation9,Citation10 we choose 40 mL/min as the cutting point to divide the SKGFR of a planned kidney transplant as two group. Briefly, SKGFR ≥ 40 mL/min group and SKGFR < 40 mL/min group. Renal function was expressed as SCr values and eGFR at 1 and 2 weeks as well as 1, 3, 6, 12, and 24 months post-transplantation.
Donated kidney selection and surgery
To ensure the donor’s safety, the kidney with higher GFR was reserved for the donor. If the difference of bilateral kidneys’ GFR was below 5 mL/min, the kidney with a sole artery was recovered for donation, as the sole artery anastomosis could minimize vascular complications. The warm ischemia time was 2.54 ± 1.23 min and the cold ischemia time was 32.3 ± 11.4 min. The classical flank incision gave an excellent overview, except for six donors who underwent laparoscopic nephrectomy due to less post-operative pain. The kidney was recovered by flushing immediately with 4 °C histidine tryptophan ketoglutarate (HTK) solution and transplanting by a standard surgical procedure. All grafts were placed in the right iliac fossa and all recipients used extraperitoneal access. The renal artery was anastomosed to the end of the internal iliac artery in 176 recipients and to the side of external iliac artery in the other 28 recipients. The renal vein was anastomosed to the external iliac vein end-to-side in all recipients. Finally, the ureter was reconstructed by extravesical ureterocystostomy (Lich–Gregoir method). Ureteral stents were placed routinely and were usually removed 1 month after kidney transplantation.
Immunosuppressive regimen
All recipients received induction with rabbit antithymocyte globulin and methylprednisolone, intravenously. Standard triple immunosuppressive regimen including tacrolimus (Tac) or cyclosporine (CsA), mycophenolate mofetil (MMF), and steroids was used. About 174 recipients used Tac and another 30 recipients used CsA. CYP3A5 genotype was determined by polymerase chain reaction and restriction fragment length polymorphism analysis. We gave different Tac doses according to the CYP3A5 genotype of recipients, in which CYP3A5 *1/*1 was given 0.15 mg/(kg d), *1/*3 type was given 0.12–0.14 mg/(kg d), and *3/*3 type was given 0.08–0.10 mg/(kg d). An initial dosage of CsA ranging from 6 to 8 mg/(kg d) was given to the recipients. Fluorescence polarization immunoassay was used to measure the whole blood trough concentration of Tac and CsA. We adjusted the dosage of Tac and CsA according to Tac and CsA trough levels, kidney function, urine, etc. The target trough concentration of Tac were adjusted to keep from 10 to 14 μg/L in the first 2 weeks, 9 to 13 in the first month, 8 to 10 in the first 3 months, 7 to 9 in the first 6 months, and 6 to 8 in the first 2 years post-transplantation. The target trough concentration of CsA were adjusted to keep from 250 to 350 μg/L in the first 2 weeks, 200 to 250 in the first month, 150 to 200 in the first 3 months, and 100 to 200 in the first 2 years post-transplantation. Oral MMF dosage was 0.5, 0.75, and 1.0 g twice daily for patients weighing <50, 50–70, and >70 kg, respectively. All recipients received ganciclovir for 14 days after transplantation to prevent cytomegalovirus (CMV) infection. The recipients who became CMV-Ig positive were given oral ganciclovir for 2 months. All recipients also received oral sulfamethoxazole twice daily from the third day to 3 months post-surgery to prevent Pneumocystis jiroveci infection.
Statistical analysis
Descriptive values were presented as mean ± standard deviation (±SD). Independent-samples t-test, one-way ANOVA, non-parametric test, Kruskal–Wallis H (K) test, and Mann–Whitney U test were used to analyze the differences between groups. Statistical analysis was performed with the Statistical Package for the Social Sciences (SPSS) version 13.0 software (SPSS Inc., Chicago, IL). p < 0.05 was considered to be statistically significant.
Results
SCr and eGFR of recipients at follow-up in different SKGFR group
SCr and eGFR of recipients at follow-up in different SKGFR group are displayed in . The data illustrated that SCr and eGFR of recipients in SKGFR < 40 mL/min group and SKGFR ≥ 40 mL/min group were similar, and the difference between these two groups was not significant (p > 0.05).
Figure 1. Changes in SCr and eGFR at follow-up between different GFR groups and different D/R BSA ratio groups.
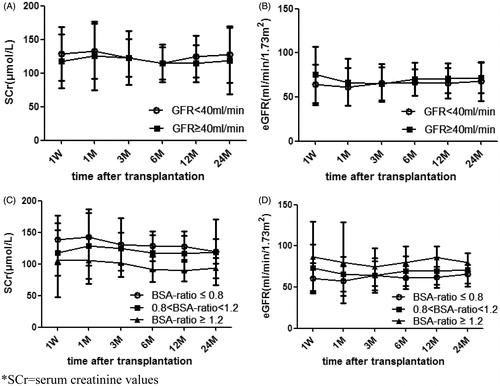
SCr and eGFR of recipients at follow-up in different D/R BSA group
SCr and eGFR of recipients at follow-up in different D/R BSA group are displayed in . The results show that SCr of recipients with D/R BSA ratio ≤ 0.8 was higher than those with D/R BSA ratio ≥ 1.2 post-transplantation (p < 0.05). Statistically significant differences in SCr at 1 week between recipients with D/R BSA ratio ≤ 0.8 and 0.8 < D/R BSA ratio < 1.2 was observed, however, these differences disappeared after 1 month. There were no differences between recipients with 0.8 < D/R BSA ratio < 1.2 and D/R BSA ratio ≥ 1.2 within 6 months, but the differences between the two groups was statistically significant at 12 months post-transplantation. Similarly, recipients with D/R BSA ratio ≤ 0.8 had a lower eGFR as compared to recipients with 0.8 < D/R BSA ratio < 1.2 post-transplantation, but the difference was not statistically significant (p > 0.05). Recipients with D/R BSA ratio ≤ 0.8 had lower eGFR as compared to recipients with D/R BSA ratio ≥ 1.2 (p < 0.05). There were no statistically significant differences between recipients with 0.8 < D/R BSA ratio < 1.2 and D/R BSA ratio ≥ 1.2 within 6 months (p > 0.05), but the difference was statistically significant after 1 year (p < 0.05).
SCr of recipients grouped by SKGFR and D/R BSA ratio at 1 week post-transplantation
Next, we divided the recipients into six groups according to the SKGFR and D/R BSA ratios. Age, gender, pre-operative SCr of recipients and donors, primary renal diseases, pre-operative hemoglobin of recipients, and HLA mismatch in the six groups are listed in . There were no significant differences between these groups (p > 0.05). To exclude renal toxicity caused by abnormal Tac concentration in different groups, the Tac concentration at different time point are listed in and the difference was not statistically significant (p > 0.05). As only 30 recipients were applied with CsA, we did not analyze the statistical significance of different CsA concentration in six groups.
Table 2. Basic information of donors and recipients in six groups.
Table 3. Different Tac concentration at follow-up in six groups.
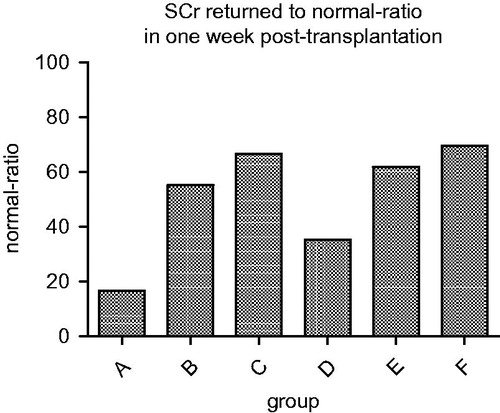
The rates that SCr of recipients returned to normal 1 week post-transplantation are listed in . From the graph, it was observed that SCr of all recipients in the six groups declined rapidly within the first week post-transplantation. However, the ratio of normal SCr in each group after 1 week was different. The ratio of group A was significantly lower than the other five groups (p < 0.05).
Figure 2. Different ratios of normal SCr in each group 1 week post-transplantation.
SCr and eGFR of recipients at follow-up based on different SKGFR and D/R BSA ratio group
SCr and eGFR of recipients in six groups are presented in and , respectively. As shown in , SCr decreased slowly in each group 1 week post-transplantation, and remained stable thereafter. Meanwhile, SCr of recipients had significant differences in the stationary phase. Recipients in group A showed higher SCr at each time point post-transplantation as compared to the other five groups, and the difference was statistically significant (p < 0.05). SCr in groups C and F were lower as compared to the other four groups at each time point, and the difference was statistically significant (p < 0.05). As shown in , recipients in group A had a lower eGFR at every time point post-transplantation as compared to the other five groups, and the difference was statistically significant (p < 0.05). Moreover, eGFR in groups C and F were higher as compared to the other four groups at each time point, and the difference was statistically significant (p < 0.05).
Table 4. SCr of recipients at follow-up in six groups.
Table 5. eGFR of recipients at follow-up in six groups.
Discussion
Previous studies have found that D/R BSA can affect the incidence of delayed graft function (DGF), acute rejection and graft function after renal transplantation.Citation20,Citation21 Therefore, we evaluated both donor kidney GFR and D/R BSA ratio when we chose potential donors for LRKT. As a result, the recovery of graft functions in recipients of SKGFR < 40 mL/min donors were only slightly worse than recipients of SKGFR ≥ 40 mL/min donors in our hospital. Therefore, a similar outcome of transplantation could be achieved by strictly controlling inclusion criteria to SKGFR < 40 mL/min donors, and taking the D/R BSA ratio into account.
For the recipients of donors with D/R BSA ratio ≤ 0.8 and the SKGFR < 40 mL/min, it was difficult to improve their graft function to normal level, and the recovery of graft function was significantly worse as compared to recipients of donors with SKGFR ≥ 40 mL/min or D/R BSA ratio > 0.8 at every time point post-transplantation. Therefore, to those donors who meet the criteria of both SKGFR < 40 mL/min and D/R BSA ratio ≤ 0.8, we should carefully select them. When the D/R BSA ratio is between 0.8 and 1.2, SCr and eGFR of recipients at follow-up had no statistically significant differences between the SKGFR < 40 mL/min and SKGFR ≥ 40 mL/min groups. When the D/R BSA ratio ≥ 1.2, the differences in SCr and eGFR of recipients at follow-up between SKGFR < 40 mL/min and SKGFR ≥ 40 mL/min groups was not statistically significant. Moreover, recipients meeting the criteria of both SKGFR < 40 mL/min and D/R BSA ratio ≥ 1.2 showed better recovery of renal function at each time point as compared to recipients meeting the criteria of both SKGFR ≥ 40 mL/min and D/R BSA ratio ≤ 1.2. Therefore, selection of potential living kidney donors should not just rely on SKGFR, since D/R BSA ratio also plays an important role. We can extend the requirements of SKGFR to <40 mL/min for the recipients with D/R BSA ratio > 0.8, especially for the recipients with D/R BSA ratio ≥ 1.2.
In summary, we should take the D/R BSA ratio into consideration when selecting potential living donors with low SKGFR to improve the outcomes of LRKT. Satisfactory graft function could be achieved in donors with SKGFR < 40 mL/min, if they meet the criteria of D/R BSA ratio > 0.8. Nevertheless, we must acknowledge some limitation of this study. First, this study is a retrospective study. Second, relatively small number of patients is included in this study.
Declaration of interest
The authors have declared no conflict of interest. This study was supported by Chinese Natural Science Foundation (U1204820) and Henan Province Natural Science Foundation Research Project (122300410190).
References
- Gong NQ, Ming CS, Zeng FJ, et al. Renal function of donors and recipients after living donor kidney transplantation in a Chinese cohort. Chin Med J (Engl). 2011;124:1290–1295
- Li G, Wang YP, Ma LL, Zhang J, et al. Marginal living donor in kidney transplantation: Experience in a Chinese single center. Chin Med J (Engl). 2013;126:2810–2814
- Lezaic V, Naumovic R, Marinkovic J, Jaksic E, Djukanovic L. Donor kidney glomerular filtration rate and post-transplant graft function. Am J Transplant. 2004;4:1669–1674
- Sapir-Pichhadze R, Young A, Joseph Kim S. Living donor age and kidney transplant outcomes: An assessment of risk across the age continuum. Transpl Int. 2013;26:493–501
- Giral M, Nguyen JM, Karam G, et al. Impact of graft mass on the clinical outcome of kidney transplants. J Am Soc Nephrol. 2005;16:261–268
- Kasiske BL, Snyder JJ, Gilbertson D. Inadequate donor size in cadaver kidney transplantation. J Am Soc Nephrol. 2002;13:2152–2159
- Kim YS, Moon JI, Kim DK, Kim SI, Park K. Ratio of donor kidney weight to recipient body weight as an index of graft function. Lancet. 2001;357:1180–1181
- Nicholson ML, Windmill DC, Horsburgh T, Harris KP. Influence of allograft size to recipient body-weight ratio on the long-term outcome of renal transplantation. Br J Surg. 2000;87:314–319
- Kokado Y, Moutabarrik A, Kameoka H, et al. Impact of donor renal function in kidney transplantation. Transplant Proc. 1993;25:2267–2269
- Nordén G, Lennerling A, Nyberg G. Low absolute glomerular filtration rate in the living kidney donor: A risk factor for graft loss. Transplantation. 2000;70:1360–1362
- McGee J, Magnus JH, Islam TM, et al. Donor-recipient gender and size mismatch affects graft success after kidney transplantation. J Am Coll Surg. 2010;210:718–725
- Kim SJ, Gill JS. H-Y incompatibility predicts short-term outcomes for kidney transplant recipients. J Am Soc Nephrol. 2009;20:2025–2033
- Poggio ED, Hila S, Stephany B, et al. Donor kidney volume and outcomes following live donor kidney transplantation. Am J Transplant. 2006;6:616–624
- Lee CK, Yoon YE, Choi KH, et al. Clinical implications for graft function of a new equation model for the ratio of living donor kidney volume to recipient body surface area. Korean J Urol. 2013;54:870–875
- Krleza-Jerić K, Lemmens T. 7th revision of the Declaration of Helsinki: Good news for the transparency of clinical trials. Croat Med J. 2009;50:105–110
- Chinese Society of Transplantation and Chinese Urological Association Renal Transplantation Group. The consensus of Bo’ao Symposium on “Concerning Living Kidney Transplantation”. Chin J Transplant (Chin). 2008;29:179
- Mosteller RD. Simplified calculation of body-surface area. N Engl J Med. 1987;317:1098
- Giuliani S, Gamba PG, Chokshi NK, Gasparella P, Murer L, Zanon GF. The effect of donor/recipient body surface area ratio on outcomes in pediatric kidney transplantation. Pediatr Transpl. 2009;13:290–299
- Levey AS, Bosch JP, Lewis JB, Greene T, Rogers N, Roth D. A more accurate method to estimate glomerular filtration rate from serum creatinine: A new prediction equation. Modification of Diet in Renal Disease Study Group. Ann Intern Med. 1999;130:461–470
- Nyengaard JR, Bendtsen TF. Glomerular number and size in relation to age, kidney weight, and body surface in normal man. Anat Rec. 1992;232(2):194–201
- Kasiske BL, Snyder JJ, Gilbertson D. Inadequate donor size in cadaver kidney transplantation. J Am Soc Nephrol. 2002;13(8):2152–2159