
Abstract
Introduction: This prospective observational study aimed to assess the relevance of serial postoperative serum TNF-α, TNFR1 and TNFR2 measurements for predicting graft function and acute rejection episodes (AR) after transplantation. Materials and methods: We studied 50 kidney transplant recipients (31 female, 19 male; mean age: 38.36 ± 12.88). Blood samples were collected immediately before and after surgery at day 7, month 1 and month 3. Serum TNF-α, TNFR1 and TNFR2 levels were measured by ELISA using a commercial kit (Invitrogen ELISA). Serum cystatin-C levels were measured by particle-enhanced immunonephelometric method. Glomerular filtration rate (GFR) was estimated by Chronic Kidney Disease-Epidemiology (CKD-EPI) equation. Patients were assigned to their transplant outcomes in terms of acute rejection [AR(+) and AR(−)] and slow (SGF) or immediate graft function (IGF). Results: Among 50 recipients, six had AR(+) and 44 had AR(−), depending on graft function: 17 had SGF and 33 had IGF. Serum creatinine, cystatin-C, TNF-α, TNFR1 and TNFR2 levels demonstrated consistent significantly decreases after transplantation while GFR values had consistent increases (p = 0.001). Pretransplant levels were not statistically different between AR(+) and AR(−) groups (TNF-α: 30.79 ± 5.96 vs. 27.95 ± 2.43 pg/mL, TNFR1: 55.96 ± 21.6 vs. 40.52 ± 7.41 ng/mL, TNFR2: 58.31 ± 8.06 vs. 50.9 ± 3.34 ng/mL, respectively) (p > 0.05). Serum TNF-α, TNFR1 and TNFR2 levels on day 7 and month 1 were also significantly higher in AR(+) group compared to AR(−) (p = 0.012, p = 0.049 for TNF-α, p = 0.001, p = 0.002 for TNFR1, p = 0.001, p = 0.002 for TNFR2). Conclusions: Our preliminary findings suggest that serum TNF-α, TNFR1 and TNFR2 levels might be considered useful markers of evaluating graft function after renal transplantation.
Introduction
Kidney transplantation is the best choice for the treatment of end-stage kidney disease but rejection is the major complication after transplantation. In spite of potent immunosuppression, acute rejection continues as major cause of graft dysfunction. Although renal allograft biopsy is the reference standard for diagnosis of rejection, due to its invasive nature, new clinical and biochemical diagnostic markers are still explored.Citation1–4
TNF-α is a functional 26-kDa homotrimeric transmembrane protein, which is cleaved by a disintegrin and metalloprotease protein-17 (ADAM-17) and released into the circulation as a functional 17-kDa soluble form.Citation5 TNF-α mediates a lot of immunologic and inflammatory responses including the amplification of other proinflammatory cytokines and chemokines that contribute to local recruitment and activation of leucocytes.Citation6 TNF-α promotes T-cell activation, the key reaction leading to allograft rejection. Biological activity of TNF-α exists by binding two different receptors; TNFRI (TNFRSF1A or p55) and TNFR2 (TNFRSF1B or p75).Citation7 Binding of TNF-α to the TNFR1 or TNFR2 activates signaling pathways controlling inflammatory, immune and stress responses, as well as host defense and apoptosis.Citation5–7
In healthy subjects, TNF-α and TNFR2 are usually not present in the kidneys, whereas TNFR1 can be found in normal glomerular endothelium.Citation8,Citation9 After stimulation (e.g., with lipopolysaccharide, interleukin (IL)-1α) and during inflammation, TNF-α and its receptors are expressed in glomerular and tubular cells.Citation10 TNFRs are differentially regulated in human rejecting renal transplants. Multiple studies have suggested the role of TNFRs in the development of acute kidney transplant rejection.Citation11–13 Given these findings indicating that TNF-α and its receptors impair immune regulation, we examined whether the association between graft function and acute rejection attacks with serum levels of TNF-α, TNFR1 and TNFR2 in renal transplant recipients.
Materials and methods
Fifty living-donor kidney transplant recipients who were at least 18 years old were recruited into the study from September 2010 to June 2011 in our transplant center. The study was conducted in accordance with the ethical standards of our Institutional Ethics Committee and with the Helsinki Declaration, and all patients provided written informed consent. Patients who had transplanted from a cadaveric donor, malignancy, combined (pancreas or liver) transplantation, graft failure related to surgical causes were excluded.
General characteristic and demographic features of all patients and donors are indicated in . All patients were classified regarding to graft function as IGF or SGF. SGF (n = 17) was defined as reduction in serum creatinine by <70% on day 7 and IGF (n = 33) as ≥70%. We also classified all the patients regarding to acute rejection episodes (AR(+) n = 6, AR(−) n = 44). Acute rejection episodes were recorded during the first 30 days post-transplantation. The diagnosis of acute rejection was confirmed with biopsy and Banff-Classification was used. Acute rejection of renal allografts is considered as a T cell-mediated process (acute cellular rejection) with biopsy.
Table 1. General characteristics and demographics features of patients and donors.
The blood samples were collected immediately before and after surgery at day 7, month 1 and month 3. The samples were centrifuged at 4000 rpm for 5 min. The sera were stored until analysis day at −80 °C. Serum creatinine measurement was done by using original commercially kits in the Cobas 8000 auto analyzer (Roche Diagnostics, Mannheim, Germany). The results were expressed as mg/dL. Serum cystatin-C levels were measured by using the particle-enhanced immunonephelometric (PENIA) method in a BN II Nephelometer (Siemens AG, Erlangen, Germany). The results were given as mg/L. Serum TNF-α, sTNFR1 and sTNFR2 levels were measured by Enzyme-Linked Immunosorbent Assay (ELISA) method (human TNF-α KHC 3011, human TNFR1 KAC 1761, human TNFR2 KAC 1771, Invitrogen Diagnostics, Life Technologies, Grand Island, NY).
Estimated glomerular filtration rates (eGFRs) were calculated using the “Chronic Kidney Disease Epidemiology” (CKD-EPI) formula.Citation14
All statistical analyses were done with SPSS version 20.0 and a significance level of 0.05 was considered. Kolmogorov–Smirnov test was performed to assess deviation from normal distribution. Quantitative variables were summarized as mean and standard deviation (SD), or as median. Differences among all parameters at different time points were assessed by ANOVA, Student’s t-test or the Mann–Whitney's U test for quantitative variables. The analysis of correlation was done by Spearman or Pearson test. Receiver-operating characteristics analysis was performed to estimate the sensitivities and specificities of serum TNF-α, TNFR1 and TNFR2 (as well as serum creatinine and cystatin-C) to evaluate of graft function and acute rejection episodes. The optimal cut-off points were determined by maximizing the sum of sensitivity and specificity.
Results
General patient characteristics and demographic features are shown in . summarizes the serum creatinine, cystatin-C, TNF-α, TNFR1 and TNFR2 levels in patients with and without AR, IGF and SGF. The changes in serum biomarkers and eGFR values in patients with and without AR, IGF and SGF, before and after transplantation are also graphically displayed in . Serum creatinine levels were higher in IGF group than SGF group before transplantation (p = 0.001) while more significantly lower (p = 0.03) at month 1. Serum creatinine levels were also higher in the AR(+) group than the AR(−) group in only post-transplant 7th day. No significant differences between other periods () were observed. Serum cystatin-C levels were significantly higher in SGF and AR(+) groups than IGF and AR(−) groups (p = 0.03 and p = 0.009, respectively) in only post-transplant 7th day (). Serum TNF-α and TNFR1 levels were similar between all periods. Serum TNFR2 levels were significantly higher in the SGF group compared with the IGF group (p = 0.046) at month 3. No significant differences between other periods were observed. Serum TNF-α, TNFR1 and TNFR2 levels were found as significantly increased in the AR(+) group than the AR(−) group on post-transplant 7th day and month 1 (for TNF-α; p = 0.012 and p = 0.049, for TNFR1; p = 0.001 and 0.002, for TNFR2; p = 0.001 and 0.001 respectively) (). We did not observe any significant differences between other periods. Glomerular filtration rates which are calculated by CKD-EPI formula were significantly increased in the IGF and AR(−) groups ( and ).
Figure 1. Comparison of serum creatinine levels before and after transplantation at day 7, month 1 and month 3. Patients (n = 50) were classified to their graft functions and acute rejection episodes.
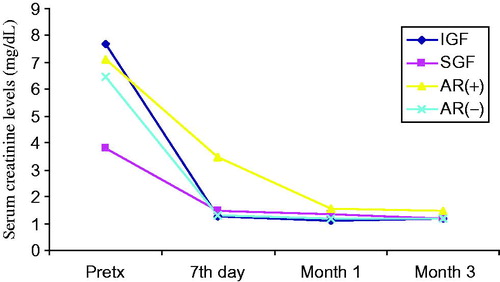
Figure 2. Comparison of serum cystatin-C levels before and after transplantation at day 7, month 1 and month 3. Patients (n = 50) were classified to their graft functions and acute rejection episodes.
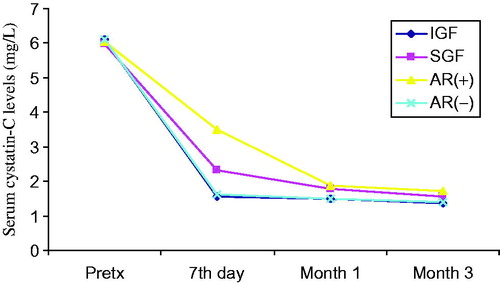
Figure 3. Comparison of serum TNF-alpha levels before and after transplantation at day 7, month 1 and month 3. Patients (n = 50) were classified to their graft functions and acute rejection episodes.
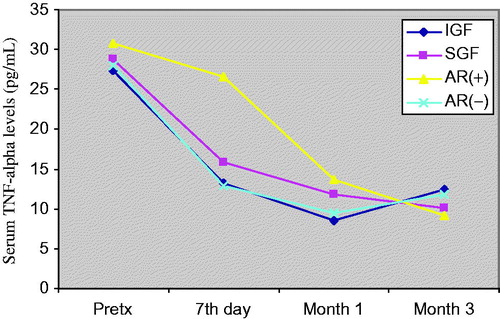
Figure 4. Comparison of serum TNFR1 levels before and after transplantation at day 7, month 1 and month 3. Patients (n = 50) were classified to their graft functions and acute rejection episodes.
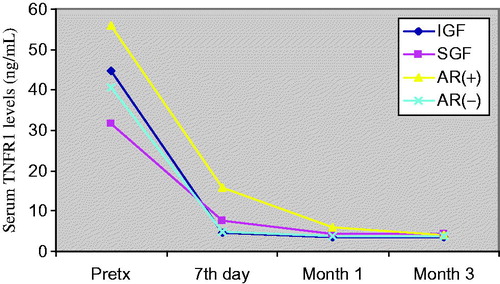
Figure 5. Comparison of serum TNFR2 levels before and after transplantation at day 7, month 1 and month 3. Patients (n = 50) were classified to their graft functions and acute rejection episodes.
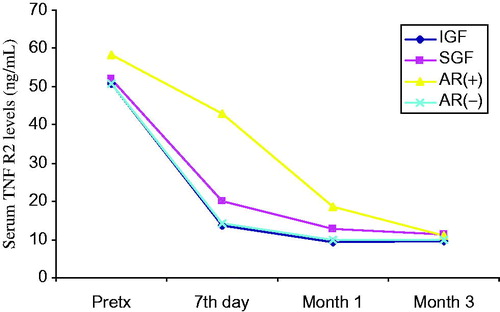
Figure 6. Comparison of eGFR values before and after transplantation at day 7, month 1 and month 3. Patients (n = 50) were classified to their graft functions and acute rejection episodes.
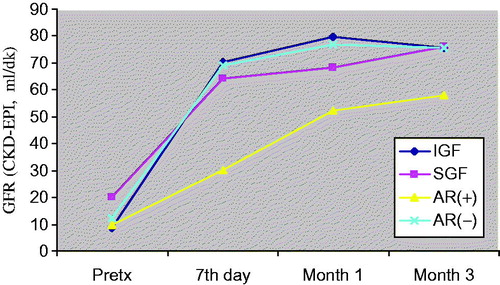
Table 2. Serum creatinine, cystatin-C, TNF-α, TNFR1, TNFR2 levels and eGFR values before and after transplantation at day 7, month 1 and month 3.
Before the transplantation, serum cystatin-C levels were significantly correlated with TNFR1 and TNFR2 (r = 0.698, r = 0.598; p < 0.05 respectively). At the day 7, serum creatinine levels were found as significantly correlated with TNFR1 and TNFR2 (r = 0.331, r = 0.367; p < 0.05, respectively) while cystatin-C levels exhibit more strongly and significantly correlations with these parameters (r = 0.412, r = 0.451; p < 0.05, respectively). There were positive correlations between serum creatinine, cystatin-C and TNFR1 levels (r = 0.442, r = 0.429; p < 0.05, respectively) at month 1 after transplantation. In the same period, significant correlations between creatinine, cystatin-C and TNFR2 were found (r = 0.396, r = 0.466; p < 0.05, respectively). Similarly, PostTx at month 3, significant correlations between creatinine, cystatin-C and TNFR1 levels were also found (r = 0.281, r = 0.375; p < 0.05, respectively). In the same period, we also observed significant positive correlations between serum creatinine, cystatin-C and TNFRII (r = 0.471, r = 0.409; p < 0.05, respectively).
To assess the diagnostic values of serum TNF-α, TNFR1 and TNFR2 (as well as serum creatinine and cystatin-C) for the evaluation of graft function at different time points (at day 7, month 1 and month 3 after transplantation), ROC curves were generated by plotting the sensitivity versus 1-specificity. For this reason, a cut-off level of GFR was chosen as 60 mL/min. However, we found that only cystatin-C, creatinine and TNFR2 levels could significantly detect the GFR changes at month 3. Only significant findings are given in and . Plotting GFR and ROC curves for cystatin-C, creatinine, TNF-α, TNFR1, TNFR2 demonstrated that the AUC of cystatin-C was not greater than that of creatinine and TNFR2 at a cut-off level of GFR of 60 mL/min (AUC for cystatin-C: 0.817, p = 0.001, AUC for serum creatinine: 0.892 p = 0.001, AUC for TNFR2: 0.833 p = 0.001) at month 3 (). The comparison of ROC curves of the parameters according to the acute rejection episodes is demonstrated in . also shows the performance of TNFRs at different times of PostTx. As shown there, especially at PostTx day 7, the TNFR1 and TNFR2 present higher AUC values than cystatin-C and creatinine for the determination of acute rejection.
Table 3. Performance of serum creatinine, cystatin-C and TNFR2 for the determination of GFR changes at month 3.
Table 4. Performance of serum creatinine, cystatin-C, TNF-α, TNFR1 and TNFR2 for the determination of acute rejection at day 7 and comparisons between TNF-α, TNFR1 and TNFR2 at month 1.
Discussion
Sensitive and rapid assessment of changes in graft function is of primary importance in renal transplant recipients in the early post-transplantation period. We have shown that elevated levels of TNFR1 and TNFR2 were significantly associated with graft function at day 7 and month 1 after transplantation and especially serum TNFR2 levels may be predictive of acute rejection together with serum creatinine and cystatin-C.
Recent studies have suggested that serum cystatin-C concentrations paralleled those of creatinine and might be a potential better marker of GFR than creatinine in renal transplant patients.Citation1,Citation4,Citation15 In this study, we found that both of serum creatinine and cystatin-C levels significantly decreases after transplantation in all groups. We performed ROC analysis to assess the potentials of creatinine and cystatin-C for diagnosing of AR and accurate determination of GFR changes. We generally found slightly better AUC values for serum creatinine than cystatin-C for the determination of AR and GFR change. In renal transplant recipients, the cystatin-C exhibits similar diagnostic characteristics like serum creatinine.Citation15,Citation16 Our study suggests that serum cystatin-C monitoring during the follow-up of renal transplant recipients would reveal the role of this parameter to detect rejection at an early stage.
Although the serum creatinine and cystatin-C levels which reflect graft function after transplantation have been widely used, multiple studies have also investigated the potential value of individual cytokine profiles to determinate graft function and predict acute rejection episodes. High TNF production found associated with a higher risk of rejection and poor graft function in kidney transplant recipients.Citation17 However, some reports present conflicting data exist as to whether serum/urine TNF levels reflect reliably the rejection and graft function. The effect of TNF on graft outcome is influenced by the two TNFRs, which lead to signaling cascades that induce expression of many genes involved in inflammation.Citation9,Citation12 Although the limited number of acute rejection patients, our findings consistent with previous researches showing that serum TNF-α, TNFR1 and TNFR2 concentrations are elevated during acute rejection episodes. Wiggins et al. reported that TNF-α levels immediately decreased following transplantation. They purposed this is probably related to the bolus doses of methylprednisolone administered intra-operatively.Citation18 It is known that glucocorticoids suppress TNF-α gene transcription.Citation19 On the other hand they also reported higher levels of TNF in patients with acute rejection than non-rejecting patients.Citation18 In our study, we found that serum TNF-α, TNFR1 and TNFR2 levels significantly decreases after transplantation in all groups but the levels were higher in the AR(+) group than the AR(−) group confirming the results by Wiggins et al.Citation18 During an acute cellular rejection, the influx of lymphocytes in the renal interstitium is accompanied by the detection of epithelial cells expressing upregulated TNF-α converting enzyme (TACE), stimulating the local shedding of TNFR2.Citation9 TNFR2 protein is synthesized by epithelial cells in situ and is mainly located on the cytoplasmic membrane in an acute cellular rejecting kidney.Citation9 Furthermore, TNFR2 seems to mediate preferentially early effects of TNF-α in acute allograft rejection as a significantly lower TNFR2 expression has been observed in biopsies with chronic allograft lesions. The soluble TNFR levels have been reported to be increased during acute rejection.Citation20–24 In accordance with these studies, we observed significant elevation of serum TNFR2 levels in acute rejection. Regarding ROC analysis for estimating acute rejection, serum TNFR1 and TNFR2 levels determined on 7th day and first month have highest sensitivity and specificity in our study. Although some reports suggested that TNFR2 may antagonize the TNF-α, we observed both of high TNF-α and TNFR2 levels in our study. We speculate that these receptors play important roles in renal graft dysfunction and the pathogenesis of graft rejection. Based on these findings, especially serum TNFR2 levels may be predictive of acute rejection together with serum creatinine and cystatin-C. The limited number of acute rejection patients is a key limitation to our study. Further studies are needed to confirm our findings using larger transplant cohorts. If these biomarker levels in the early post-transplant period can be shown to accurately determine graft function, they could be useful as surrogate markers. These researches may provide support for the early detection of acute rejection and will facilitate future anti-TNF therapy with specific antibodies and neutralizing TNFR2 might be beneficial in the treatment of the renal transplant recipients.
Declaration of interest
There is not any conflict of interest between the authors. This research was granted by Akdeniz University, Scientific Research Found (Project number is: 2010.04.0103.024).
References
- Kocak H, Oner-Iyidogan Y, Gurdol F, Kocak T, Nane I, Genc S. Cystatin-C and creatinine as indices of glomerular filtration rate in the immediate follow-up of renal transplant patients. Clin Exp Med. 2005;5(1):14–19
- Akbas SH, Yavuz A, Tuncer M, et al. Serum cystatin C as an index of renal function in kidney transplant patients. Transplant Proc. 2004;36(1):99–101
- Lima JR, Salgado JV, Ferreira TC, Oliveira MI, Santos AM, Salgado Filho N. Cystatin C and inflammatory markers in kidney transplant recipients. Rev Assoc Med Bras. 2011;57(3):347–352
- Liu J. Evaluation of serum cystatin C for diagnosis of acute rejection after renal transplantation. Transplant Proc. 2012;44(5):1250–1253
- Wang J, Al-Lamki RS. Tumor necrosis factor receptor 2: Its contribution to acute cellular rejection and clear cell renal carcinoma. Biomed Res Int. 2013; 2013;2013:Article ID 821310, 11 pages
- Fiers W. Tumor necrosis factor: Characterization at the molecular, cellular and in vivo level. FEBS Lett. 1991;285(2):199–212
- Rothe J, Gehr G, Loetscher H, Lesslauer W. Tumor necrosis factor receptors-structure and function. Immunol Res. 1992;11(2):81–90
- Bradley JR, Thiru S, Pober JS. Disparate localization of 55-kd and 75-kd tumor necrosis factor receptors in human endothelial cells. Am J Pathol. 1995;146(1):27–32
- Speeckaert MM, Speeckaert R, Laute M, Vanholder R, Delanghe JR. Tumor necrosis factor receptors: Biology and therapeutic potential in kidney diseases. Am J Nephrol. 2012;36(3):261–270
- Baud L, Ardaillou R. Tumor necrosis factor in renal injury. Miner Electrolyte Metab. 1995;21:336–341
- Morel D, Normand E, Lemoine C, et al. Tumor necrosis factor alpha in human kidney transplant rejection analysis by in situ hybridization. Transplantation. 1993;55(4):773–777
- Al-Lamki RS, Wang J, Skepper JN, Thiru S, Pober JS, Bradley JR. Expression of tumor necrosis factor receptors in normal kidney and rejecting renal transplants. Lab Invest. 2001;81(11):1503–1515
- Sonkar GK, Singh S, Sonkar SK, Singh U, Singh RG. Evaluation of serum interleukin 6 and tumour necrosis factor alpha levels, and their association with various non-immunological parameters in renal transplant recipients. Singapore Med J. 2013;54(9):511–515
- Kidney Disease: Improving Global Outcomes (KDIGO) CKD Work Group. KDIGO 2012 clinical practice guideline for the evaluation and management of chronic kidney disease. Kidney Int Suppl. 2013;3:1–150
- Krishnamurthy N, Arumugasamy K, Anand U, Anand CV, Aruna V, Venu G. Serum cystatin C levels in renal transplant recipients. Indian J Clin Biochem. 2011;26(2):120–124
- Risch L, Blumberg A, Huber A. Rapid and accurate assessment of glomerular filtration rate in patients with renal transplants using serum cystatin C. Nephrol Dial Transplant. 1999;14:1991–1996
- Hoffmann U, Bergler T, Rihm M, et al. Upregulation of TNF receptor type 2 in human and experimental renal allograft rejection. Am J Transplant. 2009;9(4):675–686
- Wiggins MC, Bracher M, Mall A, Hickman R, Robson SC, Kahn D. Tumour necrosis factor levels during acute rejection and acute tubular necrosis in renal transplant recipients. Transpl Immunol. 2000;8(3):211–215
- Joyce DA, Steer JH, Abraham LJ. Glucocorticoid modulation of human monocyte/macrophage function: Control of TNF-alpha secretion Inflamm Res. 1997;46(11):447–451
- Halwachs G, Tiran A, Reisinger EC, et al. Serum levels of the soluble receptor for tumor necrosis factor in patients with renal disease. Clin Invest. 1994;72(6):473–476
- Lambert C, Berthoux P, Vindimian M, Hacini J, Berthoux F. Natural serum TNF antagonists in end-stage renal failure and following renal transplantation. Nephrol Dial Transplant. 1994;9(12):1791–1796
- Diller R, Winde G, Kötting S, Senninger N, Dietl KH, Spiegel HU. sTNF-RII: Is it useful for the early diagnosis of rejection and for prognosis after renal transplantation? Transplant Int. 2002;15(7):335–340
- Reinhold SW, Straub RH, Krüger B, et al. Elevated urinary sVCAM-1, IL6, sIL6R and TNFR1 concentrations indicate acute kidney transplant rejection in the first 2 weeks after transplantation. Cytokine. 2012;57(3):379–388
- Keil M, Pec MK, Schenn G, et al. Value of serum soluble tumour necrosis factor concentrations in the diagnosis and prognosis of renal graft rejection. Nephrol Dial Transplant. 1994;9(7):815–819