
Abstract
Aim: This study investigated the mechanisms involved in intrauterine growth restriction (IUGR). Methods: The IUGR model was established by feeding pregnant SD rats a low-protein diet. Protein expression and phosphorylation were detected using Western blot and/or immunohistochemistry. Cell apoptosis was detected by TUNEL staining. The MDM2 mRNA expression was measured by real-time PCR. Results: Pups from the IUGR group had significantly lower body (7th day, 2 months) and kidney weights (1st day, 7th day, 2 months) compared to pups from the control group (p < 0.01). The glomeruli number in IUGR pups was significantly less than that in the control pups at 2 and 3 months after birth (p < 0.01). p53 protein level and p53 phosphorylation at Ser15 were time-dependently decreased in the kidney at 1st day, 7th day, 21st day, 2 months and 3 months, but their levels in the kidney of the IUGR pups was significantly higher than that in control pups at each time point (p < 0.05, p < 0.01, or p < 0.001). Significantly more positive p21 staining was observed in IUGR pups than in control pups at each time point. Real-time PCR of MDM2 mRNA expression showed no significant difference between IUGR and control pups (p > 0.05). Significant apoptosis was observed in the kidneys of IUGR pups compared to control pups. Conclusion: Malnutrition-induced IUGR may be associated with the activation of p53–p21 signaling in the kidney.
Introduction
Current epidemiologic and animal studies have suggested that intrauterine growth restriction (IUGR) is a risk factor in adult diseases, such as hypertension and type-2 diabetes mellitus.Citation1 The “developmental origins of adult disease” hypothesis, often called “the Barker hypothesis”, proposes that diseases that manifest in adult or late life may originate from malnutrition during fetal development or infancy.Citation2 Nutritional programming, as hypothesized by Lucas, suggests that malnutrition in the key stages of fetal development will result in long-term effects on the function of organs.Citation3 Gestational protein undernutrition causes fetal adaption changes in the levels of enzymes and receptors as well as alterations in signal transduction systems that promote fetal survival. However, the adaptive changes are lifelong changes that persist even when nutrition is normalized after birth.Citation4
The kidney is extremely susceptible to IUGR. Previous study in animals with IUGR has observed small kidneys and reduced numbers of nephrons in proportion to body weight.Citation5 The inborn decrease in nephron numbers may lead to a compensatory increase in glomerular blood flow in an attempt to maintain a normal overall glomerular filtration rate. According to the hyperfiltration hypothesis explained by Brenner and Bagby,Citation6 this leads to glomerular hypertension and hypertrophy, which causes systemic hypertension. However, the question of how the reduction in nephron number develops in fetal kidney underlying IUGR has not been adequately answered.
The tumor suppressive gene p53 is widely known as a key regulator of apoptosis by acting both as an active component of the apoptosis cascade and as a transcription factor.Citation7 In response to stress, hypoxia and DNA damage, p53 is activated through various post-translational modifications, such as phosphorylation, acetylation, methylation and ubiquitination.Citation8,Citation9 Phosphorylation impairs the ability of MDM2 to bind p53, promoting both the accumulation and activation of p53. The activated p53 is phosphorylated at multiple amino acid residues in vivo, including serine 15. The potential roles of p53 in embryonic development and organ formation remain controversial. p53 has recently been proposed as one of the key genes regulating kidney development.Citation10 An increase in p53 protein level and apoptosis has been observed in the lung, placenta and other tissues and organs of humans and animals with IUGR.Citation11 We hypothesize that IUGR caused by intrauterine malnutrition may alter p53 gene expression and p53 activity in rat kidney.
In this study, a dynamic observation of growth and p53 expression and phosphorylation in the kidneys of rat pups that experienced IUGR from the neonatal period to adulthood was performed.
Methods and materials
Animals
Sixteen male and female SD rats at the age of 3 months (weighing 250–300 g) were provided by the Animal Center, Central South University. All animal experiments were conducted under an approved protocol from the Animal Care and Use Committee, Central South University and performed in accordance with the animal care guidelines of the Chinese Council. One male and one female SD rat were housed together in one cage at 8:00 pm each day. The next day, rats were checked for vaginal plugs. The day of the discovery of a vaginal plug was recorded as day 1 of pregnancy.
Animal models of IUGR
The IUGR models were established as previously described.Citation12 A pup was defined as having experienced IUGR when its body weight is less than the mean birth weight of pups in the control group minus two standard deviations. Briefly, the pregnant female rats were randomly divided into two groups: normal control and IUGR group (N = 8). The pregnant rats in the normal control group were fed a normal diet containing 21% protein during pregnancy and lactation, and the pups after weaning were also fed a normal diet. The pregnant rats in the IUGR group were fed a low protein diet containing only 10% protein during pregnancy followed by a normal diet containing 21% protein during lactation. The pups after weaning in the IUGR group were fed normal food containing 21% protein. Both the maternal rats and the newborn pups were excluded from experiments on day 1 if the pups number less than 8 or more than 14 per litter. For maternal rats that delivered 8–14 pups per litter, only eight pups from different mothers were randomly selected for the experiments.
Body and kidney weight
The body weights of newborn pups were recorded within 4 h if they were born during the day or at 8:00 am the next day if they were born during the night. The body weights of pups at 7th day, 21st day, 2 months and 3 months were recorded at 8:00 am daily. The kidney weight was recorded right after the rat was euthanized. One kidney was frozen at −80 °C, while the other kidney was fixed in 10% formalin.
Renal glomeruli measurement
The number of renal glomeruli was measured using Alcian blue method as previously described.Citation13,Citation14 Briefly, rats were given general anesthesia (10% chloral hydrate) and then 5% Alcian blue 8GX was injected via tail vein at a speed of 0.02 mL/min/100 g of body weight for 10 min. Rats were then euthanized and the right kidney was removed, cut into small pieces and then rinsed in 1% NH4CI for 2 h at room temperature, followed by 50% HCI for 90 min at 37 °C with gentle shaking. After centrifugation at 1000 g, the pellet was resuspended in 10 mL distilled water. The renal glomeruli from 10 aliquots of 20 µL resuspended pellets were counted under a microscope and then averaged.
Western blotting
Kidneys were homogenized in ice-cold RIPA buffer containing protease and phosphatase inhibitor cocktails (Millipore, Billerica, MA). Total protein (30 µg) was separated on 12% SDS polyacrylamide gels and transferred onto PVDF membranes (Millipore, Billerica, MA). The membranes were blocked with blocking buffer for 1 h at room temperature (RT). The blocked membranes were incubated with anti-p53 (1:1000), anti-phospho-p53 Ser15 (1:1000) or β-actin (Cell Signaling Technology, Danvers, MA, 1:1000) primary antibody for 2 h at RT. After washing, membranes were incubated with HRP-conjugated secondary antibody (1:1000) for 1 h at RT. Protein bands were visualized with the ECL substrate (Millipore, Billerica, MA). Bands were scanned using Quantity One software.
Immunohistochemistry
Four-micrometer-thick sections were cut from routinely paraffin-embedded kidney tissues. The deparaffinized sections were then incubated with primary antibody for 1 h, followed by secondary antibody for 30 min. Substrate was added to the sections for 30 min followed by DAB staining and hematoxylin counter-staining. The positive staining was determined mainly by a brownish-yellow color in the cytoplasm and nucleus of the cells. Rabbit anti-rat p53, anti-phospho-p53 (Ser15) primary antibody, and HRP-labeled goat anti-rabbit second antibody were purchased from Cell Signaling Technology (Danvers, MA). The anti-p21 primary antibody was purchased from Abcam (Cambridge, MA).
HE and TUNEL staining
The hematoxylin and eosin staining was performed according to the manufacture’s manual. The in situ cell death detection kit was purchased from Roche Molecular Biology (Mannheim, Germany) and performed according to the user manual.
Real-time reverse transcription quantitative PCR
Total RNA was isolated from kidney tissue of pups using Trizol reagent (Life Technologies, Carlsbad, CA) according to the user manual. Reverse transcription was performed using One Step PrimeScript® RT kit (TAKARA, Japan). Real-time quantitative PCR was performed using SYBR® Premix Ex Taq™ II (TAKARA, Japan). The rat MDM2 gene was amplified using forward primer: 5′-CAGCGTCGGAACAAGAGACTC-3′ and reverse primer: 5′-CAGGTCACTCCCACCTTCAGGC-3′. The β-actin gene was amplified as an internal control using forward primer: 5′-GGAGATTACTGCCCTGGCTCCTA-3′ and reverse primer: 5′-GACTCATCGTACTCCTGCTTGCTG-3 as an internal control. PCR data analysis was performed using the comparative ΔΔCT method.
Statistical analysis
Data were presented as mean ± SD and analyzed using Statistical Product and Service Solutions, version 17.0 (SPSS). Statistical differences for metering data were analyzed using unpaired Student’s t test. χ2 Test was used to find statistical difference of counting data. Pearson correlation was used for correlation analysis. A p < 0.05 was considered statistically significant.
Results
Animal models
Sixteen pregnant female rats delivered pups 20–23 days after the day vaginal plugs were found. No abortion was observed. No significant difference in the average number of pups was observed between control and IUGR groups. IUGR was established in maternal rats who received a low protein diet. The average body weight of neonatal pups in the IUGR group (5.59 ± 0.55 g) was significantly lowered compared with in the control group (6.95 ± 0.64 g) (p < 0.01). The rate of rats developing IUGR was significantly higher in the IUGR group than in the control group. No significant differences in perinatal mortality and gender of pups were observed between the two groups ().
Table 1. Comparison of delivery and general natures of newborn pups.
Comparison of body and kidney weight
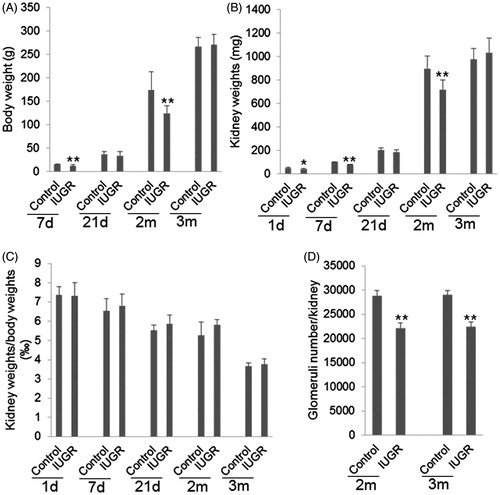
Significantly lower body weight was observed in pups from the IUGR group at 7th day and 2 months compared to pups from the control group (, p < 0.01). Significantly lower kidney weight was observed in pups from the IUGR group at 1st day, 7th day and 2 months compared to pups from the control group (, p < 0.01). However, no significant difference in the ratio of kidney/body weight was observed between the two groups at any time point (, p > 0.05).
Figure 1. Comparison of body weight, kidney weight and renal glomeruli number. (A) Comparison of body weight. (B) Comparison of kidney weight. (C) Comparison of the ratio of kidney weight/body weight. (D) Comparison of glomeruli number. IUGR: intrauterine growth restriction. *p < 0.05, **p < 0.01 versus control. N = 8.
Comparison of renal glomeruli
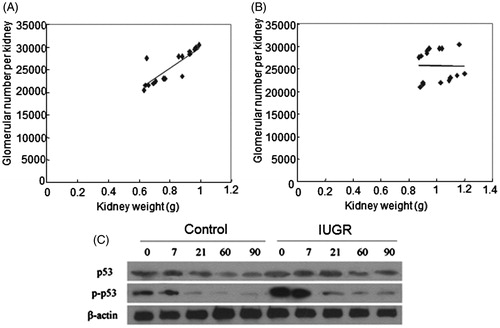
The glomeruli number of each kidney in pups of the two groups was compared at 2 and 3 months after birth. The glomeruli number in IUGR pups was significantly less than that in the control pups at 2 and 3 months after birth (, p < 0.01). The correlation analysis showed that the glomeruli number positively correlated with kidney weight at 2 months after birth (, r = 0.842, p = 0.000). In contrast, no significant correlation was observed between glomeruli number and kidney weight at 3 months after birth (, r = −0.016, p = 0.953).
Figure 2. Correlations between kidney weights and glomerular numbers and Western blot of p53 and p53 Ser15 protein expression. Correlations between kidney weights and glomerular numbers at 2 months (A) and 3 months (B) after birth. Significant correlation between kidney weight and glomerular number of the right kidney was observed at 2 months of age (r = 0.842, p = 0.000) (A), but not at 3 months of age (r = −0.016, p = 0.953) (B). Correlation analysis included samples from two groups at the same time point. N = 16. (C) Western blot of p53 protein expression and p53 phosphorylation at serine 15. β-Actin was used as a loading control. 0, 7, 21, 60 and 90 represent at birth, 7th day, 21st day, 60th day and 90th day after birth.
p53 expression in the kidney of pups
Western blot () showed that p53 protein (, p < 0.01 or p < 0.001) and p53 phosphorylation (, p < 0.01 or p < 0.001) levels were significantly higher in IUGR pups than control pups at all tested time points. Immunohistostaining showed that cells with positive p53 (, p < 0.01) and phospho-p53 Ser15 (, p < 0.01 or p < 0.001) staining were time-dependently decreased at 1st day, 7th day, 21st day, 2 months and 3 months in both the groups. Significantly more p53 and phospho-p53 Ser15 positive cells were observed in the kidney of IUGR pups than that in the control pups at all tested time points. The ratio of phospho-p53 Ser15/p53 positive cells was significantly higher in IUGR pups than in control pups at all tested time points (, p < 0.05 or p < 0.001).
Figure 3. H&E and immunohistochemical staining. Original magnification × 400. (A) Immunotaining of p53 protein. Positive reaction was mainly localized in the cytoplasm of the renal cortex (brown staining, indicated by arrows). (B) Immunostaining of p53 Ser15 protein. Positive reaction was mainly localized in the nucleus of stromal and tubule cells in the outer cortex of the kidney (brown staining, indicated by arrows). (C) Immunostaining of p21 protein. Positive reaction was localized in the cytoplasm and nucleus of the renal cortex (brown staining, indicated by arrows). Positive p53, p53 Ser15 and p21 staining was observed in the kidney tissues of both the control and IUGR pups 1st, 7th, 21st day after birth. (D) HE staining. The glomeruli number was decreased in 2 and 3 months old IUGR pups. In contrast, the glomeruli volume was enlarged in the kidney tissues from 3 months old IUGR pups. (E) TUNEL staining. Large amount of apoptotic nucleus (brown staining, indicated by arrows) were observed in the kidney tissues of 1 day, 7 days and 21 days old pups in two groups, but few apoptotic nucleus were observed in 2 and 3 months old pups. Obviously more TUNEL positive nucleus were observed in the kidney tissues of IUGR pups compare to pups in control group at 1 day, 7 days and 21 days after birth.
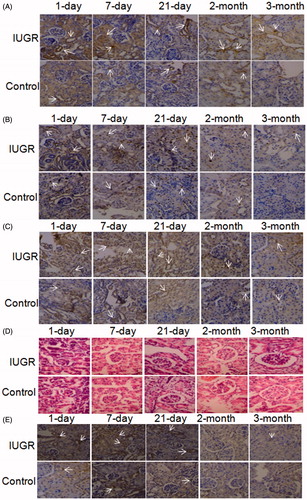
Table 2. Comparison of p53 protein levels measured by Western blot ( ± S).
± S).
Table 3. Comparison of p53 Ser15 levels measured by Western blot ( ± S).
Table 4. Comparison of p53 Ser15/p53 ratio measured by Western blot ( ± S).
p21 protein and MDM2 mRNA expression in the kidney of pups
Immunohistostaining showed that p21 positive cells were time-dependently decreased at 1st day, 7th day, 21st day, 2 months and 3 months in both groups (). Significantly more p21 positive cells were observed in IUGR pups than control pups at all tested time points (). MDM2 mRNA expression was detected by real-time PCR. No significant difference in MDM2 mRNA expression was observed between IUGR and control pups at any time point ().
Table 5. Comparison of MDM2 mRNA expression detected by real-time PCR ( ± S).
Histological alterations in the kidney of pups
Hematoxylin and eosin staining showed that the glomeruli number was lower in IUGR pups at 2 and 3 months compared to the control pups, whereas the glomeruli volume increased in IUGR pups at 3 months compared to the control pups (). TUNEL staining showed numerous apoptotic cells in the kidney tissues of pups in both groups at 1st day, 7th day and 21st day, but few apoptotic cells were observed at 2 and 3 months. Significantly more apoptotic cells were observed in the kidney tissues of IUGR pups compared to control pups at all tested time points ().
Discussion
Our previous study showed that significantly higher blood pressure was observed in 2–3 months old pups from maternal rats that experienced IUGR.Citation12 Unger and Patil study also observed that high blood pressure originating from the fetal period can continuously progress through old age,Citation15 which is accompanied by impaired renal function, indicating that non-genetic factors may prenatally program hypertension. In this study, IUGR was successfully established using 10% low-protein diet. Pups born from pregnant rats that were fed a low-protein diet had significantly lower birth weight and kidney weight compared to pups born from pregnant rats that were fed a normal diet. Interestingly, after birth, pups’ body and kidney weights in both groups increased with age, but showed no significant differences between two groups 21 days after birth and at an age of 3 months. However, the ratio of body/kidney weight decreased with age in pups without significant difference between the two groups at all tested time points, indicating that the growth of the kidney and body is synchronized. Consistent with previous studies,Citation16 this study showed a significant decrease in the number of glomeruli in IUGR pups 2 and 3 months after birth compared to control pups.
A previous study demonstrated that p53 phosphorylation is involved in the development of the kidney.Citation17 p53 is one of the key regulatory genes activated during kidney development which induces cell cycle arrest or apoptosis to maintain genome integrity. A previous study in an IUGR model established by uterine artery ligation observed a parallel increase in p53 protein level and apoptosis in the kidneys of IUGR rats after birth.Citation18 In our model, both p53 protein and phosphorylation levels were time-dependently decreased at 1st day, 7th day, 21st day, 2 months and 3 months. These observational time points correspond to the neonatal period, infancy, adolescence and adulthood of rats. Thus, the high level of p53 protein and phosphorylation in the kidney of pups in the control group from birth to 21 days after birth may implicate that p53 plays a crucial role in the development of the kidney.
Our study also demonstrated that p53 level and phosphorylation in IUGR pups were significantly higher than that in control pups at all tested time points. This suggests that intrauterine malnutrition can increase the expression of p53 in pups’ kidneys. Interestingly, we observed significantly more apoptotic cells in the kidneys of IUGR pups than that in control pups, which parallels the p53 protein and its phosphorylation levels. Also, the higher levels of p53 phosphorylation and apoptosis parallel the decreases in kidney weights and the number of glomeruli. Therefore, we believe that the activation and accumulation of p53 lead to an increase in apoptosis in the kidney, which subsequently leads to a permanent reduction in the number of glomeruli.
A previous study demonstrated that uteroplacental insufficiency increases p53 phosphorylation in the kidney of pups without a corresponding increase in MDM2 expression.Citation18 In this study, we also observed no significant changes in MDM2 mRNA expression between IUGR and control pups, suggesting that a low-protein diet increases p53 phosphorylation in the kidneys of IUGR pups without triggering the p53-MDM2 functional circuit response. p53-mediated gene repression is thought to function mainly through p53-mediated transcriptional activation of p21.Citation19 p21 is considered a universal inhibitor of cell cycle progression. In this study, we observed a time-dependent decrease in p21 protein levels from 1st day to 3 months. Significantly more p21 positive cells were observed in the kidneys of IUGR pups than in the control pups. The p21 levels parallel the levels of p53 and apoptosis. Thus, we hypothesize that p53 exerts its role in inducing apoptosis through the upregulation of p21 expression. However, p53 signaling is highly complex and may be involved in kidney development through multiple pathways. In addition, the upstream signaling for the activation of p53, such as NFκB, p38, and Chk2Citation20 needs further studies.
In conclusion, intrauterine growth restriction affects the development of the kidneys though reducing the number of glomeruli. p53–p21 may exert a key regulatory role in IUGR-induced adaptation in the kidney though inducing apoptosis, which may result in a permanent reduction in the number of glomeruli, and ultimately affect the development of the kidney. This study highlights the importance of intrauterine nutrition in the development of the kidney and implicates a long-term effect of intrauterine growth restriction on the function of organs.
Declaration of interest
The authors have declared that no conflict of interest exists.
This work was supported by the Second Xiangya Hospital of Endocrinology and Metabolism Research Center, Central South University.
References
- Szostak-Węgierek D, Szamotulska K. Fetal development and risk of cardiovascular diseases and diabetes type 2 in adult life. Med Wieku Rozwoj. 2011;15:203–215
- Barker DJ. Fetal origins of coronary heart disease. BMJ. 1995;311:171–174
- Lucas A. Programming by early nutrition: An experimental approach. J Nutr. 1998;128:401S–406S
- Schreuder M, Delemarre-van de Waal H, van Wijk A. Consequences of intrauterine growth restriction for the kidney. Kidney Blood Press Res. 2006;29:108–125
- Schreuder MF, Nyengaard JR, Fodor M, van Wijk JA, Delemarre-van de Waal HA. Glomerular number and function are influenced by spontaneous and induced low birth weight in rats. J Am Soc Nephrol. 2005;16:2913–2919
- Bagby SP. Maternal nutrition, low nephron number, and hypertension in later life: Pathways of nutritional programming. J Nutr. 2007;137:1066–1072
- Baserga M, Hale MA, Ke X, et al. Uteroplacental insufficiency increases p53 phosphorylation without triggering the p53-MDM2 functional circuit response in the IUGR rat kidney. Am J Physiol Regul Integr Comp Physiol. 2006;291:R412–R418
- Hollstein M, Hainaut P. Massively regulated genes: The example of TP53. J Pathol. 2010;220:164–173
- Zuckerman V, Wolyniec K, Sionov RV, Haupt S, Haupt Y. Tumour suppression by p53: The importance of apoptosis and cellular senescence. J Pathol. 2009;219:3–15
- Hilliard S, Aboudehen K, Yao X, El-Dahr SS. Tight regulation of p53 activity by Mdm2 is required for ureteric bud growth and branching. Dev Biol. 2011;353:354–366
- Heazell AEP, Sharp AN, Baker PN, Crocker IP. Intra-uterine growth restriction is associated with increased apoptosis and altered expression of proteins in the p53 pathway in villous trophoblast. Apoptosis. 2011;16:135–144
- Xie Z, Dong Q, Ge J, et al. Effect of low birth weight on impaired renal development and function and hypertension in rat model. Renal Failure. 2012;34:754–759
- Bolin G, Burggren WW. Metanephric kidney development in the chicken embryo: Glomerular numbers, characteristics and perfusion. Comp Biochem Physiol A Mol Integr Physiol. 2013;166:343–350
- Martins JP, Monteiro JC, Paixao AD. Renal function in adult rats subjected to prenatal dexamethasone. Clin Exp Pharmacol Physiol. 2003;30:32–37
- Unger BS, Patil BM. Apocynin improves endothelial function and prevents the development of hypertension in fructose fed rat. Indian J Pharmacol. 2009;41:208–212
- Wlodek ME, Westcott K, Siebel AL, Owens JA, Moritz KM. Growth restriction before or after birth reduces nephron number and increases blood pressure in male rats. Kidney Int. 2008;74:187–195
- El-Dahr SS, Hilliard S, Aboudehen K, Saifudeen Z. The MDM2-p53 pathway: Multiple roles in kidney development. Pediatr Nephrol. 2014;29:621–627
- Baserga M, Hale MA, Ke X, et al. Uteroplacental insufficiency increases p53 phosphorylation without triggering the p53-MDM2 functional circuit response in the IUGR rat kidney. Am J Physiol Regul Integr Comp Physiol. 2006;291:R412–R418
- Mirzayans R, Andrais B, Scott A, Murray D. New insights into p53 signaling and cancer cell response to DNA damage: Implications for cancer therapy. J Biomed Biotechnol. 2012;2012:170325
- Jiang M, Dong Z. Regulation and pathological role of p53 in cisplatin nephrotoxicity. J Pharmacol Exp Ther. 2008;327:300–307