
Abstract
Chemerin is an adipokine modulating inflammatory response and affecting glucose and lipid metabolism. These disturbances are common in CKD. The aim of the study was: (a) to evaluate circulating chemerin level at different stages of CKD; (b) to measure subcutaneous adipose tissue chemerin gene expression; (c) to estimate the efficiency of renal replacement therapy in serum chemerin removal. 187 patients were included into the study: a) 58 patients with CKD; (b) 29 patients on hemodialysis; (c) 20 patients after kidney transplantation. 80 subjects constituted control group. Serum chemerin concentration was estimated by ELISA. The adipose tissue chemerin mRNA level was measured by RT-qPCR. The mean serum chemerin concentration in CKD patients was 70% higher than in the control group (122.9 ± 33.7 vs. 72.6 ± 20.7 ng/mL; p < 0.001) and it negatively correlated with eGFR (r = −0.71, p < 0.001). The equally high plasma chemerin level was found in HD patients and a HD session decreased it markedly (115.7 ± 17.6 vs. 101.5 ± 16.4 ng/mL; p < 0.001). Only successful kidney transplantation allowed it to get down to the values noted in controls (74.8 ± 16.0 vs. 72.6 ± 20.7 ng/mL; n.s.). The level of subcutaneous adipose tissue chemerin mRNA in CKD patients was not different than in patients of the control group. The study demonstrates that elevated serum chemerin concentration in CKD patients: (a) is related to kidney function, but not to increased chemerin production by subcutaneous adipose tissue, and (b) it can be efficiently corrected by hemodialysis treatment and normalized by kidney transplantation.
Introduction
The recent years studies clearly proved that adipose tissue is an important endocrine organ.Citation1,Citation2 It produces and releases numerous bioactive compounds and molecules called adipokines. They regulate the large numbers of biological processes, modulate the inflammatory response, affect glucose and lipid metabolism, hemostasis, fat distribution, insulin sensitivity and insulin secretion, blood pressure and atherosclerosis. We know more and more about adiponectin, leptin, interleukin-6 or TNF-α, but new adipokines are constantly being detected and hence, the studies are needed to define their roles.Citation3,Citation4
Chemerin was discovered in 1997, as a product of tazarotene-induced gene 2 (TIG2).Citation5 It is expressed in liver, adipose tissue, placenta and to a lesser extent in other tissues (i.e. ovary, heart, lung, stomach, kidney).Citation6 Chemerin is produced in a precursor form and it seems that most of chemerin present in circulation is in inactive form (prochemerin). Its proteolytic activation processed by variety of proteases (i.e. cathepsins, carboxypeptidases, chymase, plasmin, elastase) transforms it into various bioactive isoforms with different abilities of action.Citation7 The studies showed that chemerin is a natural ligand for chemokine-like receptor 1 (CMKLR1) and it exhibits strong chemotactic properties towards the cells expressing CMKLR1, particularly macrophages, dendritic cells and NK. At the highest level, the receptor is expressed in adipose tissue. Chemerin also binds and activates two other receptors: G-protein coupled receptor 1 (GPR1) and chemokine receptor-like 2 (CCLR2) however, not much is known about their function.Citation7,Citation8
The precise role of chemerin has not been defined. It definitely has a regulatory role in adipogenesis. It seems to be necessary in adipocyte differentiation and it preserves its metabolic homeostasis.Citation6 Chemerin is also considered to be a factor affecting the initiation and progression of local inflammatory state. The activated inflammatory cells release the enzymes transforming circulating prochemerin into chemerin. This attracts other immune cells to the site of inflammation and intensifies their adhesion.Citation8 The increased plasma chemerin concentration was observed in patients with rheumatoid arthritis, ulcerative colitis and Crohn’s disease, psoriasis, chronic pancreatitis and liver diseases,Citation9–13 and it positively correlated with inflammatory markers such as C-reactive protein, TNF-α, Il-6.Citation14 It is also commonly considered that chemerin decreases the rate of glucose uptake and impairs the insulin tissue sensitivity.Citation7,Citation15 That is particularly expressed in some of diseases of affluence, like obesity, metabolic syndrome and/or diabetes.Citation16,Citation17
Chronic kidney disease (CKD) is present in approximately 10% of population and it belongs to the strongest risk factors of cardiovascular complications.Citation18 In CKD course, similarly like in the course of obesity, metabolic syndrome or type 2 diabetes, there are observed significant glucose and lipid metabolism disorders, and particularly the persistent, chronic inflammatory state.Citation19 It cannot be excluded that these disorders are at least partially mediated by chemerin. In the brief report, Pfau et al.Citation20 revealed a high serum chemerin concentration in patients on chronic hemodialysis and Yamamoto et al.Citation21 presented a negative correlation of serum chemerin and eGFR in incident dialysis patients. In our preliminary study we showed that in CKD patients, serum chemerin concentration is significantly increased,Citation22 however the mechanism behind it remains obscure. Moreover, we have also indicated that successful kidney transplantation decreases chemerin serum level to the values observed in healthy subjects.Citation23 In the present study, we have compared serum chemerin concentration in patients with conservatively treated CKD, in patients on maintenance hemodialysis treatment and in patients after kidney transplantation. We have also measured the subcutaneous adipose tissue chemerin mRNA level in patients with advanced stage of CKD and we have explored the relationships between serum chemerin concentration and basic parameters of glucose and lipid metabolism and markers of inflammation. The obtained results allowed us to assume that in CKD patients, the enhanced serum chemerin concentration is rather related to kidney function, but not to subcutaneous adipose tissue overproduction and that it is efficiently corrected by various forms of renal replacement therapy.
Patients and methods
The study was carried out in accordance with the Declaration of Helsinki of the World Medical Association and was finally approved by the Ethics Committee of Gdansk Medical University (NKEBN/35/2010). The participants received a detailed study information and after reading, they signed an informed consent form. They (n = 187 in total) were divided into four groups: (1) CKD: 58 patients with stages 3 and 4 of CKD (eGFR < 60 mL/min/1.72 m2); (2) HD: 29 patients with stage 5 of chronic kidney disease (eGFR < 15 mL/min/1.72 m2) on maintening hemodialysis treatment (mean parameters of HD session: time 4 hours 15 minutes; blood flow 300 mL/min; fluid flow 500 mL/min); (3) KT: 20 patients after successful renal transplantation with eGFR > 60 mL/min/1.72 m2; (4) Control: 80 patients admitted to the hospital for an elective implantation of a cardiac pacemaker, healthy as assessed by a general examination, without any overt clinical symptoms of inflammatory disease, coronary heart disease or heart failure, and most importantly without diagnosed kidney disease and with eGFR > 60 mL/min/1.72 m2. The kidney disease was caused by diabetic nephropathy (n = 15 in CKD group, n = 7 in HD group, n = 2 in KT group), chronic glomerulonephritis (respectively: n = 11, n = 6, n = 5), hypertensive nephropathy (n = 9, n = 7, n = 4), polycystic kidney disease (n = 1, n = 2, n = 1) and by other/unknown reasons (n = 22, n = 7, n = 8). All the patients received a standard pharmacological therapy. The characteristics of the patients are presented in .
Table 1. Characteristics of patients included into the study.
Additionally, 24 patients were selected for measuring the subcutaneous adipose tissue chemerin mRNA levels. The tissue was taken during elective pacemaker implantation procedure. The studied group (CKD) was constituted of 12 patients (4 females and 8 males, mean age: 74 ± 11 years) with stage 3 and 4 of CKD (eGFR < 60 mL/min/1.72 m2) and control group (Control) consisted of 12 patients (6 females and 6 males, mean age: 71 ± 9 years) without any symptoms of kidney disease and/or with stage 1 and 2 of CKD (eGFR > 60 mL/min/1.72 m2).
Laboratory tests
Fasting blood samples for laboratory tests were taken in the morning, right after the weight, height, waist and hip measurements were performed. In HD patients, the blood samples were taken before and after the session. Serum creatinine concentration, eGFR (MDRD formula) and serum concentration of total cholesterol (TCh), LDL-cholesterol (LDL-Ch), HDL-cholesterol (HDL-Ch), triglycerides (TG), C-reactive protein (CRP), glucose, HbA1c were determined by St.Wincent a Paulo Hospital’s certified laboratory. Additional serum samples (1 ml) were stored in Eppendorf’s probes at −70 °C until the chemerin assays were performed. Serum chemerin concentration was estimated by immunoassay method using specific for human chemerin commercially available ELISA kit (Milipore Corporation, Billerica, MA), following manufacturer’s instruction.
Determination of chemerin mRNA level
The adipose tissue sample (1 ml) was collected during elective pacemaker implantation procedure. The tissue was taken from the left upper chest after a skin incision performed under a local anesthesia. It was placed in Eppendorf’s probe and rapidly frozen in liquid nitrogen. The probes were stored at −70 °C until the analysis.
RNA isolation
Total cellular RNA was extracted from the frozen tissue samples by a method described by Chomczynski and Sacchi.Citation24 The RNA concentration was determined from the absorbance at 260 nm and all samples had 260/280 nm absorbance ratio of about 2.0.
cDNA synthesis
First strand cDNA was synthesized from 2 µg of total RNA (RevertAidTM First Strand cDNA Synthesis Kit – Fermentas UAB, Vilnius, Lithuania). Prior to amplification of cDNA, each RNA sample was treated with RNase-free DNase I (Fermentas UAB, Vilnius, Lithuania) at 37 °C for 30 min.
Determination of mRNA levels by RT-qPCR
Chemerin and β-actin mRNA levels were quantified by real-time RT-PCR using Chromo4 Real Time Detection System (BioRad Laboratories, Hercules, CA). Primers were designed with Sequence Analysis software package (Informagen, Newington, CT) using gene sequence obtained from Ensemble Genome Browser. The following sequences of primer pairs were used in this: for chemerin: (F) 5′-AGACAAGCTGCCGGAAGAGG-3, (R) 5′-TGGAGAAGGCGAACTGTCCA-3; for β-actin (F) 5′-TGTCACCAACTGGGACGATA-3′, (R) 5′- GGGGTGTTGAAGGTCTCAAA-3′. The real-time PCR amplification was performed in a 20 μl volume using iQ SYBR Green Supermix (BioRad Laboratories, Hercules, CA). Each reaction contained cDNA and 0.3 μM of each primer. Control reactions, with omission of the RT step or with no template cDNA added, were performed with each assay. All samples were run in triplicate. To compensate for variations in the amount of added RNA, and in the efficiency of the reverse transcription, β-actin mRNA was quantified in corresponding samples and the results were normalized to these values. Relative quantities of transcripts were calculated using the 2−ΔCT formula.Citation25 The results are expressed in arbitrary units. Amplification of specific transcripts was further confirmed by obtaining the melting curve profiles and subjecting the amplification products to agarose gel electrophoresis.
Statistical analysis was performed using Microsoft packages (Microsoft Excel). The data is presented as mean ± SD. The statistical significance of the differences between parameters determined in patients of all groups was assessed by the paired or non-paired t-test and the correlations were calculated using Pearson’s correlation coefficient. p < 0.05 was considered as significant.
Results
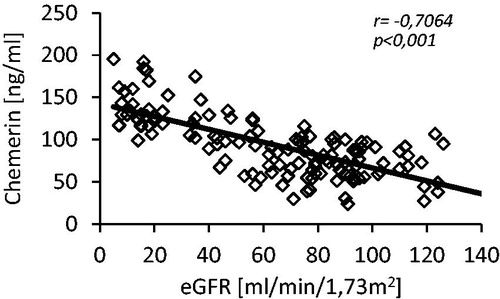
The mean serum chemerin level in CKD group (patients with 3 and 4 stage of CKD) was 70% higher than in controls (122.9 ± 33.7 vs. 72.6 ± 20.7 ng/mL; p < 0.001). The difference was statistically significant (). Moreover, we also observed the positive correlation between serum chemerin and creatinine concentrations (r = 0.67, p < 0.001) and negative one between serum chemerin concentration and eGFR (r = −0.71, p < 0.001; ). The mean serum chemerin level in patients of HD group (on maintenance hemodialysis treatment) was similar to the one observed in CKD group (115.7 ± 17.6 vs. 122.9 ± 33.7 ng/mL; n.s.), and it significantly declined after hemodialysis session (115.7 ± 17.6 vs. 101.5 ± 16.4 ng/mL; p < 0.001). However, the latter was still significantly higher than in patients of KT group (101.5 ± 16.4 vs. 74.8 ± 16.0 ng/mL; p < 0.001). The successful kidney transplantation allowed serum chemerin concentration to get down to the values noted in the control group (74.8 ± 16.0 vs. 72.6 ± 20.7 ng/mL; n.s.). The mean serum chemerin level in all studied groups of patients is presented at .
Figure 1. Comparison of mean serum chemerin concentration in patients with CKD (CKD), patients on maintenance hemodialysis treatment: before hemodialysis session (before HD) and after hemodialysis session (after HD), patients after kidney transplantation (KT) and in healthy subjects (controls). The data is presented as mean ± SD. Statistics: controls/CKD: p < 0.001; controls/beforeHD: p < 0.001; controls/afterHD: p < 0.001; controls/KT: n.s.; CKD/beforeHD: n.s.; CKD/afterHD: p < 0.002; CKD/KT: p < 0.001; beforeHD/afterHD: p < 0.001; beforeHD/KT: p < 0.001; afterHD/KT: p < 0.001.
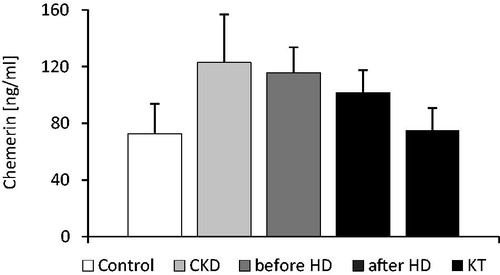
Figure 2. The scatterplot of chemerin serum concentration and eGFR determined in studied patients (control and CKD groups; n = 138).
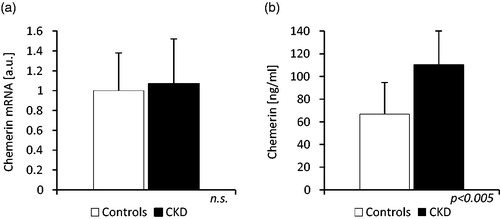
The chemerin subcutaneous adipose tissue gene expression was not increased in CKD group: the level of chemerin mRNA in this group was not significantly different than in the control group (1.07 ± 0.45 vs. 1.0 ± 0.38 a.u.; n.s.), in spite of significant differences in mean eGFR (34.6 ± 11.6 vs. 89.6 ± 19.1 mL/min/1.72 m2) and mean serum chemerin concentration found in these groups of patients (110.2 ± 30.0 vs. 66.7 ± 28.5 ng/mL; p < 0.005). The results are presented at .
Figure 3. The comparison of (a) chemerin mRNA levels in adipose tissue and (b) serum chemerin concentration of patients with stage 3 and 4 chronic kidney disease (CKD) and controls (Controls). The received blots were scanned and quantified by Sigma Scan software program. The data are expressed in arbitrary units (a.u.).
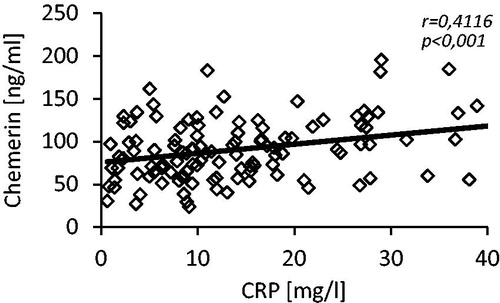
We did not notice any differences in serum concentration of TCh and LDL-Ch between studied groups, while HDL-Ch serum level was significantly lower (44.9 ± 14.1 vs. 51.2 ± 17.3 mg/dL; p < 0.05) and TG serum level was significantly higher (129.5 ± 59.5 vs. 105.0 ± 45.8 mg/dL; p < 0.01) in patients of CKD group when compared to controls. Moreover, we observed the positive correlations between serum level of chemerin and TCh (r = 0.24), LDL-Ch (r = 0.24), TG (r = 28) and the negative one between serum level of chemerin and HDL-Ch (r = −0.20). The scatterplots are presented at . The serum glucose concentration was significantly higher in patients of CKD group than in controls (125.3 ± 30.8 vs. 110.5 ± 20.0 mg/dL; p < 0.001) and the HbA1c concentration was essentially similar in both groups. Additionally, we found a positive correlation between serum chemerin and glucose concentrations (r = 0.26, p < 0.005). Also serum level of C-reactive protein was significantly greater in patients with CKD when compared with control subjects (22.8 ± 19.5 vs.11.9 ± 8.50 mg/L; p < 0.001). shows a scatterplot of positive correlation found between serum chemerin and CRP concentrations (r = 0.41).
Figure 4. The relationship between plasma levels of chemerin and (a) total cholesterol (TCh), (b) LDL-cholesterol (LDL-Ch), (c) HDL-cholesterol (HDL-Ch) and (d) triglycerides (TG) determined in studied patients (control and CKD groups; n = 138).
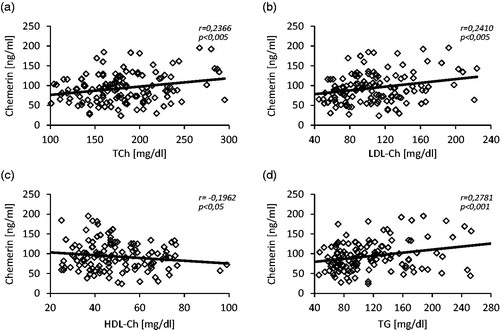
Figure 5. The scatterplot of chemerin and C-reactive protein (CRP) serum concentrations determined in studied patients (control and CKD groups; n = 138).
Discussion
Our study reveals that mean serum chemerin concentration is significantly higher in patients with CKD than in control subjects. The observed increase is expressive, however its reasons are obscure. Enhanced tissue production should be at least considered as a potential one. Substantial chemerin gene expression was found in various tissues,Citation6,Citation8 however the study results published in recent years indicate that the regulatory factors mainly impact on chemerin gene expression in adipose tissue and this is probably the main source of circulating chemerin level.Citation26,Citation27 We measured for the first time chemerin gene expression in subcutaneous adipose tissue of patients with CKD and as far as mRNA level is concerned it was not different from the controls. This indicates that enhanced serum chemerin concentration in CKD patients is not a result of its subcutaneous adipose tissue overproduction. The secretive potential of visceral adipose tissue varies from that of a subcutaneous one and it seems to be more important in a variety of metabolic disorders. Actually, Svensson et al.Citation28 showed a different chemerin release from visceral and subcutaneous adipose tissue in patients undergoing elective abdominal surgery, however these were severely obese patients (mean BMI = 41.6 kg/m2) and their renal function was not studied. On the other hand, Roubicek et al.Citation29 compared gene expression of some adipokines in subcutaneous and visceral fat depots of CKD patients and they could not find a significant difference in mRNA level of leptin, adiponectin, resistin and interleukin-6. The data are conflicting and therefore no one can completely exclude that the increased visceral adipose tissue and/or other tissues chemerin production contribute to its high serum level observed in patients with CKD. Further studies are needed to address this issue.
The circulating chemerin level seems to be highly related with obesity. In general population, the positive correlations between serum chemerin concentration and body weight, BMI, total adipose tissue mass and even WHR were repeatedly confirmed.Citation27,Citation30 Admittedly, in the present study we showed that the adipose tissue chemerin gene expression in CKD patients is not different from control subjects. However, the increased amount of adipose tissue itself could have been responsible for the enhanced chemerin release and contributing to its high serum concentration. This not the case in our study. We found the mean body weight, same like BMI or WHR to be lower in CKD group when compared with controls. It means that the increased circulating chemerin concentration observed in CKD is not a consequence of the adipose tissue excess.
Presumably, it is not the effect of drugs taken by the patients during the study either, at least as far as we consider the drugs regarded as affecting plasma chemerin level. It was shown that steroids enhance its serum concentration in patients suffering from ulcerative colitis.Citation10 Naturally, the steroids were taken by all the subjects after kidney transplantation, but serum chemerin level in this group of patients was not different from the controls and it was significantly lower than in CKD patients. Thus, there is no reason to assume that these medications relevantly impacted the presented results. ACE inhibitors are also found to influence chemerin plasma level.Citation31 They are presumed to inhibit chemerin degradation. However, it is noteworthy that when compared with controls, serum chemerin concentration in CKD patients was significantly higher in spite of the lower percentage of these patients taking ACE inhibitors. It does not mean that ACE inhibitors do not influence serum chemerin level at all, but this influence in CKD patients seems to be negligible.
Instead, the results presented in this study allow us to suggest that circulating chemerin level is closely related to renal function. Its high serum concentration found in CKD patients is probably a result of a renal failure-associated decrease of glomerular filtration rate and impaired chemerin urine excretion. Serum chemerin concentration significantly increases along with a progression of CKD and it positively correlates with serum creatinine level and negatively with eGFR. The highest mean serum chemerin concentration was found in patients with the advanced chronic kidney disease and this level was comparable with that in patients on maintenance hemodialysis treatment. It admittedly declines after hemodialysis session, but only a successful kidney transplantation decreases serum chemerin concentration to the level observed in control population (). The study shows that the applied methods of renal replacement therapy, particularly the renal transplantation may effectively correct circulating chemerin concentration.
It is worth to emphasize that there are more adipokines accumulating in serum of CKD patients. Leptin, rezistin, visfatin are also markedly elevated in uremia.Citation32 Their molecular weights lie usually within middle- and large molecular ranges and their renal clearance is significantly reduced in CKD. They are considered as uremic toxins and may be partially responsible for the metabolic disorders observed in renal failure.Citation32 And interestingly, similarly like chemerin they are not overproduced in adipose tissue.Citation29 The exception is adiponectin: its adipose tissue gene expression in uremia is down-regulated and therefore its serum level is usually not elevated despite its reduced renal clearance.Citation33
Chemerin is usually related to various markers of inflammation and thus, it is commonly considered as a pro-inflammatory protein. However, there are also some studies suggesting that it can act oppositely.Citation8 We found a significant positive correlation between serum concentration of chemerin and CRP. This finding is not clearly conclusive, since chemerin could be released not to initiate and support, but to mitigate the inflammatory state associated with renal disease. We also observed strong relationships between chemerin and CKD-related metabolic disorders. Serum chemerin concentration positively correlated with serum concentration of glucose, triglycerides, total- and LDL-cholesterol and negatively with HDL-cholesterol. This is not surprising. It was previously documented that chemerin is associated with the components of the metabolic syndrome.Citation14,Citation17 Instead, it is worth to notice that uremia does not disturb these relationships, despite the fact that the mechanisms of these disorders in CKD and in general population are quite different.
The study has some limitations, which should be exposed. The analysis of urine chemerin excretion would be extremely helpful to support the view that its high serum level found in CKD patients is due to the impaired renal clearance. We faced this issue, but we could not overcome the measurement problems. An equally important limitation is that we could not assess exclusively the biologically active chemerin. The commercially available ELISA tests allow us to determine only total serum chemerin level. Technological progress in this field is necessary to measure a serum bioactive chemerin concentration and to better understand the role of chemerin in biology.
In conclusion, the present study shows that serum chemerin concentration is markedly increased in conservatively treated CKD patients and it negatively correlates with glomerular filtration rate. This increase is not a result of subcutaneous adipose tissue chemerin overproduction and it is probably mainly due to its impaired renal clearance. The study also demonstrates that high chemerin serum concentration can be efficiently corrected by maintenance hemodialysis treatment and normalized by kidney transplantation.
Declaration of interest
The authors report no conflict of interest. The authors alone are responsible for the content and writing of the paper. The study was supported by grant from the Polish Committee for Scientific Research via the Medical University of Gdansk (ST-4 and ST-41).
References
- Oakhill JS, Steinberg GR. Adipose tissue as an endocrine organ. Mol Cell Endocrinol. 2010;316:129–139
- Poulos SP, Hausman DB, Hausman GJ. The development and endocrine functions of adipose tissue. Mol Cell Endocrinol. 2010;323:20–34
- Lehr S, Hartwig S, Sell H. Adipokines: A treasure trove for the discovery of biomarkers for metabolic disorders. Proteomics Clin Appl. 2012;6:91–101
- Faber DR, de Groot PG, Visseren FL. Role of adipose tissue in hemostasis, coagulation and fibrinolysis. Obes Rev. 2009;10:554–563
- Nagpal S, Patel S, Jacobe H, et al. Tazarotene-induced gene 2 (TIG2), a novel retinoid-responsive gene in skin. J Invest Dermatol. 1997;109:91–95
- Goralski KB, McCarthy TC, Hanniman EA, et al. Chemerin, a novel adipokine that regulates adipogenesis and adipocyte metabolism. J Biol Chem. 2007;282:28175–28188
- Zabel BA, Silverio AM, Butcher EC. Chemokine-like receptor 1 expression and chemerin-directed chemotaxis distinguish plasmacytoid from myeloid dendritic cells in human blood. J Immunol. 2005;174:244–251
- Rourke JL, Dranse HJ, Sinal CJ. Towards an integrative approach to understanding the role of chemerin in human health and disease. Obes Rev. 2013;14:245–262
- Wittamer V, Franssen JD, Vulcano M, et al. Specific recruitment of antigen-presenting cells by chemerin, a novel processed ligand from human inflammatory fluids. J Exp Med. 2003;198:977–985
- Weigert J, Obermeier F, Neumeier M, et al. Circulating levels of chemerin and adiponectin are higher in ulcerative colitis and chemerin is elevated in Crohn’s disease. Inflamm Bowel Dis. 2010;16:630–637
- Skrzeczynska-Moncznik J, Wawro K, Stefanska A, et al. Potential role of chemerin in recruitment of plasmacytoid dendritic cells to diseased skin. Biochem Biophys Res Commun. 2009;380:323–327
- Adrych K, Stojek M, Smoczynski M, Sledzinski M, Sylwia SW, Swierczynski J. Increased serum chemerin concentration in patients with chronic pancreatitis. Dig Liver Dis. 2012;44:393–397
- Kukla M, Zwirska-Korczala K, Hartleb M, et al. Serum chemerin and vaspin in non-alcoholic fatty liver disease. Scand J Gastroenterol. 2010;45:235–242
- Lehrke M, Becker A, Greif M, et al. Chemerin is associated with markers of inflammation and components of the metabolic syndrome but does not predict coronary atherosclerosis. Eur J Endocrinol. 2009;161:339–344
- Ernst MC, Issa M, Goralski KB, Sinal CJ. Chemerin exacerbates glucose intolerance in mouse models of obesity and diabetes. Endocrinology. 2010;151:1998–2007
- Chu SH, Lee MK, Ahn KY, et al. Chemerin and adiponectin contribute reciprocally to metabolic syndrome. PLoS One. 2012;7:e34710
- Stejskal D, Karpisek M, Hanulova Z, Svestak M. Chemerin is an independent marker of the metabolic syndrome in a Caucasian population – a pilot study. Biomed Pap Med Fac Univ Palacky Olomouc Czech Repub. 2008;152:217–221
- Santoro A, Mandreoli M. Chronic renal disease and risk of cardiovascular morbidity-mortality. Kidney Blood Press Res. 2014;39:142–146
- Jha V, Garcia-Garcia G, Iseki K, et al. Chronic kidney disease: global dimension and perspectives. Lancet. 2013;382:260–272
- Pfau D, Bachmann A, Lossner U, et al. Serum levels of the adipokine chemerin in relation to renal function. Diabetes Care. 2010;33:171–173
- Yamamoto T, Qureshi AR, Anderstam B, et al. Clinical importance of an elevated circulating chemerin level in incident dialysis patients. Nephrol Dial Transplant. 2010;25:4017–4023
- Blaszak J, Szolkiewicz M, Sucajtys-Szulc E, Konarzewski M, Swierczynski J, Rutkowski B. High serum chemerin concentration in patients with chronic renal failure. Nefrol Dial Pol. 2013;17:49–52
- Rutkowski P, Sledzinski T, Zielinska H, et al. Decrease of serum chemerin concentration in patients with end stage renal disease after successful kidney transplantation. Regul Pept. 2012;173:55–59
- Chomczynski P, Sacchi N. Single-step method of RNA isolation by acid guanidinium thiocyanate-phenol-chloroform extraction. Anal Biochem. 1987;162:156–159
- Winer J, Jung CK, Shackel I, Williams PM. Development and validation of real-time quantitative reverse transcriptase-polymerase chain reaction for monitoring gene expression in cardiac myocytes in vitro. Anal Biochem. 1999;15:41–49
- Stelmanska E, Sledzinski T, Turyn J, Presler M, Korczynska J, Swierczynski J. Chemerin gene expression is regulated by food restriction and food restriction-refeeding in rat adipose tissue but not in liver. Regul Pept. 2013;181:22–29
- Bozaoglu K, Bolton K, McMillan J, et al. Chemerin is a novel adipokine associated with obesity and metabolic syndrome. Endocrinology. 2007;148:4687–4694
- Svensson H, Oden B, Eden S, Lonn M. Adiponectin, chemerin, cytokines, and dipeptidil peptidase 4 are released from human adipose tissue in a depot-dependent manner: An in vitro system including human serum albumin. BMC Endocr Disord. 2014;14:7
- Roubicek T, Bartlova M, Krajickova J, et al. Increased production of proinflammatory cytokines in adipose tissue of patients with end-stage renal disease. Nutrition. 2009;25:762–768
- Chakaroun R, Raschpichler M, Kloting N, et al. Effects of weight loss and exercise on chemerin serum concentrations and adipose tissue expression in human obesity. Metabolism. 2012;61:706–714
- John H, Hierer J, Haas O, Forssmann WG. Quantification of angiotensin-converting-enzyme-mediated degradation of humanchemerin 145-154 in plasma by matrix-assisted laser desorption/ionization-time-of-flight mass spectrometry. Anal Biochem. 2007;362:117–125
- Teta D. Adipokines as uremic toxins. J Ren Nutr. 2012;22:81–85 PubMed
- Marchlewska A, Steinvinkel P, Lindholm B, et al. Reduced gene expression of adiponectin in fat tissue from patients with end-stage renal disease. Kidney Int. 2004;66:46–50