
Abstract
Background: The kidney is often affected in plasma cell dyscrasias, usually due to the effects of nephrotoxic monoclonal-free light chains. Renal failure due to a monoclonal gammopathy may be detected by the highly sensitive serum-free light-chain (sFLC) ratio yet missed by electrophoretic assays. The aim of this study was to assess sFLC levels in relation to markers of renal function. Methods: Five-hundred thirteen patients were included in this study. sFLC levels were measured by Freelite® (The Binding Site Group Ltd, Birmingham, UK) assay using the BNII nephelometer (Siemens Diagnostics, Germany). Kappa/lambda (κ/λ) sFLC ratio was calculated. Serum creatinine levels were analyzed by modified Jaffe method in Cobas 8000 analyser. GFR was estimated by the CKD-EPI (Chronic Kidney Disease Epidemiology Collaboration) equation. Patients were assigned to two groups depending on their eGFR values: ≤60 mL/min/1.73 m2 (Group 1, n = 103) and >60 mL/min/1.73 m2 (Group 2, n = 410). Data were expressed as median and min–max. All the statistical analyses were done with SPSS version 20.0 and a significance level of 0.05 was considered. Results: Serum κ-FLC median value was 36.4 (5.62–16,000) mg/L, serum λ-FLC was 21.7 (4.91–8770) mg/L, κ/λ sFLC ratio was 1.33 (0.01–3258) and serum creatinine was 1.56 (0.63–7.21) mg/dL in Group 1. Both λ sFLC and κ/λ sFLC ratios were correlated with eGFR (r = −0.318, r = 0.198, p < 0.05, respectively). We did not find any significant correlation between κ/λ sFLC ratio and eGFR in Group 2. Conclusions: We examined the association between sFLC concentrations and renal function. Our preliminary findings suggest that serum λ-FLC might be considered as a useful marker for predicting renal function. Prospective studies are needed to clarify the usefulness of these parameters for identifying renal failure due to a monoclonal gammopathy.
Introduction
Free light chains (FLCs) are produced during excess immunoglobulin synthesis and are removed from the serum by the kidneys.Citation1 Abnormal concentrations of sFLC may result from a number of clinical situations including reduced renal clearance, or monoclonal plasma cell proliferative disorders. The molecular weight of both of the light chains is ∼22.5 kDa. But the lambda (λ) light chain is covalently bound as a dimer while the kappa (κ) light chain is a monomer. These differences lead to different glomerular filtration rates of the light chains. FLCs were filtered through the glomeruli in the kidney nephrons and then metabolized after reabsorbtion in the proximal tubules. Under normal conditions, very little FLCs were excreted in the urine because of the short half-life of sFLC which are cleaned quickly by renal tubular reabsorption and then is rapidly metabolized in the proximal tubule.Citation2–6 A decrease in the GFR is associated with an increase in sFLC levels.
The kidney is frequently affected in plasma cell dyscrasias, due to the nephrotoxic effects of FLCs. Monoclonal-free light chains (FLCs) generally cause rapid progressive renal failure in patients with multiple myeloma. Serum from patients with either polyclonal hypergammaglobulinemia or renal impairment often have elevated κ-FLC and λ-FLC due to increased synthesis or reduced renal clearance. However, the κ/λ FLC ratio (rFLC) usually remains normal in these conditions. A significantly abnormal rFLC should only be due to a plasma proliferative (or lymphoproliferative) disorder that secretes excess FLC and disturbs the normal balance between κ and λ secretion.Citation5–12
The development of a sensitive immunoassay for serum-free light-chain (sFLC) determination has improved the diagnosis of monoclonal gammopathy. However, metabolism of FLC largely depends on renal function which could lead to misinterpretation of results. Previous work, however, has demonstrated that, in patients with renal failure, the FLC ratio can be increased above normal with no other evidence of monoclonal proteins suggesting that in this population, the range should be extended (reference range 0.37–3.1). The aim of this study was to assess the relationship between sFLC levels and renal function.
Materials and methods
This retrospective study was conducted with patients over 18 years at Medical Faculty Hospital of Akdeniz University. The study included 513 patients that came to the hospital during the year 2013. Blood samples were taken from patients by centrifugation at 4000 rpm for 5 min. The obtained serum was stored at −80 °C until the analysis. sFLC levels were measured by Freelite® (The Binding Site Group Ltd, Birmingham, UK) assay using the BNII nephelometer (Siemens Diagnostics, Marburg, Germany). In addition, κ/λ sFLC ratio was calculated. The normal serum reference ranges that were used have been reported as κ 3.3–19.4 mg/L, λ 5.71–26.3 mg/L and κ/λ ratio 0.26–1.65. But, in patients with renal impairment, it is recommended to interpret the results of the κ/λ ratio with a modified reference range of 0.37–3.1.
Serum creatinine levels were analyzed by modified Jaffe method in Cobas 8000 analyser (Roche, Mannheim, Germany). GFR was estimated by the CKD-EPI (Chronic Kidney Disease Epidemiology Collaboration) equation.Citation13 Patients were assigned to two groups depending on their eGFR values. Group 1 has 103 patients with chronic renal failure (GFR ≤ 60 mL/min/1.73 m2) and Group 2 has 410 patients without renal impairment (GFR > 60 mL/min/1.73 m2). Data were expressed as median and min–max.
Statistical analysis
All statistical analyses were done with SPSS version 20.0 (Chicago, IL) and Spearman’s rho correlation test was used for correlation analysis. Statistical significance was set at a p value of <0.05.
Results
Patient demographic and biochemical data are shown in . Mean age of patients was 62 (19–85) years. Among the 513 patients, eGFR values of 103 patients were found as ≤60 mL/min/1.73 m2. Although the sFLC concentrations and κ/λ ratios were observed higher in Group 1 patients, these findings did not show any significance.
Table 1. Patient demographic and biochemical data.
Correlation analysis showed that there was a positive correlation between λ sFLC and creatinine in Group 1 patients (p = 0.008, r = 0.260) and a negative correlation between eGFR (p = 0.001, r = −0.318). We found that κ/λ ratio was negatively correlated with creatinine (p = 0.007, r = −0.263), and positively with eGFR (p = 0.046, r = 0.198). shows the significant correlation in Group 1 patients.
Table 2. Spearman correlation coefficients for λ sFLC, κ/λ ratio, creatinine and eGFR in Group 1 patients.
In Group 2, there was a positive correlation between age and sFLC levels (for κ p = 0.001, r = 0.169 and for λ p = 0.004, r = 0.140, respectively). A positive correlation was found between κ sFLC and creatinine (p = 0.011, r = 0.126), while κ sFLC was negatively correlated with eGFR (p = 0.005, r = −0.137). We did not find any significant correlation between κ/λ sFLC ratio and eGFR in Group 2 patients.
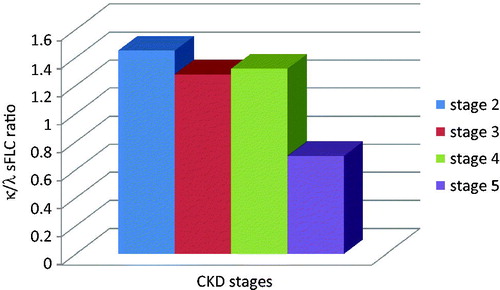
Serum parameters were also assessed according to CKD stages in Group 1 patients. For this reason, KDOQI Clinical Practice Guidelines for Chronic Kidney Disease: Evaluation, Classification, and Stratification were used.Citation14 eGFR values were classified as 60–89 mL/min as Stage 2, 30–59 mL/min as Stage 3, 15–29 mL/min as Stage 4 and <15 mL/min as Stage 5. As shown in and , both κ and λ sFLCs rose progressively through CKD stages (p < 0.05). κ/λ sFLC ratios were decreased dramatically in CKD stage 5 (p < 0.05) ().
Figure 1. Serum kappa-free light-chain concentrations in Group 1 patients. Kappa sFLC increased dramatically in CKD stages (p < 0.05).
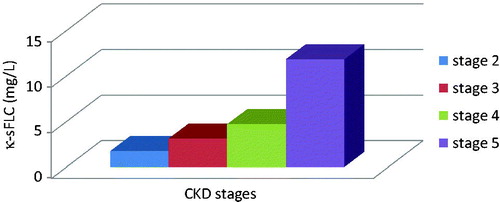
Figure 2. Serum lambda-free light-chain concentrations in Group 1 patients. Serum-free lambda light chains increased progressively with each CKD stage (p < 0.05).
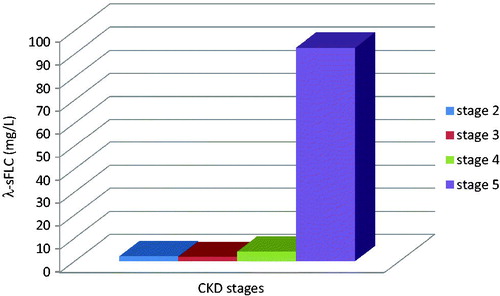
Figure 3. Serum-free kappa/lambda ratio in Group 1 patients. Serum-free kappa/lambda ratio decreased dramatically in CKD stage 5 (p < 0.05).
Discussion
Elevated polyclonal FLCs in serum result from increased polyclonal production, reduced renal clearance or a combination of both mechanisms. Reduced clearance of sFLCs results from impaired renal GFR.Citation6 There are limited data concerning the use of FLC assays in patients with renal disease. Preliminary analysis of follow-up data from a prospective cohort of 1394 patients with CKD indicated that summation of free κ plus free λ concentrations was prognostic for all causes of mortality and change in GFR.Citation15 Hutchison et al. suggested that the combined FLC concentrations had greater prognostic value than the creatinine-based CKD staging system. The principal causes of death associated with high FLC concentrations were cardiovascular disease, infections and cancer.Citation6–15
Nowrousian et al.Citation16 were found to increase the serum and urinary FLC concentrations with renal failure in their study. Serum FLC concentrations may change in different renal pathologies, especially renal patients with diabetes may show higher concentrations. On the other hand, most patients with chronic inflammatory diseases and associated renal impairment have high concentrations of polyclonal FLCs, but with substantially normal κ/λ ratio.Citation17–20 The clinical study of elevated sFLCs in renal impairment are unclear. Reports have suggested that the elevated FLCs lead to reductions in immune function and therefore should be classified as uremic toxins.Citation6 In line with these studies, we investigated whether there is a difference between sFLC levels in patients with and without kidney disease and compared the results with eGFR values. Although the sFLC concentrations and κ/λ ratios were observed higher in Group 1 patients, these findings did not show any significance in our study. However, our findings suggested that only λ sFLC levels were shown to be more significantly correlated with renal function.
κ-FLC is generated twice as fast as λ-FLC, but λ-FLC forms dimers and doubles its molecular weight and slows the renal clearance.Citation21 Thus, in the patients with kidney disease, FLC increases in serum due to the decrease in the urinary excretion because of reduced renal clearance. The reason for this may be – λ created larger molecules than κ due to the λ formed dimers and pass into the bloodstream with a decrease in urinary excretion.
In this study, we have examined the relationship between sFLC levels and renal function. It is important to observe that κ/λ ratios slightly decreased in patients according to CKD stages. These findings may indicate that λ sFLC levels increase with progression of kidney disease. Therefore, λ sFLC monitoring may be a useful predictor for the determination of decline in GFR. On the other hand, there are limited data concerning the reference ranges of sFLC in patients with renal disease. More detailed studies are needed for the assessment of these different reference ranges and the predicting role of sFLCs in renal disease.
Declaration of interest
The authors report no conflicts of interest. The authors alone are responsible for the content and writing of the article.
References
- Hutchison CA, Plant T, Drayson M, et al. Serum polyclonal immunoglobulin free light chain levels predict mortality in people with chronic kidney disease. BMC Nephrol. 2008;9:11
- Killingssworth LW, Warren BM. İmmunofixation for the Identification of Monoclonal Gammopathies. Beaumont, TX: Helena Laboratories; 1986
- Miettinen, TA, Kekki M. Effect of impaired hepatic and renal function and (131I) Bence Jones protein catabolism in human subjects. Clin Chim Acta. 1967;18:395–407
- Wochner RD, Strober W, Waldmann TA. The role of the kidney in the catabolism of Bence Jones proteins and immunoglobulin fragments. J Exp Med. 1967;126:207–221
- Bradwell AR. Serum free light chain measurements move to center stage. Clin Chem. 2005;51:805–807
- Bradwell AR. Serum Free Light Chain Analysis. 6th ed. Birmingham: The Binding Site Ltd; 2010
- Gupta S, Comenzo RL, Hoffman BR, Fleisher M. National academy of clinical biochemistry guidelines for the use of tumor markers in monoclonal gammopathies. Section 3:K; 2005. Available at: http://www.aacc.org. Accessed June 1, 2015
- Dispenzieri A, Kyle R, Merlini G, et al. International Myeloma Working Group guidelines for serum free light chain analysis in multiple myeloma and related disorders. Leukemia. 2009;23(2):215–224
- Bradwell AR, Carr-Smith HD, Mead GP, Tang LX, Showell PJ, Drayson MT, et al. Highly sensitive, automated immunoassay for immunoglobulin free light chains in serum and urine. Clin Chem. 2001;47:673–680
- Mead GP, Carr-Smith HD, Drayson MT, Morgan GJ, Child JA, Bradwell RA. Serum free light chains for monitoring multiple myeloma. Br J Hematol. 2004;126:348–354
- Solomon A, Waldmann TA, Fahey JL, McFarlane AS. Metabolism of Bence Jones proteins. J Clin Investig. 1964;43:103–117
- Katzmann JA, Clark RJ, Abraham RS, Bryant S, Lymp JF, Bradwell AR, et al. Serum reference intervals and diagnostic ranges for free κ and free λ immunoglobulin light chains: Relative sensitivity for detection of monoclonal light chains. Clin Chem. 2002;48:1437–1444
- Levey AS, Stevens LA. Estimating GFR Using the CKD Epidemiology Collaboration (CKD-EPI) creatinine equation: More accurate GFR estimates, lower CKD prevalence estimates, and better risk predictions. Am J Kidney Dis. 2010;55(4):622–627
- KDIGO 2012. Clinical practice guideline for the evaluation and management of chronic kidney disease. Kidney Int Suppl. 2013;3:5–14
- Hutchison CA, Harding S, Hewins P, et al. Quantitative assessment of serum and urinary polyclonal free light chains in patients with chronic kidney disease. Clin J Am Soc Nephrol. 2008;3:1684–1690
- Nowrousian MR, Brandhorst D, Sammet C, Lellert M, Daniels R, Schuett P, et al. Serum free light chain analysis and urine immunofixation electrophoresis in patients with multiple myeloma. Clin Can Res. 2005;11:8706–8714
- van der Heijden M, Kraneveld A, Redegeld F. Free immunoglobulin light chains as target in the treatment of chronic inflammatory diseases. Eur J Pharmacol. 2006;533:319–326
- Solling K, Solling J, Romer FK. Free light chains of immunoglobulins in serum from patients with rheumatoid arthritis, sarcoidosis, chronic infections and pulmonary cancer. Acta Med Scand. 1981;209:473–477
- Streja D, Cressey P, Rabkin SW. Associations between inflammatory markers, traditional risk factors, and complications in patients with type 2 diabetes mellitus. J Diabetes Complications. 2003;17:120–127
- Festa A, D’agostino R, Howard G, Mykkänen L, Tracy RP, Haffner SM. Inflammation and microalbuminuria in nondiabetic and type 2 diabetic subjects: The Insulin Resistance Atherosclerosis Study. Kidney Int. 2000;58:1703–1710
- Nezlin R. Human immunoglobulins. In: Nezlin R, Roald S, eds. The Immunoglobulins: Structure and Function. New York: Academic Press; 1998:95–100