
Abstract
The furostanol glycoside isolated from the seed of fenugreek (SFSE-G) has an array of pharmacological activities. To date, no validated high-performance liquid chromatography (HPLC) method has been reported for quantification of SFSE-G in biological samples. Hence, the aim of the present study was to study the pharmacokinetics, tissue distribution and excretion profiles of SFSE-G after oral administration in rats. A rapid, sensitive, selective, robust and reproducible HPLC method has been developed for determination of SFSE-G in the rat biological samples. The chromatographic separation was accomplished on a reversed-phase C18 column using formic acid and acetonitrile (80:20) as mobile phase at a flow rate of 1.0 mL/min and 274 nm as a detection wavelength. The assay was linear for SFSE-G with the correlation coefficients (R2) >0.996. The analytes were stable during samples storage and handling, and no matrix effects were observed. After oral dosing of SFSE-G at a dose of 200 mg/kg, the elimination half-life was app. 40.10 h. It showed relatively slowly distribution and eliminated in urine and feces after 24 h, and could be detected until 108 h post-dosing. Following oral single dose (200 mg/kg), SFSE-G was detected in lung and brain which indicated that it could cross the blood–brain barrier. It is a major route of elimination is excretion through urine and feces. In conclusion, oral administration of SFSE-G showed slow distribution to tissues, such as lung and brain, but showed fast renal elimination.
Introduction
Recently, botanical medicines have become popular as alternative remedies as they are believed to be efficacious, safe and have over a thousand years’ experience in treating patients.Citation1 Being the advantages of low side effects and toxicity, the herbal drugs have been widely used throughout the world for the treatment of various diseases. In general community, herbal medicines have been utilized progressively as a replacement or complementary therapeutic medicine and which is on a self-selection basis.Citation2–4
Depending upon the nature of the chemical moieties undertaken in the study, the measures vary which is related to the principal therapeutic actions of that moiety.Citation5–8 However, currently single chemical molecule with multiple therapeutic activities has been utilized for the treatment of several disorders. One such natural product with multifaceted therapeutic benefits is Trigonella foenum-graecum (Fenugreek; family: Fabaceae) seeds. Fenugreek seeds have been widely used in Ayurvedic and Chinese medicine for the treatment of the array of diseases. The health and therapeutic benefits have been extensively reviewed in traditional and modern literature.Citation9–12 These benefits include indigestion, anorexia, diarrhea, respiratory disorders, such as chronic cough, bronchitis, sore throat and mouth ulcers.Citation13 The anti-diabetic and hypocholesterolemic,Citation14–16 anti-fertility, anticancer, antimicrobial and anti-parasiticCitation17 properties of fenugreek seeds has been proven clinically and in animal models. However, responsible bioactive constituents on quantitative basis (standardization) have not identified in these reports and thus recommended further investigations.
Fenugreek glycosides are reported to have natural ability to modulate pro-inflammatory gene expressionCitation18 and showed anti-inflammatory effects clinicallyCitation19 and in animal models of inflammation.Citation20,Citation21 It was shown to have adipogenic,Citation22 anabolicCitation23 and androgenicCitation24 activity. The defatted fraction of fenugreek seeds that are rich in fiber that contains furostanol glycosides and proteins are mainly associated with many of its therapeutic activitiesCitation25 including management of male erectile dysfunction.Citation26
The medicinal plants that contain an adequate amount of bioactive moieties with potential pharmacokinetic (PK) properties can be accounted for the therapeutic efficacy. It has been proven clinically as well as pre-clinically that after administering the herbal medicine only some of the phytoconstituents has been getting significantly exposed and showed good pharmacological effects.Citation27 Hence, PK analysis of phytoconstituents is an important tool for monitoring and understanding the link between the herb consumption and its pharmacological effects. It also played a vital role in the determination of therapeutic efficacy of the drug, adjustment of dose and rational use of the drug in the clinic.
Recently, we have reported the method of preparation, characterization and standardization of furostanol glycoside-based standardized fenugreek seeds extract (SFSE-G).Citation28 SFSE-G, the test composition, is glycoside-based standardized fenugreek seed extract with two marker glycosides, i.e. trigoneoside Ib (76%) and vicenin 1 (15%). However, the quantitative pharmacokinetic data on SFSE-G are lacking. Hence, the present work was aimed at developing a simple and sensitive high-performance liquid chromatography (HPLC) method and pharmacokinetic evaluation (including tissue distribution) of SFSE-G with trigoneoside Ib as a marker compound after single oral dose administration in laboratory rats.
Materials and methods
Preparation of furostanol glycoside-based standardized fenugreek seeds extract (SFSE-G)
The SFSE-G was prepared from the hydroalcoholic extract of fenugreek seeds as follows: The fenugreek seeds were collected during the summer of 2011 from Mandsaur, Madhya Pradesh, India. An expert taxonomist of Agharkar Research Institute, Pune, India authenticated the seeds and voucher specimen is maintained as Auth11-167. Fenugreek seeds were air dried (moisture content less than 5%) and flaked to a thickness of less than 2 mm. The flaked material was extracted with a solvent mixture of ethanol and water (80:22 v/v). The solvent was passed through the layer of flaked seeds for 10 h at 35 °C, and the eluent was recycled. After 10 h, the extract was filtered through 200-mesh cloth to get a clear solution, and this was concentrated at 50 °C under vacuum to a semi-solid mass. The resultant semi-solid mass was dissolved in deionized water and subjected to counter current extraction with n-butanol. The clear water layer was passed through a strong cation exchange column to remove all the amphoteric compounds like amino acids, proteins and trigonelline. The column was passed through the resin bed comprising of Dowex Optipore L493 (highly cross-linked polymer adsorbent with a high surface area and unique pore size distribution) for a period of 2 h. The adsorption process was monitored by a thin layer chromatography (TLC) system comprising of toluene:ethyl acetate:methanol:water (6:3:6:1 v/v/v/v). The bioactive components started eluting at ethanol:water (70:30 v/v). These fractions were collected, screened, pooled and concentrated at 50 °C to yield a final composition.
Characterization of SFSE-G from fenugreek seed
The characterization of SFSE-G was carried out through HPLC to establish its purity. The eluted compound was highly purified, characterized using TLC, LC–MS, 1H NMR and 13C NMR analysis, and used as a reference standard. The HPLC conditions are as follows: Column: Kromasil C18 column (250 mm × 4.6 mm, 5 µm), detector: UV-2075 (wavelength: 210 nm), injection volume: 20 µL; flow rate: 1 mL/min (gradient elution technique), mobile phase as acetonitrile: water starting from 75:25 v/v to 65:35 v/v over 20 min.
Chemicals
Formic acid and acetonitrile (HPLC grade) were purchased from Merck Company (Merck Specialities Pvt. Ltd., Mumbai, India). Deionized water was purified by Milli-Q system (Merck Specialities Pvt. Ltd., Mumbai, India). All other reagents were of analytical grade and were obtained from conventional commercial sources.
Animals
Male Wistar rats (180–220 g) purchased from the National Institute of Biosciences, Pune (India), were used for the study. They were housed in cages at a temperature of 24 ± 1 °C and relative humidity 56–66%, with 12 h fluorescent light and 12 h dark cycle in an animal house facility. The rats had free access to water ad libitum throughout the study duration except during actual measurements. All experiments were carried out between 09:00 h and 17:00 h. Institutional Animal Ethics Committee (IAEC) of Poona College of Pharmacy, Pune, India, approved the experimental protocol (CPCSEA/35/2012). The experiments were performed in accordance with the ethical guidelines for animal experimentation recommended by the Committee for Control and Supervision of Experimentation on Animals (CPCSEA), Government of India, New Delhi, India.
Instrumentation and chromatographic conditions
The HPLC analysis was carried out on chrompass liquid chromatographic-4000 system (Jasco, Tokyo, Japan) equipped with auto-sampler and UV-2075 plus detector. Data acquisition was controlled by JASCO ChromPass Chromatography Data System software (JASCO GmbH, Groβ-Umstadt, Germany). Chromatographic separation was accomplished on a Kromasil 100-5 C18 (Serial No. E31667) (250 mm × 4.6 mm × 5 µm) analytical column (Sigma-Aldrich, Mumbai, India), pump: pu-2080 plus, UV detector: UV-2075 and auto-sampler: AS-2055 plus. The mobile phase was formic acid (0.3%): acetonitrile (80:20 v/v) at a flow rate of 1 mL/min. Chromatograms were monitored at 274 nm with runtime 30 min and the column temperature was maintained at 25 °C.
Preparation of serum samples
For the assay of serum samples, the internal standard solution (100 μL) and the mixture (100 μL) of acetic acid and water corresponding to the volume of the working standard solutions were added to a glass tube, and the solvent was evaporated to dryness under the nitrogen gas flow. Serum sample (2 mL) was added to the residue, and the mixture was vortex mixed for 5 min and applied to Tulsicon® ADS-400 (Thermax Limited, Pune, India) (0.40–1.2 mm) column followed by washing with 6 mL distilled water. Then column was eluted with 2 mL of methanol and eluate was concentrated under nitrogen. The resultant residue was mixed with 1 mL of distilled water and analyzed by HPLC. A 20 μL aliquot was injected into the HPLC system for analysis.
Calibration standards and quality control (QC) samples preparation
Stock solution of SFSE-G was prepared in methanol to give a final concentration of 1.0 µg/mL. A series of working solutions were obtained by diluting the SFSE-G stock solution with methanol. All solutions were stored at −7 °C until used. Calibration standards of SFSE-G were prepared by spiking the appropriate amount of the working solutions into 100 μL drug-free rat plasma or tissue homogenates. The final concentrations of calibration standard samples were 2.3, 4.6, 6.9, 9.2 and 11.5 μg/mL. QC samples were prepared at the concentrations of 2.3, 6.9 and 11.5 μg/mL for plasma. Whereas, QC samples were prepared at the concentrations of 1, 10, 100, 1000 and 5000 μg/mL for different tissue homogenates, urine and fecal samples.Citation29
General procedure for sample preparation for SFSE-G Analysis in plasma, tissue, urine and fecal samples
A solid–liquid extraction (SLE) of SFSE-G in biosamples was performed prior to HPLC analysis. Briefly, 100 μL of plasma or tissue samples or clear supernatant of urine or stool was obtained by centrifuging the whole urine at 10 000 rpm at 4 °C for 20 min. Then it passed through Tulsicon® ADS-400 (0.40–1.2 mm) and washed with 6 mL of distilled water and elute with 2 mL of methanol. It was concentrated under nitrogen and residue was dissolved in 1 mL mobile phase consisting of formic acid (0.3%): acetonitrile (80:20 v/v). An aliquot (20 μL) of the supernatant was injected onto the HPLC system.
Method validation
Specificity
Specificity was assessed by analyzing blank plasma and tissue homogenate samples, blank plasma and tissue homogenate samples spiked with SFSE-G.
Calibration curves and lower limit of quantification (LLOQ)
Calibration standard was prepared as described above in triplicate and analyzed on three consequent days. The lower limit of quantification (LLOQ) was defined as the lowest concentration of analyte in a sample which provided a peak area with a signal-to-noise ratio higher than 10.
Precision and accuracy
Intra-day and inter-day precision and accuracy were evaluated by analysis of the three QC samples with six determinations per concentration at the same day while the inter-day precision and accuracy were measured over three consecutive days. The precision was defined as the relative standard deviation (%RSD), while accuracy was determined by calculating the percentage deviation observed in the analysis of QC samples and expressed by relative error (%RE). The accepted criteria for the data were: the precision and accuracy should not exceed 2%, except at the LLOQ where it should not exceed 3%.
Extraction recovery and stability
The extraction recoveries of SFSE-G were determined at low, medium and high level of QC samples. Recoveries were calculated by comparing the observed peak area ratios in biosamples to those non-processed standard solutions at the same concentrations.Citation29
The stability of SFSE-G in plasma and tissue was determined by different storage or handling conditions. Short-term stability was assessed by analyzing QC samples kept at ambient temperature for 8 h. Freeze–thaw stability was evaluated at three consecutive freeze–thaw cycles. Long-term stability was studied by assaying samples following a period of 2 weeks of storage at −70 °C.Citation29
In vivo pharmacokinetic study
Six rats were used for pharmacokinetic investigation. SFSE-G was administered orally at the dose of 200 mg/kg. At the time points of 0 (pre-dose), 0.083, 0.25, 0.5, 0.75, 1, 1.5, 2, 4, 8, 12, 24, 48, 72 and 96 h post-injection, blood samples (0.5 mL) were collected in heparinized tubes from the retro-orbital puncture, and then centrifuged −4 °C at 10 000 rpm for 5 min to obtain the plasma. The plasma was stored at −70 °C prior to analysis by HPLC.
Tissue distribution study
For tissue distribution study, three rats were used, and SFSE-G was administered orally at a dose of 200 mg/kg. After administration, the rats were sacrificed at 72 h following administration, and the tissue specimens including brain, kidneys, adrenal glands, liver, lungs and small intestine were collected. Tissue samples were rinsed in saline and blotted dry with filter paper, and then weighed for wet weight and homogenized in ice-cold physiological saline solution (500 mg/mL). The obtained tissue homogenates were stored at −70 °C until analysis performed using the procedure described above.
Urinary and fecal excretion study
For urinary and fecal excretion study, three rats were used, and SFSE-G was administered orally at a dose of 200 mg/kg. The rats were housed in metabolic cages (Techniplast, Varese, Italy) with free access to water and food was returned approximately 4 h post-dosing. Urine and feces were collected at 0–24, 24–48, 48–72, 72–96 and 96–108 h post-dosing. The feces were dried at room temperature. The specimens were stored at −70 °C after the urine volume and feces dry weight for each collection period were measured.
Statistical analysis
All the data were expressed as the mean ± S.E.M. The pharmacokinetic parameters were calculated using the Kinetica v 5.0 (Alfasoft AB, Göteborg, Sweden).
Results
Characterization of trigoneoside Ib in SFSE-G
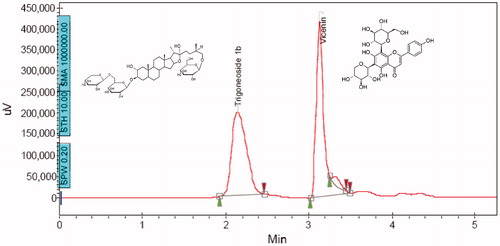
The compound corresponding to peak A (RT = 2.2 min in HPLC) was isolated and characterized. TLC study using toluene:ethyl acetate:methanol:water (6:3:6:1 v/v/v/v), following a 5% anisaldehyde sulphuric acid spray and heating at 110 °C for 15 min showed a single greenish brown spot which was confirmed to glycoside structure. Heating at 110 °C for 15 min yielded single yellow spot melting point = 220 °C with mass of 906 (M + Na = 929) (LC–MS analysis) confirming presence of glycoside structure. The NMR study revealed following details: 13C NMR in CD3OD (100 MHz): δC (ppm) 44.43 (C-1), 71.6 (C-2), 85.8 (C-3), 34.9 (C-4), 44.4 (C-5), 28.4 (C-6), 30.78 (C-7), 34.1 (C-8), 51.7 (C-9), 36.9 (C-10), 22.0 (C-11), 39.6 (C-12), 41.8 (C-13), 57.8 (C-14), 32.8 (C-15), 82.4 (C-16), 65.06 (C-17), 16.9 (C-18), 12.08 (C-19), 40.8 (C-20), 16.3 (C-21), 114.0 (C-22), 38.5 (C-23), 28.9 (C-24), 34.9 (C-25), 76.0 (C-26), 17.6 (C-27); glucose-I: 102.35 (C-1′), 75.1 (C-2′), 79.3 (C-3′), 73.7 (C-4′), 77.0 (C-5′), 70.6 (C-6′); xylose: 104.57 (C-1″), 76.05 (C-2″), 78.08 (C-3″), 72.4 (C-4″), 67.0 (C-5″); glucose-II: 103.0 (C-1″′), 76.5 (C-2″′), 79.7 (C-3″′), 72.1 (C-4″′), 82.43 (C-5″′), 62.8 (C-6″′).1H NMR analysis in CD3OD:0.744 (19-H3), 0.869 (18-H3), 0.959 (20-H3), 1.05 (5-H), 1.51 (21-H3), 2.06 (25-H), 2.206 (20-H), 3.48, 4.05 (26-H2), 3.699 (3-H), 4.14 (2-H), 4.04, 5.1 (6′-H2); [α]D24 (c = 0.37, pyridine): −41.9°. From the NMR data, the structure of compound corresponding to peak A was confirmed to be SFSE-G with purity of 76% as observed in HPLC ().Citation30
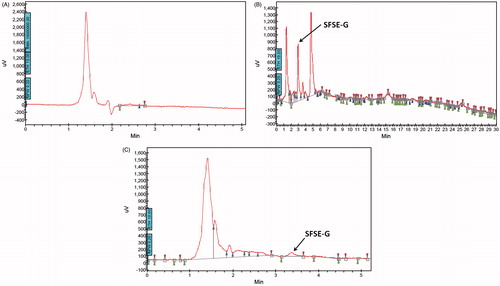
Figure 1. HPLC chromatogram showing the composition of SFSE-G with structures of peak (A) trigoneoside Ib (RT = 2.2 min) and peak (B) vicenin 1 (RT = 3.2 min).
Selection of mobile phase
Biosample preparation was performed using a SLE and different solvents, such as ethyl acetate, chloroform, hexane, formic acid and acetonitrile, were investigated. Finally, formic acid (0.3 %) and acetonitrile in a mixture of 80:20 v/v was found to be optimal, because it can produce clean chromatograms for plasma, tissues, urine and fecal as well as its yielded the highest recovery for the analytes.
Method validation
Linearity of calibration curve and LLOQ
The calibration curves showed good linearity over the concentration range of 100–600 μg/mL in rat plasma and tissue homogenates with a correlation coefficient (R2) larger than 0.996. The peak area versus concentration equipped well with a straight line, with the equation y = 1.301x − 31.26 for plasma and tissue homogenates. For the urine and stool samples, calibration curves showed good linearity over the concentration range of 1.0–5000 μg/mL with a correlation coefficient (R2) larger than 0.994. The peak area versus concentration equipped well with a straight line, with the equation y = 9.341x + 599.7 for urine and fecal sample. The current assay offered an LLOD of 37.18 μg/mL, whereas LLOQ of 112.68 μg/mL for plasma, and tissue samples. The limits were sufficient for studies of pharmacokinetics, tissue distribution and urine–fecal elimination following a single oral administration of SFSE-G (, ).
Figure 2. Concentration versus residual plot of SFSE-G.
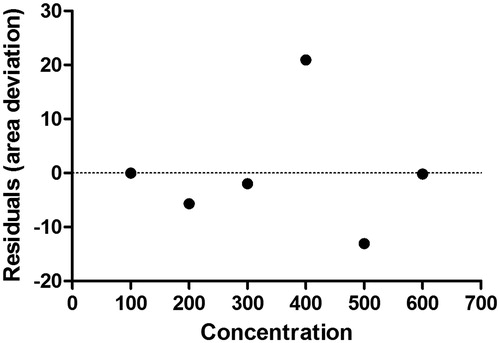
Table 1. Linear regression data for the calibration curves (n = 6).
Precision and accuracy
The intra- and inter-day precision and accuracy of the method are summarized in . For all the samples spiked with analytes at three concentration levels, the %RSD of both the intra-day and inter-day precision was between 0.39% and 1.74% and 0.23% and 0.89%, respectively. Accuracy was calculated as % recovery, and it was ranged between 99.96% and 100.42% for the matrices studied for SFSE-G in plasma. The results demonstrated that the method is accurate and reproducible for determination of SFSE-G in rat plasma, tissues, urine and fecal samples. The low values of %RSD was less than two (< 2%), with no significant differences in values for intra-day and inter-day precision, indicate the method’s reproducibility with high precision.
Table 2. Intra- and inter-day precision of the HPLC method, recovery and robustness study for SFSE-G.
Recovery and robustness
The extraction recoveries of SFSE-G ranged between 99.96% and 100.42% in plasma and tissue samples (). These data indicated that the biosample preparation procedure was satisfied and can achieve the acceptable extraction recovery. Robustness of the envisaged method studied after deliberate alterations of the analytical parameters indicated that areas of peaks of interest and retention factor remained unaffected by small changes in the operational parameters (%RSD < 2). The summary of validation parameters of the proposed method is given in .
Specificity
The HPTLC-UV spectra of SFSE-G shown in indicated λmax at 210 nm. The representative chromatograms for determination of SFSE-G in plasma are shown in (B–D) and in tissues (brain and lung were chosen as representative tissues) are shown in (B–C), respectively. The retention time of SFSE-G was about 3.5 min. It was indicated that analyte was well separated, and no interferences were detected from endogenous substances or metabolites.
Figure 3. UV spectrum of SFSE-G showed the λmax at 210 nm.
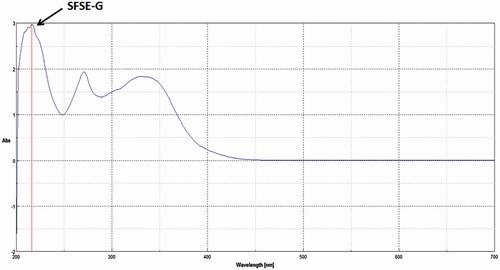
Figure 4. Representative chromatograms of blank plasma (A); plasma spiked with SFSE-G (B); plasma sample at 0 h before administration of SFSE-G (C) and plasma sample after 72 h of SFSE-G administration at a single oral dose of 200 mg/kg (D).
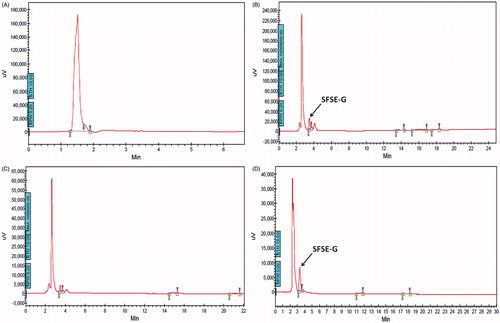
Figure 5. Representative chromatograms of blank tissue homogenate (A); lung tissue homogenate after administration of SFSE-G at a single dose of 200 mg/kg (B) and brain tissue homogenate after administration of SFSE-G at a single dose of 200 mg/kg (C).
Pharmacokinetics of SFSE-G in rats
The mean plasma concentration–time profiles of SFSE-G in rats following oral administration at dose of 200 mg/kg are shown in , and the corresponding pharmacokinetic parameters are summarized in . It was found that the data were best fitted with a two-compartment model. SFSE-G had a slow distribution phase as the SFSE-G appeared in plasma after 30 min which was followed by a relative slow elimination phase and could be detected by 96 h post-dosing.
Figure 6. Mean plasma concentration–time profiles of SFSE-G in rats after receiving a single oral dose at a concentration of 200 mg/kg (A), cumulative urinary excretion of SFSE-G in rats after receiving a single oral dose at a concentration of 200 mg/kg (B) and cumulative fecal excretion of SFSE-G in rats after receiving a single oral dose at a concentration of 200 mg/kg (C).
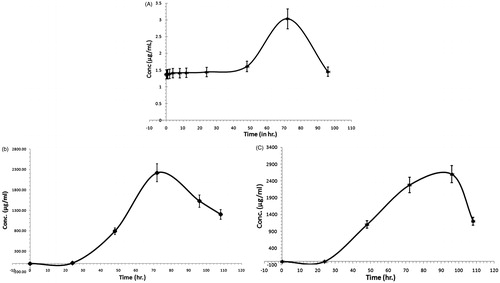
Table 3. Pharmacokinetic parameters for SFSE-G in rats after receiving a single oral dose at a concentration of 200 mg/kg.
Tissue distribution study
The tissue distribution of SFSE-G after single oral administration of 200 mg/kg in rats showed that the highest level of SFSE-G was observed in lung followed by brain. The high affinity in lung of SFSE-G confirms that it has good curative effect on respiratory diseases. In addition, the presence of SFSE-G in brain tissue revealed that it can efficiently cross the blood–brain barrier that may be good for treating the disorder related to central nervous system ().
Table 4. Concentration of SFSE-G in rat various tissues after receiving a single oral dose at a concentration of 200 mg/kg.
Urinary and fecal excretion study
The excretion of SFSE-G in urine and feces is illustrated in . After a single oral administration of 200 mg/kg SFSE-G, the mean elimination in urine and feces was after 24 h and could be detected until 108 h post-dosing. Hence, major unchanged amount of the SFSE-G was eliminated from the urine and feces over 108 h.
Discussion
In order to understand drug actions, its distributions and elimination in living organisms there is need to develop a highly sensitive, robust, validated, sophisticated and precise analytical method for qualitative and quantitative PK analysis of the chemical moieties from various biological fluids. Simultaneous determination of PKs (determination of the time course of drug concentrations in body fluids) and pharmacodynamic (PD) (determination of drug effects intensity on the organs) parameters of drug provides more accurate and sensitive ideas about drug concentrations, and its effects in human or experimental animal.Citation31,Citation32 Animal models played the decisive role in the understanding of the PK properties of various therapeutic moieties.Citation33 In addition, for interpretation of in vivo disposition as well as evaluation of the various drug targeted site the knowledge of PD (distribution and excretion) is necessary. Hence, laboratory rats have been preferred as suitable animals model for the evaluation of PK–PD after oral absorption as they mimic all the parameters that have clinically close resemblance to human.Citation34
For illustration of the mechanism of the chemical moiety isolated from natural products, it is important to evaluate its pharmacokinetics profile.Citation35–37 As the use of herbal medicine as an alternative medicine has been increased day by day ultimately its herb–drug interactions has been evolved more. Moreover, this interaction needed to be investigated with the help of its PK–PD profiling.Citation38 Quantitative structure-PK relationships (QSPKRs) analysis provides an idea about the molecular properties and/or functional group presentation in the PK of compounds which further provides information about the PK trends within that compound series thus the best possible pharmacological activities can be derived from this QSPKR information.Citation39,Citation40 As the QSPKR analysis is an important factor of multi-component PK study, hence, absorption and disposition of chemical moieties in a different compartment can be identified based on its structure.
Qualitative and quantitative analysis of the bioactive constituents (PK markers) from natural products was done according to US-FDA guidelinesCitation29 in various biosample including plasma, urine and tissues by using the suitable analytical methods could be used to substantiate systemic exposure to the herb.Citation27 It also played a significant role in the determination of herb–drug or herb–herb interactions during toxicity and clinical studies. To date, no validated HPLC method has been reported in the literature for the quantification of furostanol glycoside from fenugreek seed extract in biological samples. In present investigation, a rapid, sensitive, selective, specific, robust and reproducible HPLC method for determination of SFSE-G in rat plasma, different tissues, feces and urine has been reported. In the current study, sample preparation was simple and identification of SFSE-G can be completed within 4 min in HPLC. The current method is satisfactory enough to determine the concentration of SFSE-G in plasma, tissue, feces and urine after single oral administration in rats.
Results of the present investigation showed that an array of solvents were screened for the selection of mobile phase in separation of SFSE-G from biosamples however, the best fitted Rf value was worked out when formic acid (0.3%) and acetonitrile was used in a mixture of 80:20 v/v it gives the optimal Rf value of 3.5 min which produce clean chromatograms as well as yielding the highest recovery for the analytes. indicates that following a single oral administration of SFSE-G (200 mg/kg), it showed slow intestinal absorption and then it eliminated from rat plasma with t1/2 of approximately 40.10 h and Tmax 72 h. After following a single oral administration of 200 mg/kg SFSE-G, it showed relatively slow distribution and eliminated in urine and feces after 24 h and could be detected until 108 h post-dosing.
In tissue distribution study, following oral administration of SFSE-G, its concentrations were determined in an array of tissues including the brain, kidneys, liver, lungs, small intestine and adrenal glands, respectively. depicts that concentration of SFSE-G was highest in lung and then in brain which indicated that it has good curative effects on respiratory system diseases and central nervous system related diseases. Distribution of SFSE-G in lung and brain is explained by the high blood flow or perfusion rate to these organs. However, negligible presence of SFSE-G concentration in another tissue may result from poor membrane permeability of drug that is limiting intestinal absorption of SFSE-G. The presence of sugar moieties with high hydrogen bond count and polar surface area in the SFSE-G may produce unfavorable condition for poor membrane permeability of drug.
Conclusion
In conclusion, to the best of our knowledge, this is the first study where we have developed a simple, rapid and sensitive method for the quantitative determination of SFSE-G in biosample including plasma, urine, feces and tissues which can be applied for pharmacokinetics, tissue distribution and excretion of furostanol glycoside, i.e. SFSE-G in rats after oral administration using US-FDA guidelines. The major distribution tissues of SFSE-G in rats were lungs and brain. It efficiently crosses the blood–brain barrier to achieve sufficient concentration in the brain. Its major route of elimination is excretion through urine and feces. The results of the present in vivo pharmacokinetics and disposition studies of SFSE-G in rats will provide helpful information for the development of suitable dosage forms and clinical references on rational administration.
Supplementary material available online
Supplementary Conflict of Interest.
Supplementary File
Download PDF (81 KB)Acknowledgments
The authors would like to acknowledge Dr. S.S. Kadam, Vice-Chancellor and Dr. K.R. Mahadik, Principal, Poona College of Pharmacy, Bharati Vidyapeeth Deemed University, Pune for providing necessary facilities to carry out the study.
Declaration of interest
The authors report no conflicts of interest. The authors alone are responsible for the content and writing of this article. The study was supported by Indus Biotech Private Limited, Pune India but not been involved in the collection, analysis or interpretation of the data; or writing the report.
References
- Yang CL, Or TC, Ho MH, Lau AS. Scientific basis of botanical medicine as alternative remedies for rheumatoid arthritis. Clin Rev Allergy Immunol. 2013;44(3):284–300
- Omeish AF, Abbadi W, Ghanma IM, et al. Hospital-based study on the use of herbal medicine in patients with coronary artery disease in Jordan. Hospital. 2011;67(7):683–687
- Saad B, Azaizeh H, Said O. Tradition and perspectives of Arab herbal medicine: A review. Evid Based Complement Alternat Med. 2005;2(4):475–479
- Tang J, Song X, Zhu M, Zhang J. Study on the pharmacokinetics drug–drug interaction potential of Glycyrrhiza uralensis, a traditional Chinese medicine, with lidocaine in rats. Phytother Res. 2009;23(5):603–607
- Kandhare A, Patil MV, Bodhankar S. l-Arginine attenuates the ethylene glycol induced urolithiasis in uninephrectomized hypertensive rats: Role of KIM-1, NGAL and NOs. Renal Fail. 2015;37(4):709–721
- Kandhare AD, Ghosh P, Bodhankar SL. Naringin, a flavanone glycoside, promotes angiogenesis and inhibits endothelial apoptosis through modulation of inflammatory and growth factor expression in diabetic foot ulcer in rats. Chem Biol Interact. 2014;219C:101–112
- Kandhare AD, Ghosh P, Ghule AE, Bodhankar SL. Elucidation of molecular mechanism involved in neuroprotective effect of Coenzyme Q10 in alcohol induced neuropathic pain. Fundam Clin Pharmacol. 2013;27(6):603–622
- Visnagri A, Kandhare A, Bodhankar S. Renoprotective effect of berberine via intonation on apoptosis and mitochondrial dependent pathway in renal ischemia reperfusion induced mutilation. Renal Fail. 2015;37(3):482–493
- Bashri G, Singh VP, Prasad SM. A review on nutritional and antioxidant values, and medicinal properties of Trigonella foenum-graecum L. Biochem Pharmacol. 2013;2(3):118–120
- Snehlata HS, Payal DR. Fenugreek (Trigonella foenum-graecum L.): An overview. Int J Curr Pharm Rev Res. 2012;2(4):169–187
- Ulbricht C, Basch E, Burke D, et al. Fenugreek (Trigonella foenum-graecum L. Leguminosae): An evidence-based systematic review by the natural standard research collaboration. J Herbal Pharmacother. 2007;7(3–4):143–177
- Basu TK, Srichamroen A. Chapter 28 – Health benefits of fenugreek (Trigonella foenum-graecum leguminosse). In: Watson RR, Preedy VR, eds. Bioactive Foods in Promoting Health. San Diego: Academic Press; 2010:425–435
- Smith M. Therapeutic applications of fenugreek. Altern Med Rev. 2003;8(1):20–27
- Al-Habori M, Raman A. Antidiabetic and hypocholesterolaemic effects of fenugreek. Phytothe Res. 1998;12(4):233–242
- Raghuram T, Sharma R, Sivakumar B, Sahay B. Effect of fenugreek seeds on intravenous glucose disposition in non-insulin dependent diabetic patients. Phytother Res. 1994;8(2):83–86
- Madar Z, Abel R, Samish S, Arad J. Glucose-lowering effect of fenugreek in non-insulin dependent diabetics. Eur J Clin Nutr. 1988;42(1):51–54
- Al-Jasass FM, Al-Jasser MS. Chemical composition and fatty acid content of some spices and herbs under Saudi Arabia conditions. Scientific World J. 2012;2012:1–5
- Kim HP, Son KH, Chang HW, Kang SS. Anti-inflammatory plant flavonoids and cellular action mechanisms. J Pharmacol Sci. 2004;96(3):229–245
- Lee SJ, Son KH, Chang HW, et al. Antiinflammatory activity of naturally occurring flavone and flavonol glycosides. Arch Pharm Res. 1993;16(1):25–28
- Kawabata T, Cui MY, Hasegawa T, Takano F, Ohta T. Anti-inflammatory and anti-melanogenic steroidal saponin glycosides from Fenugreek (Trigonella foenum-graecum L.) seeds. Planta Med. 2011;77(7):705–710
- Mandegary A, Pournamdari M, Sharififar F, Pournourmohammadi S, Fardiar R, Shooli S. Alkaloid and flavonoid rich fractions of fenugreek seeds (Trigonella foenum-graecum L.) with antinociceptive and anti-inflammatory effects. Food Chem Toxicol. 2012;50(7):2503–2507
- Vasil'eva I, Vaniushkin S, Zinov'eva S, Udalova Z, Bolychevtseva I, Paseshnichenko V. Photosynthetic pigments of tomato under conditions of biotic stress and effects of furostanol glycosides. Prikl Biokhim Mikrobiol. 2002;39(6):689–696
- Dubinskaia V, Strelkova L, Vasil'eva I, Nikolaeva S, Rebrov L, Paseshnichenko V. Anabolic properties of furostanol glycosides from Dioscorea deltoidea wall. Biull Eksp Biol Med. 1998;126(8):178–181
- Park S-W, Lee C-H, Shin D-H, Bang N-S, Lee S-M. Effect of SA1, a herbal formulation, on sexual behavior and penile erection. Biol Pharm Bull. 2006;29(7):1383–1386
- Valette G, Sauvaire Y, Baccou J-C, Ribes G. Hypocholesterolaemic effect of fenugreek seeds in dogs. Atherosclerosis. 1984;50(1):105–111
- Aswar U, Bodhankar SL, Mohan V, Thakurdesai PA. Effect of furostanol glycosides from Trigonella foenum-graecum on the reproductive system of male albino rats. Phytother Res. 2010;24(10):1482–1488
- Lu T, Yang J, Gao X, et al. Plasma and urinary tanshinol from Salvia miltiorrhiza (Danshen) can be used as pharmacokinetic markers for cardiotonic pills, a cardiovascular herbal medicine. Drug Metab Dispos. 2008;36(8):1578–1586
- Bhaskaran S, Mohan V, Inventors; Indus Biotech Private Limited, Pune, India, assignee. A composition for treating autoimmune disorders and methods thereof. US patent WO2012150486 A1. Nov 8, 2012; 2012
- U.S. Department of Health and Human Services. Guidance for industry, bioanalytical method validation; 2001. Available at: http://www.fda.gov/cvm
- Bhaskaran S, Vishwaraman M. Composition and method thereof. Google Patents; 2013
- Tian S, He G, Song J, et al. Pharmacokinetic study of baicalein after oral administration in monkeys. Fitoterapia. 2012;83(3):532–540
- Liang L, Liu X, Wang Q, Cheng S, Zhang S, Zhang M. Pharmacokinetics, tissue distribution and excretion study of resveratrol and its prodrug 3,5,4′-tri-O-acetylresveratrol in rats. Phytomedicine. 2013;20(6):558–563
- Kandhare AD, Raygude KS, Ghosh P, Gosavi TP, Bodhankar SL. Patentability of animal models: India and the Globe. Int J Pharm BiolArch. 2011;2(4):1024–1032
- Zhao L, Chen Z, Zhao Q, et al. Developmental toxicity and genotoxicity studies of wogonin. Regul Toxicol Pharmacol. 2011;60(2):212–217
- Kandhare AD, Raygude KS, Ghosh P, Ghule AE, Bodhankar SL. Neuroprotective effect of naringin by modulation of endogenous biomarkers in streptozotocin induced painful diabetic neuropathy. Fitoterapia. 2012;83(4):650–659
- Kandhare AD, Raygude KS, Ghosh P, Ghule AE, Bodhankar SL. Therapeutic role of curcumin in prevention of biochemical and behavioral aberration induced by alcoholic neuropathy in laboratory animals. Neurosci Lett. 2012;511(1):18–22
- Kandhare AD, Shivakumar V, Rajmane A, Ghosh P, Bodhankar SL. Evaluation of the neuroprotective effect of chrysin via modulation of endogenous biomarkers in a rat model of spinal cord injury. J Nat Med. 2014;68(3):586–603
- Brazier NC, Levine MA. Drug–herb interaction among commonly used conventional medicines: A compendium for health care professionals. Am J Ther. 2003;10(3):163–169
- Aggarwal BB, Sung B. Pharmacological basis for the role of curcumin in chronic diseases: An age-old spice with modern targets. Trends Pharmacol Sci. 2009;30(2):85–94
- Jones QR, Warford J, Rupasinghe H, Robertson GS. Target-based selection of flavonoids for neurodegenerative disorders. Trends Pharmacol Sci. 2012;33(11):602–610