
Abstract
Aim: Vascular access (VA) dysfunction limits hemodialysis delivery, which increases morbidity and mortality. The most com mon cause of VA failure is thrombosis, due to flow limiting stenosis resulting from neointimal hyperplasia. This occurs not only due to hemodynamic factors but also by systemic ones related to vascular atherosclerosis, inflammation and calcification, which has developed a simple vascular calcification score (SVCS) predictor of vascular calcification and arterial stiffness. The NKF-K/DOQ recommends several diagnostic procedures for VA surveillance. Blood access flow (Qa) has predictive power for the detection of stenosis. Our aim was to evaluate the role of systemic factors, especially SCVS, on Qa. Material and methods: Transversal study in 50 patients. Qa value was obtained with Blood Temperature Monitor and Doppler method. Pearson coefficient evaluated correlation between them. Clinical, lab and radiological variables were recorded and non-parametric tests evaluated how both Qa varied with them. Results: Pearson’s corelation between DU-Qa and TD-Qa was 0.851 (p-value <0.001). DU-Qa varied significantly with age (p = 0.012), VA type (p = 0.021), SCVS (p = 0.030), intra-access arterial pressure (p = 0.015) and time on dialysis (p = 0.002). BTM-Qa varied significantly with diabetes status (p = 0.027), age (p = 0.017), first VA status (p = 0.036), intra-access arterial pressure (p = 0.028) and dialysis time (p = 0.001). Nevertheless, gender, hypertensive status and analitical parameters did not change the flow values. Conclusion: Higher SVCS was associated only with lower DU-Qas, giving this method an advantage towards the indirect one. Additionally, a simple method like SVCS may be used to guide new surveillance recommendations accordingly to risk stratification.
Introduction
Patients with end-stage renal disease (ESRD) receive maintenance hemodialysis through a vascular access (VA) which dysfunction is one of the most important sources of morbidity and mortality that contributes substantially to the cost of ESRD care.Citation1,Citation2 The most common cause of VA failure is thrombosis, due to flow limiting stenosis resulting from neointimal hyperplasia (NH), which eventually leads to access failure.Citation3–6 NH is a common histopathological lesion found at the sites of venous stenosis in arteriovenous fistula (AVF) and arteriovenous grafts (AVG). Calcium phosphate deposits into these stenotic lesions indicate that vascular calcifications may strongly participate in the VA dysfunction.Citation7,Citation8 In this setting, Adragão et al.Citation9,Citation10 developed a simple vascular calcification score (SVCS) evaluated in plain X-ray of pelvis. This score was associated with higher vascular calcification and arterial stiffness and a predictor of cardiovascular mortality.Citation9,Citation10
National Kidney Foundation-Kidney Disease Outcomes Quality Initiative (NKF-K/DOQI) recommends that accesses should be monitored regularly for the detection of the development of stenosis, and if detected, it should be treated with elective angioplasty or surgery prior to thrombosis.Citation11–13 One of the most powerful predictors of VA failure used in VA surveillance is the access blood flow (Qa), which can be measured using several methods. Direct measurement is performed by Doppler ultrasound (DU).Citation11 However, several indirect methods have been validated, among which the technique based on differential conductivity is well known.Citation14 When Qa is measured repeatedly, trends of decreasing flow add predictive power for the detection of access stenosis, thrombosis and loss of VA patency.Citation15
VA patency is still far below from the desired, therefore investigation of more determinants of failure is essential and will have direct implications for patient care.Citation9,Citation16 The aim of the present study was to evaluate the role of clinical and systemic factors, especially calcification score and mineral metabolism indexes, on the Qa value measured by direct and indirect methods. Secondary end point was to compare both methods regarding the access blood flow determination.
Patients and methods
Transversal study included 50 patients under regular program of post-dilution online hemodiafiltration with 5008S Fresenius Medical Care® monitors (Homburg, Germany), who were randomly selected. DU-Qa was evaluated with a Siemens Acuson X150 Ultrasound machine (Munich, Germany), in the humeral artery, proximally to the anastomosis, by measuring the vessel diameter (D) and the time average velocity (TAV) through the formula: Qa (mL/min) = TAV (cm/s) × D (cm) × 60.Citation10 In the same week we measured Qa, during the first 30 min of the dialysis session, by getting the recirculation values, in normal and reversed position of the blood lines, with the blood temperature sensor BTM® (Blood Temperature Monitor), Fresenius Medical Care, Bad Homburg, Germany, incorporated in the hemodialysis machinesCitation17 (BTM-Qa). According to the Hemodialysis Unit, all patients were punctured with two 15G needles and the prescribed blood flow rate was 400 mL/min.
Demographic variables such as race, age, gender, diabetes and arterial hypertension status, time on dialysis, VA type and time, first VA or not, previous interventions (endovascular or surgicals), serum parathyroid hormone, calcium, phosphate, bicarbonate and magnesium levels, mean venous and arterial pressure, online clearance monitor (OCM), recirculation and SCVS were recorded. This latest parameter was evaluated in plain radiographic films of pelvis and hands, performed in the same centre. The pelvis radiographic films were divided into four sections by two imaginary lines: a horizontal line over the upper limit of both femoral heads and a median vertical line over the vertebral column. The films of the hands were divided, for each hand, by a horizontal line over the upper limit of the metacarpal bones. The presence of linear calcifications in each section was counted as 1 and its absence as 0. The final score was the sum of all the sections, ranging from 0 to 8 (10).
Statistical analysis
We used SPSS 20.0 software for Windows (SPSS, Inc., Chicago, IL). Continuous and categorical variables were expressed as mean ± standard deviation and percentages, respectively. We compared both Qa measurements (BTM and DU) and evaluated their correlation using the paired t-test and Pearson coefficient, respectively. Non-parametric tests were performed to analyze how both Qa values varied with several factors. We rejected null hypotheses of no difference if p-values were <0.05.
Results
We evaluated 50 patients with a mean age of 64.5 ± 13.7 years; average time on dialysis of 51.4 ± 47.3 months and average time of VA of 47.6 ± 42.1 months. Categorical and continuous variables are recorded in and , respectively. Mean DU-Qa was 1032.5 ± 468.7 mL/min, and mean BTM-Qa was 1012.0 ± 492.9 mL/min. Paired t-test between both methods revealed a mean difference of only 20.5 mL/min, with a p-value of 0.624 (>0.05). Correlation coefficient of Pearson was 0.851, p-value 0.000 (<0.001) ().
Figure 1. Simple scatterplot DU – Qa versus BTM-Qa.
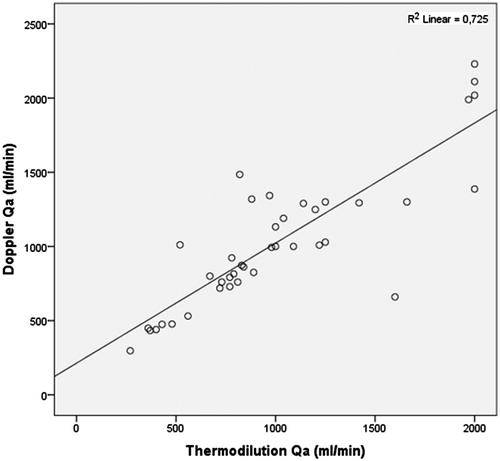
Table 1. Categorical variables.
Table 2. Continuous variables.
DU-Qa varied significantly with age (p = 0.012), time on dialysis (p = 0.002), time of VA (p = 0.049), VA type (p = 0.021), mean intra-access arterial pressure (p = 0.015) and SCVS (p = 0.030) ( and ). BTM-Qa varied significantly with time on dialysis (p = 0.001), mean intra-access arterial pressure (p = 0.028), diabetes status (p = 0.027), age (p = 0.017) and first VA status (p = 0.036) ().
Figure 2. Boxplot DU-Qa according to SCVS.
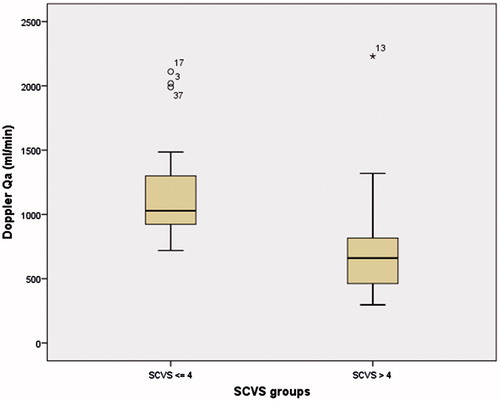
Table 3. Kruskal–Wallis and Mann–Whitney tests.
Discussion
In our study, BTM represented a good indirect method of DU-Qa measurement. Regarding their relative accuracy, we found that they vary differently with several factors. For DU method, as well as BTM, more time on dialysis (>48 months) was significantly associated to a lower Qa. This fact could be explained by longer time of vessels exposure to atherosclerosis, calcification and endothelial inflammation.
In a similar way, patients with their first VA had higher values. A second access certainly reflects a previous failure (primary or not) that is probably associated with higher prevalence and longer exposure to harmful risk factors.
As found by other authors older patients (>65 years) had significantly lower values, which may have to do with vascular aging itself apart from other factors. This age group may need special surveillance to optimize their VA patency.Citation18,Citation19
We also found significantly lower Qa values for more negative intra-access arterial pressure. This result may be justified by the fact that the artery is the vessel that feeds the access and both calcification and stiffness clearly compromise the access well-functioning.
In contrast to previous studies, no significant difference was noticed for Qa measured by both methods, according to gender, hypertensive status, and analytical parameters related with metabolism bone disease.Citation1,Citation20,Citation21
Regarding DU method, according to previous studies, Qa was significantly lower in distal AVFs, probably related with the smaller size of the vessels at this location (20). Similar as time on dialysis, VA time >2 years was associated with lower DU-Qa, which is also probably related with more time of exposure to deleterious factors related to the uremia and dialysis, as already described above.
Regarding BTM method, according to published data, diabetic patients had inferior access flows, increasing their risk of failure.Citation18,Citation22,Citation23 This fact could be associated with a more aggressive atherosclerotic disease, which phatologic mechanisms overlap the NH.
Finally, higher SVCS was associated with lower flows measured by DU (). Several factors may contribute to the intimal lesions and stenosis.Citation24,Citation25 Alterations in blood flow and sheer stress due to the anastomosis configuration and the arterial flow through a low resistance vein are the most mentioned.Citation4–6,Citation26–30 However, some data suggests that uremia and some patient comorbid conditions may contribute to NH prior to VA creation, which can compromise future patency.Citation31 Several conditions like catabolic status,Citation32,Citation33 malnutrition, lower nPCR,Citation33,Citation34 higher plasma cholesterol levels,Citation35 disturbances of calcium and phosphorus, hyperparathyroidism,Citation36,Citation37 diabetes mellitus, smoking, anticardiolipin antibodies, gender, age, use of a dialysis catheter, hypoalbuminemia, as well as, high serum levels of lipoprotein A and fibronectinCitation1,Citation21,Citation38 have been identified as possible predictors of early NH and vascular disease. In a molecular point of view, it is thought that the presence of inflammation and oxidation caused by these multiple factors can predispose to further NH by means of the stimulation of growth factors that promote vascular smooth muscle cell proliferation.Citation30 Parallel to this, mediators such as TNF-α induce mineralization of vascular cells, which explain how inflammation, atherosclerosis and vascular calcification are linked and together facilitate VA failure.Citation39,Citation40 In this setting, a strong predictor of extra esqueletal calcification, especially vascular, like this score may be an additional risk factor to include in monitoring programs.
Conclusion
Access blood flow measured by Doppler ultrasound is highly correlated with the blood temperature sensor BTM® method; furthermore, this direct method is more sensitive to patient-related risk factors for VA failure. Although proper monitoring and surveillance techniques have been shown to improve the overall success of VA care, they are far from being perfect.Citation41 When evaluating hemodialysis VA, we should take into account all the patient’s comorbidities and risk factors to decide the best approach. The SCVS may be an additional predictor of failure that could be included in future recommendations helping identify high risk patients. A modification of screening systems according to risk stratification will allow us to potentially identify subgroups at higher risk of failure to whom intensifying surveillance programs should be considered. This additional tool may improve the overall success of VA care, resulting in cost savings for the healthcare system.
This study has several limitations. The most important is the size of the sample. Additionally, the transversal and observational nature may limit the applicability of some of our conclusions. To the best of our knowledge, despite limitations, till now there are no published data about its association with VA patency.
Declaration of interest
The authors report no conflicts of interest. The authors alone are responsible for the content and writing of the paper.
References
- Feldman HI, Kobrin S, Wasserstein A. Hemodialysis vascular access morbidity. J Am Soc Nephrol. 1996;7:523–535
- Bittl JA, Cohen DJ, Seek MM, Feldman RL. Economic analysis of angiography and preemptive angioplasty to prevent hemodialysisaccess thrombosis. Catheter Cardiovasc Interv. 2010;75:14–21
- Pirozzi N, Garcia-Medina J, Hanoy M. Stenosis complicating vascular access for hemodialysis: Indications for treatment. J Vasc Access. 2014;15:76–82
- Chang CJ, Ko YS, Ko PJ, et al. Thrombosed arteriovenous fistula for hemodialysis access is characterized by a marked inflammatory activity. Kidney Int. 2005;68:1312–1319
- Chang CJ, Ko PJ, Hsu LA, et al. Highly increased cell proliferation activity in the restenotic hemodialysis vascular access after percutaneous transluminal angioplasty: Implication in prevention of restenosis. Am J Kidney Dis. 2004;43:74–84
- Rotmans JI, Pasterkamp G, Verhagen HJ, Pattynama PM, Blankestijn PJ, Stroes ES. Hemodialysis access graft failure: Time to revisit an unmet clinical need? J Nephrol. 2005;18:9–20
- Olsson LF, Odselius R, Ribbe E, Hegbrant J. Evidence of calcium phosphate depositions in stenotic arteriovenous fistulas. Am J Kidney Dis. 2001;38:377–383
- Catalano C, Davi L, Normanno M, Rizzioli E, Conz PA. Vascular calcification of the venous side of an arterious-venous fistula. J Vasc Access. 2001;2:32–34
- Adragão T, Pires A, Lucas C, et al. A simple vascular calcification score predicts cardiovascular risk in haemodialysis patients. Nephrol Dial Transplant. 2004;19:1480–1488
- Adragão T, Pires A, Birne R, et al. A plain X-ray vascular calcification score is associated with arterial stiffness and mortality in dialysis patients. Nephrol Dial Transplant. 2009;24:997–1002
- Vascular Access 2006 Work Group. Clinical practice guidelines for vascular access. Am J Kidney Dis. 2006;48:S176–S247
- Coentrão L, Turmel-Rodrigues L. Monitoring dialysis arteriovenous fistulae: It’s in our hands. J Vasc Access. 2013;14:209–215
- Ibeas López J. Monitorización del acceso vascular: “Quo vadis”. NefroPlus. 2011;4:11–20
- Lindsay RM, Blake PG, Malek P, Posen G, Martin B, Bradfield E. Hemodialysis access blood flow rates can be measured by a differential conductivity technique and are predictive of access clotting. Am J Kidney Dis. 1997;30:475–482
- Bay WH, Henry ML, Lazarus JM, Lew NL, Ling J, Lowrie EG. Predicting hemodialysis access failure with color flow Doppler ultrasound. Am J Nephrol. 1998;18:296–304
- Ibeas-López J, Vallespín-Aguado J. Ecografía del acceso vascular para hemodiálisis: Conceptos teóricos y prácticos. Nefrologia Sup Ext. 2012;3:21–35
- Schneditz D, Kaufman AM, Levin N. Surveillance of access function by the blood temperature monitor. Semin Dial. 2003;16:483–487
- Monroy-Cuadros M, Yilmaz S, Salazar-Bañuelos A, Doig C. Risk Factors associated with patency loss of hemodialysis vascular access within 6 months. Clin J Am Soc Nephrol. 2010;5:1787–1792
- Huijbregts HJ, Bots ML, Wittens CH, Schrama YC, Blankestijn PJ. Access blood flow and the risk of complications in mature forearm and upper arm arteriovenous fistulas. Blood Purif. 2009;27:212–219
- Grandaliano G, Teutonico A, Allegretti A, et al. The role of hyperparathyroidism, erythropoietin therapy, and CMV infection in the failure of arteriovenous fistula in hemodialysis. Kidney Int. 2003;64:715–719
- Ifudu O, Mayers JD, Cohen LS, et al. Correlates of vascular access and nonvascular access-related hospitalizations in hemodialysis patients. Am J Nephrol. 1996;16:118–123
- Huijbregts HJ, Bots ML, Moll FL, Blankestijn PJ. Hospital specific aspects predominantly determine primary failure of hemodialysis arteriovenous fistulas. J Vasc Surg. 2007;45:962–967
- Huijbregts HJ, Bots ML, Wittens CH, Schrama YC, Moll FL, Blankestijn PJ. Hemodialysis arteriovenous fistula patency revisited: Results of a prospective, multicenter initiative. Clin J Am Soc Nephrol. 2008;3:714–719
- Roy-Chaudhury P, Arend L, Zhang J, et al. Neointimal hyperplasia in early arteriovenous fistula failure. Am J Kidney Dis. 2007;50:782–790
- Roy-Chaudhury P, Kelly BS, Miller MA, et al. Venous neointimal hyperplasia in polytetrafluoroethylene dialysis grafts. Kidney Int. 2001;59:2325–2334
- Budu-Grajdeanu P, Schugart RC, Friedman A, Valentine C, Agarwal AK, Rovin BH. A mathematical model of venous neointimal hyperplasia formation. Theor Biol Med Model. 2008;5:2
- Krueger U, Zanow J, Scholz H. Computational fluid dynamics and vascular access. Artif Organs. 2002;26:571–575
- Ene-Iordache B, Mosconi L, Remuzzi G, Remuzzi A. Computational fluid dynamics of a vascular access case for hemodialysis. J Biomech Eng. 2001;123:284–292
- Ocak G, Rotmans JI, Vossen CY, et al. Type of arteriovenous vascular access and association with patency and mortality. BMC Nephrol. 2013;4;14:79
- Wasse H, Huang R, Naqvi N, Smith E, Wang D, Husai A. Inflammation, oxidation and venous neointimal hyperplasia precede vascular injury from AVF creation in CKD patients. J Vasc Access. 2012;13:168–174
- Lee T, Somarathna M, Hura A, et al. Natural history of venous morphologic changes in dialysis access stenosis. J Vasc Access. 2014;15:298–305
- Filippi C, Wasserman S, Rosanio S, et al. Cardiac troponin T and C-reactive protein for predicting prognosis, coronary atherosclerosis, and cardiomyopathy in patients undergoing long-term hemodialysis. JAMA. 2003;290:353–359
- Qureshi AR, Alvestrand A, Divino-Filho JC, et al. Inflammation, malnutrition, and cardiac disease as predictors of mortality in hemodialysis patients. J Am Soc Nephrol. 2002;13:S28–S36
- Dukkipati R, Molnar MZ, Park J, et al. Association of vascular access type with inflammatory marker levels in maintenance hemodialysis patients. Semin Dial. 2014;27:415–423
- Gagliardi GM, Rossi S, Condino F, et al. Malnutrition, infection and arteriovenous fistula failure: Is there a link? J Vasc Access. 2011;12:57–62
- Grandaliano G, Teutonico A, Allegretti A, et al. The role of hyperparathyroidism, erythropoietin therapy, and CMV infection in the failure of arteriovenous fistula in hemodialysis. Kidney Int. 2003;64:715–719
- Rostand SG, Drueke TB. Parathyroid hormone, vitamin D, and cardiovascular disease in chronic renal failure. Kidney Int. 1999;56:383–392
- Bojakowski K, Dzabic M, Kurzejamska E, et al. High red blood cell distribution width predicts failure of arteriovenous fistula. PLoS One. 2012;7:e36482
- Tintut Y, Patel J, Territo M, Saini T, Parhami F, Demer LL. Monocyte/macrophage regulation of vascular calcification in vitro. Circulation. 2002;105:650–655
- Tintut Y, Patel J, Parhami F, Demer LL. Tumor necrosis factor-alpha promotes in vitro calcification of vascular cells via the cAMP pathway. Circulation. 2000;102:2636–2642
- Ram SJ, Magnasco A, Jones SA, et al. In vivo validation of glucose pump test for measurement of hemodialysis access flow. Am J Kidney Dis. 2003;42:752–760