
Abstract
Background: There has been a rapid increase in incident and prevalent rates of hemodialysis (HD) patients in Romania following the 2004 system privatization, but little is known about the impact of privatization on patient outcomes. Methods: We retrospectively examined the outcome during 1 year of 8161 prevalent HD patients registered in the Romanian Renal Registry at 31 December 2011. Standardized mortality ratio (SMR) was calculated for each for-profit (FP) and non-profit (NP) HD provider. Results: The 12-month SMR across all HD chain providers was 1.27. FP Chain 1 and the “other” group had SMR similar to the reference level. The mortality rate was two times higher in public NP dialysis centers than the national reference. A stepwise Cox regression analysis identified older age, male gender, DN as primary renal disease and the HD chain provider to be independently associated with a higher mortality. Excepting patients treated by FP Chain 4, patients treated by all the other dialysis providers had a better outcome than those treated in NP facilities. Conclusion: In conclusion, the increase in number of patients treated was not doubled by an increase in their survival. In the context of an expanding dialysis marketplace that tends to consolidate around large for-profit (FP) providers, further exploration of indicators associated with mortality may guide future healthcare policy to improve patient outcomes.
Introduction
In Romania, the implementation of a privatization project of dialysis services began in 2004, with World Bank (International Finance Corporation) assistance. At that time, all dialysis services were delivered only by public dialysis centers located in hospitals, the number of hemodialysis (HD) machines was insufficient to satisfy the demand of renal replacement therapy (RRT) and the costs of the therapy were uneven along the counties of Romania. However, the number of dialysis facilities, the incident and prevalent rates in dialysis end-stage renal disease (ESRD) patients increased rapidly following privatization: the number of point prevalent dialysis patients increased from 6034 in 2004 to 10,470 in 2012 and the rate of increase in incident patients 2011/2006 was the highest in Europe (+60%).Citation1
Romania, with a population of 20,121,641 and 14,879 ESRD patients on 31 December 2012, stands the seventh largest country in the European Union (EU). According to the Romanian Renal Registry (RRR), 88% of the ESRD patients were treated by dialysis in private centers in 2012.Citation1 HD is initiated in public, non-profit (NP) facilities and then the patients are referred to private, FP centers. Chain membership is a managerial form, like franchising, where a single company owns a number of dialysis centers. In 2012 there were four FP companies which together owned 77% of the dialysis market in Romania.Citation1
Since the large dialysis providers are FP entities, differences in practice patterns across chains and, consequently, in the outcome of the patients might be expected. For example, there were reports suggesting that FP centers seem to use lower resources and to have higher mortality rates.Citation2–6 Furthermore, variation between chains exists in erythropoietin-stimulation agents and IV iron for anemia management, mineral metabolism management (selective vitamin D receptors activators, non-calcium phosphate binders), and vascular access practice.Citation6–8 Therefore, we aimed to evaluate the impact of chain ownership on the HD patients’ survival using the standardized mortality ratio (SMR).Citation9
Methods
All data used in the present study were obtained from the RRR; the Registry monitors the outcome in over 95% of ESRD patients in the country.Citation1 The SMR summarizes the mortality at a facility level, relative to the mortality that would be expected, adjusted for a range of variables like race, age, primary renal disease (PRD). The SMR equals the ratio of the observed number of deaths (OD) divided by the expected number of deaths. Qualitatively, individual facilities are classified as having higher (SMR > 1.0), lower (SMR < 1.0) or as expected (SMR = 1.0) mortality compared to the national death rates for patients with the same characteristics as those in the facility.Citation9
National reference death rates were calculated on a cohort of 11,829 HD patients alive on 1 January 2010, who were monitored over a 3-year period. Patients who started HD 90 days before 1 January were excluded, and those who received kidney transplantation or were lost to follow-up were censored. National death rates were adjusted for age and PRD: diabetic nephropathy (DN), vascular nephropathy (VN), glomerulonephritis (GN), other and not assessed (NA). The national reference death rates were calculated according to the methodology proposed by Wolfe et al. ().Citation9
Table 1. HD national death rates during 2010–2012 per 1000 patient years at risk among patients alive at 1 January, by age and PRD.
We retrospectively examined the outcome during 1 year of all prevalent HD patients registered in the Romanian Renal Registry at 31 December 2011. We excluded patients younger than 18 years, those who had recovery of renal function or were lost to follow up during the first 90 days. The data available for analyses were age, gender, PRD, date of first HD, date and cause of death. The expected death rate for each patient adjusted for age and PRD was obtained from the national death rate table (); this rate was multiplied by each patient follow-up time in order to obtain an expected probability of death. The sum of all patients’ probabilities was the expected number of deaths (ED) for the respective dialysis provider. The OD in the dialysis chain was divided by the ED to obtain the SMR. The 95% confidence intervals for SMR were calculated using the method described by Breslow and Day.Citation10 Starting with day 91 of ESRD, facility treatment history was determined for each patient, the allocation to a certain facility was recorded only after the patient has been treated there for at least 60 days.
Dialysis vintage was defined as the duration of time between the first day of HD treatment and the first day of the study. Categorical variables are presented as percentages, and comparisons were performed with the χCitation2 test. Continuous variables are displayed as mean or median with 95% confidence interval, according to their distribution. Comparisons were done with the Student T test or the Kruskal–Wallis test, as appropriate. The relationships between HD chain providers, patient mobility and survival were analyzed using Cox proportional hazard (CPH) models, with the number of inter-center transfers expressed as a continuous variable. A p ≤ 0.05 was considered statistically significantly. Analyse-it (Analyse-it Software, Ltd., Leeds, UK) and SPSS (SPSS Inc., Chicago, IL) software were used to analyze the data.
Results
A total of 8161 prevalent HD patients from 137 facilities fulfilled the study criteria. Median age was 56.9 years and more than half were of male gender. Glomerulonephritis was the main PRD, followed by diabetic and vascular nephropathies. However, the primary diagnosis was unknown in a large proportion of patients (26%). Median HD vintage at the beginning of the study was 3.1 years ().
Table 2. Patient characteristics by HD chain provider.
There were no differences between the HD providers regarding the age and gender. However, patients treated in FP Chain 1, the largest chain, tended to have a higher HD vintage than the rest ().
A total of 803 patients died during the period of the study. Cardiovascular disease was the leading cause of death. The highest mortality was observed in the NP dialysis centers, followed by FP Chain 4, while the other centers had a similar percentage of fatal cases ().
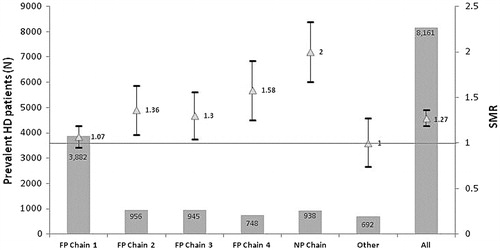
The 12-month SMR across all HD chain providers was 1.27, which suggests a 27% increase in mortality rate compared to the national death reference obtained from the 2010 to 2012 pooled data. FP Chain 1 and the “other” group had SMR similar to the reference level. The mortality rate was two times higher in public NP dialysis centers than the national reference ().
Figure 1. SMR in HD patients by provider.
A stepwise Cox regression analysis identified older age, male gender, DN as PRD and the HD chain provider to be independently associated with a higher mortality. Excepting patients treated by FP Chain 4, patients treated by all the other dialysis providers had a better outcome than those treated in NP facilities. Mobility between centers and HD vintage were not significantly associated with mortality in this model and are not displayed ().
Table 3. Multivariate CPH model.
Discussion
There has been a rapid increase in incident and prevalent rates in dialysis ESRD patients in Romania following privatization, but little is known about the impact of privatization on patient outcomes. In addition, the present study is the first to explore the relationship between profit status of HD facilities and mortality in Central and Eastern Europe. We found that the mortality rate is double in non-profit centers (in our country hospital-based facilities), than the national reference. Furthermore, belonging to the NP chain was an independent predictor of mortality. Interestingly, patients’ mobility between centers does not seem to influence the outcome, which suggests uniformity in the quality of healthcare between dialysis providers.
In 2012, the prevalence of dialysis patients in Romania was around 524 treated patients per million people, which is well below the average European prevalence of approximately 750; about 90% of HD patients were treated in private centers.Citation1 Therefore, the local dialysis market has significant room to grow. In this context, there has been an accelerated movement in the dialysis market toward concentration, with most of the small players acquired by the large local or international companies.Citation1 Thus, in line with the 2012 RRR report, we found that four FP Chains own 80% of the market. Moreover, FP Chain 1 seems to be the market leader with 48% of all prevalent HD patients.
Median age of our prevalent HD cohort was lower than the median age of the countries reporting individual patient data to the ERA-EDTA Registry (56.9 vs. 61.6 years).Citation11 Among the causes of ESRD, GN was the leading cause, followed by DN. This finding is similar to that registered in Norway (GN 29.1%, DN 11.4%), Netherlands (GN 16.7%, DN 11.8%) and Iceland (GN 23.7%, DN 11.4%).Citation11 Also, these results seem to explain the findings of the EVEREST study (Explaining the Variation in Epidemiology of RRT through Expert Opinion, Secondary Data Sources, and Trends over Time), based on a 2003–2005 cohort, in which Romanian patients had the best 2-year unadjusted survival on dialysis (89.8%).Citation12 However, from all the countries evaluated in the EVEREST study, Romania had the lowest rate of incident dialysis patients; the incident patients had the lowest mean age and the lowest prevalence of diabetes.Citation12
SMR was first used by the United States Renal Data System to adjust for variations in patients characteristics, since facilities with highly morbid populations have increased unadjusted mortality rates.Citation10 In addition to providing a quantitative measurement for the patient survival, SMR can also be used to identify centers with poor performance and, consequently, to help monitor the rectification process.Citation13 Our analysis suggests the Romanian HD patients’ mortality increased by over 27% in 2012 as compared to the reference cohort (2008–2010). Furthermore, there were no dialysis providers to have a mortality rate below 1.00, which suggests similar poor performance across chains. Since SMR implies adjustment, the increase in age or in the diabetes mellitus prevalence does not fully explain the increase in mortality rate. FP Chain 1 and the “other” group had SMR comparable to the national reference level. However, while FP Chain 1 is the largest dialysis provider and probably had implemented protocols of care in each center, many small providers with different standard clinical practices form the “other group”, which underlines the limits of SMR analysis. Moreover, a center can provide an excellent care to a subgroup of patients and a deficient care to another subgroup, which would lead to a SMR of almost 1.00 by cancelling the two effects. Therefore, SMR is only an orienting parameter, which can indicate a care issue, but without additional analyses cannot identify the causes of a poor performance. Spiegel et al. identified five factors that distinguish facilities with below from those with higher than expected mortality: multidisciplinary care, continuing medical education programs, more resourceful and knowledgeable dieticians, patient discipline following medical advice and willingness of the patients to learn from staff about self-care.Citation14 This suggests that better SMR outcomes are related to a coordinated and multidisciplinary, holistic, approach of the patient.
In the present study, we found that patients treated in FP Chains had a better outcome than those treated in NP Chain. This finding is in contrast with previous studies from the United States that found FP facilities to have higher rates of mortality than NP ones.Citation4–6,Citation15 Additionally, hospitalization rates were significantly higher in patients receiving HD in FP facilities.Citation16 However, Foley et al. and Brooks et al. based on data from the USRDS found no relationship between ownership and patient mortality.Citation17,Citation18 Furthermore, Kramer et al. using aggregated unadjusted survival probabilities from 22 renal registries worldwide for patients starting dialysis between 2003 and 2005, including Romania, found no association between a country’s private FP share of HD facilities and mortality on dialysis.Citation19 In our case, all NP centers are hospital-based facilities, which initiate the treatment (period with the highest death risk) and treat the cases with the highest burden of comorbidities, as many patients from FP Chains are transferred to hospital-based centers if their status substantially deteriorates. All these might explain the poorer performance of NP Chain in terms of both SMR and survival when compared to FP Chains and suggest that public sector functions in Romania merely as a backup for private sector.
From an economic perspective, FP dialysis centers are profit maximizers, which might reflect in clinical practice. For example, in order to lower the average cost per HD session, FP centers use less labor and equipment per treatment.Citation3 Furthermore, a number of published studies suggest that factors related to practice patterns, like dialysis dose, vascular access, medication can influence patient outcomes.Citation20 Interestingly, in our country Mircescu et al., in a model restricted only to centers that performed both peritoneal dialysis (PD) and HD, found that patients from centers with more than 20 subjects on PD had a better survival.Citation21 Since FP Chains have the largest centers, the higher level of experience and staff coordination might be found in these facilities.Citation1
The current study has several limitations. First, the study design was observational, based on registry data and the relationship between type of facility and patient mortality should not be interpreted as causal. Second, the observed differences across facilities could be explained by many other factors that were not available for analysis. Third, regarding the SMR, it is worth mentioning that the reference value is the national average mortality rate, which might not necessarily correspond to an optimum of care. Fourth, since all NP centers are hospital-based facilities, which initiate the treatment and treat the complex cases, there can be a referral bias.
In conclusion, privatization of the dialysis services allowed more patients to access the dialysis therapy. However, the increase in number of patients treated was not doubled by an increase in their survival. In the context of an expanding dialysis marketplace that tends to consolidate around large FP providers, further exploration of indicators associated with mortality may guide future healthcare policy to improve patient outcomes.
Declaration of interest
The authors report no conflicts of interest. The authors alone are responsible for the content and writing of the paper.
The present study was financed by European Union using Sectoral Operational Program Human Resources Development (POSDRU) program – POSDRU/159/1.5/S/133377.
References
- Romanian Renal Registry Annual Report 2012. Bucharest: “Dr Carol Davila” Teaching Hospital of Nephrology
- Held PJ, Garcia JR, Pauly MV, Cahn MA. Price of dialysis, unit staffing, and length of dialysis treatments. Am J Kidney Dis. 1990;15:441–450
- Griffiths RI, Powe NR, Gaskin DJ, Anderson GF, de Lissovoy GV, Whelton PK. The production of dialysis by for-profit versus not-for-profit freestanding renal dialysis facilities. Health Serv Res. 1994;29:473–487
- McClellan WM, Soucie JM, Flanders WD. Mortality in end-stage renal disease is associated with facility-to-facility differences in adequacy of hemodialysis. J Am Soc Nephrol. 1998;9:1940–1947
- Devereaux PJ, Schunemann HJ, Ravindran N, et al. Comparison of mortality between private for-profit and private not-for-profit hemodialysis centers: A systematic review and meta-analysis. JAMA. 2002;288:2449–2457
- Zhang Y, Cotter DJ, Thamer M. The effect of dialysis chains on mortality among patients receiving hemodialysis. Health Serv Res. 2011;46:747–767
- Thamer M, Zhang Y, Kaufman J, Cotter D, Dong F, Hernan MA. Dialysis facility ownership and epoetin dosing in patients receiving hemodialysis. JAMA. 2007;297:1667–1674
- USRDS 2007 Annual Data Report: Atlas of End-Stage Renal Disease in the United States. Bethesda (MD): National Institutes of Health, National Institute of Diabetes and Digestive and Kidney Diseases
- Wolfe RA, Gaylin DS, Port FK, Held PJ, Wood CL. Using USRDS generated mortality tables to compare local ESRD mortality rates to national rates. Kidney Int. 1992;42:991–996
- Wolfe RA. The standardized mortality ratio revisited: Improvements, innovations, and limitations. Am J Kidney Dis. 1994;24:290–297
- ERA-EDTA Registry Annual Report 2012. Amsterdam: Academic Medical Center, Department of Medical Informatics
- Caskey FJ, Kramer A, Elliott RF, et al. Global variation in renal replacement therapy for end-stage renal disease. Nephrol Dial Transplant. 2011;26:2604–2610
- Stivelman JC, Soucie JM, Hall ES, Macon EJ. Dialysis survival in a large inner-city facility: A comparison to national rates. J Am Soc Nephrol. 1995;6:1256–1261
- Spiegel B, Bolus R, Desai AA, et al. Dialysis practices that distinguish facilities with below- versus above-expected mortality. Clin J Am Soc Nephrol. 2010; 5:2024–2033
- Irvin RA. Quality of care differences by ownership in United States renal dialysis facilities. ASAIO J. 2000;46:775–778
- Dalrymple LS, Johansen KL, Romano PS, et al. Comparison of hospitalization rates among for-profit and nonprofit dialysis facilities. Clin J Am Soc Nephrol. 2014;9:73–81
- Foley RN, Fan Q, Liu J, et al. Comparative mortality of hemodialysis patients at for-profit and not-for-profit dialysis facilities in the United States, 1998 to 2003: A retrospective analysis. BMC Nephrol. 2008;9:6
- Brooks JM, Irwin CP, Hunsicker LG, Flanigan MJ, Chrischilles EA, Pendergast JF. Effect of dialysis center profit-status on patient survival: A comparison of risk-adjustment and instrumental variable approaches. Health Serv Res. 2006;41:2267–2289
- Kramer A, Stel VS, Caskey FJ, et al. Exploring the association between macroeconomic indicators and dialysis mortality. Clin J Am Soc Nephrol. 2012;7:1655–1663
- Ortiz A, Covic A, Fliser D, et al. Epidemiology, contributors to, and clinical trials of mortality risk in chronic kidney failure. Lancet. 2014;383:1831–1843
- Mircescu G, Stefan G, Garneata L, Mititiuc I, Siriopol D, Covic A. Outcomes of dialytic modalities in a large incident registry cohort from Eastern Europe: The Romanian Renal Registry. Int Urol Nephrol. 2014;46:443–451