
Abstract
Background: Contrast-induced nephropathy (CIN) is a complex syndrome of acute nephropathy that occurs following infusion of intravascular contrast agents, and is associated with an increased risk for adverse cardiovascular events. While there is no ideal biomarker for making an early diagnosis of CIN, we hypothesized that levels of specific circulating microRNA (miRNA) species might serve such a role. Methods: miRNA microarray assays were used to detect miRNAs in the kidney tissue of rats studied as an animal model of CIN. Real-time PCR was performed to validate results of the microarray assays. Kidney-enriched miRNAs detected in rat plasma were used as biomarkers to screen for CIN. Results obtained from the rat model of CIN were further validated in human patients with CIN. Results: Fifty-one miRNAs were aberrantly expressed in the kidney tissues between CIN and control rats; and among these, 17 miRNAs showed a >2-fold change of expression in the kidney tissues of CIN rats when compared with their expressions in non-CIN control rats. Among the 17 miRNAs aberrantly-expressed miRNAs screened from kidney tissue, only six also showed significantly different expression in the plasma of CIN rats. When compared with their levels in non-CIN control rats, the levels of three miR-30 family members (miR-30a, miR-30c, and miR-30e), as well as miR-320, were significantly increased in the plasma of CIN rats, while the plasma levels of miRNAs let-7a and miR-200a were significantly decreased. In a validation study of these results conducted with human plasma samples, only miR-30a, miR-30c, and miR-30e showed > 2-fold increases in CIN patients when compared with non-CIN patients. Receiver operating curves constructed to examine the abilities of miR-30a, miR-30c, and miR-30e to discriminate CIN patients from non-CIN patients showed AUCs of 0.954, 0.888, and 0.835, respectively. Conclusions: Our study provides the first evidence that plasma miRNAs, and especially three miR-30 family members (miR-30a, miR-30c, and miR-30e), might serve as early biomarkers and (or) target candidates for CIN.
Introduction
Contrast-induced nephropathy (CIN) is presently the third leading cause of hospital-acquired acute kidney injury, and causes ∼12% of all cases of acute renal failure.Citation1 To lower the incidence of CIN, it is vital to identify patients at risk and apply proven preventive interventions.Citation1,Citation2 The term CIN has traditionally implied an impairment of renal function, which is defined as an increase in a patient’s serum creatinine (SCr) concentration following intravascular administration of a contrast agent.Citation1,Citation2 However, SCr levels are elevated at a relatively late stage of CIN (>24–48 h), and lack the sensitivity and specificity needed to make an early diagnosis. Thus, the early diagnosis of CIN (i.e., within 12 h) remains challenging. As a result, the identification of novel biomarkers that can be used to detect early stages of kidney injury after administration of a contrast agent remains a high priority.
MicroRNAs (miRNAs) represent a new class of endogenous small non-coding RNA molecules that regulate gene expression at the post-transcriptional levelCitation3. miRNAs regulate translation of mRNA by binding to the 3′ untranslated region of mRNA and then mediating numerous physiological and pathophysiological processes. Stabilized forms of miRNA which are resistant to RNase A digestion can be detected in blood and urine, and are thought to be potential biomarkers for various diseases. Previous studies have identified critical roles for miRNAs in regulating kidney development and maintaining the structural and functional integrity of the renal collecting system and glomerular barrier.Citation4,Citation5 Additionally, recent studies have identified a number of miRNAs that are dysregulated in several animal models of kidney disease, and shown that specific miRNA species can serve as biomarkers for several early-stage kidney diseases.Citation4,Citation5 However, the roles of miRNA in CIN have never been investigated. In the present study, we hypothesized that specific circulating miRNA species could be used as early predictive markers for monitoring the development of CIN.
Materials and methods
Studies using the rat model of CIN
Animals and experimental protocol
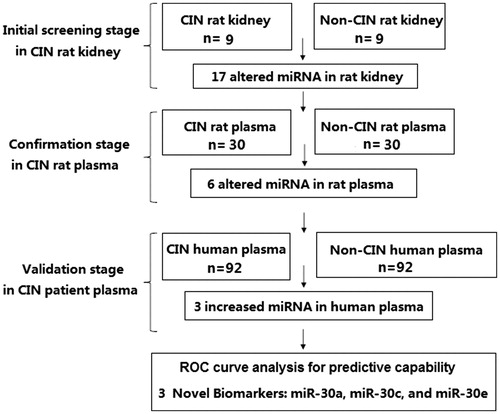
The research approach of this study is shown in . All animal studies were performed in accordance with guidelines developed by the National Institutes of Health, and the study protocol was approved by the Ethics Committee of Universidad Autónoma de la Ciudad de México. Adult Sprague-Dawley male rats (220–300 g) were randomly assigned to a CIN-induced group or a control group. Rats in the CIN-induced group were treated according to a previously described CIN protocolCitation6 which involved a 24-h period of dehydration, followed by dosing with furosemide (10 mg/kg), indomethacin (10 mg/kg), and iohexol (10 mL/kg). Rats in the control group were injected with PBS alone at each time point. All drugs were injected into the tail vein under conditions of mild sevoflurane-induced anesthesia. To verify the success of modeling, SCr was detected. Samples of kidney tissue were harvested, frozen in liquid nitrogen, and used for miRNA screening with microarray assays. For plasma miRNA detection, 1 mL of blood was collected by the tail-cutting method, followed by the abdominal infusion of 1 mL of 0.9% saline. Plasma miRNAs were detected 3, 6, 12, 24 and 48 h after the contrast media injection.
Figure 1. A flow diagram of the research design of our study.
Total RNA (including miRNA) extraction
Total RNA was extracted from samples of rat kidney tissue using chloroform and Trizol reagent (Invitrogen, Carlsbad, CA), and purified using a miRNeasy RNA extraction kit (Qiagen, Valencia, CA). RNA purity was assessed by the RNA concentration, and quantified using an Agilent 2100 Bioanalyzer (Agilent Technologies, Santa Clara, CA). Total RNA was extracted from plasma and isolated using a miRNeasy Serum/Plasma kit (Qiagen) according to the manufacturer’s instructions. Ce_miR-39 miRNA mimic was spiked into the mixture and served as an internal control.
miRNA microarray processing and analysis
A custom-designed miRNA microarray assay provided by LC Science (Houston, TX) was used to screen for expression of different miRNAs in samples of rat kidney tissue. Small RNAs (<300 nt) were isolated from total RNA by the use of a YM-100 Microcon centrifugal filter (Millipore; Billerica, MA). Poly(A) polymerase was used to extend small RNAs by addition of a poly(A) tail. This was followed by ligation of an oligonucleotide tag onto the poly(A) tail for later fluorescent dye staining. Hybridization on a μParaflo microfluidic chip was performed overnight using a micro-circulation pump (Atactic Technologies; Houston, TX).Citation7 Each microfluidic chip contained detection probes and control probes. The detection probes were created in situ by photogenerated reagents. These probes consisted of modified nucleotide coding sequences that were complementary to targeted miRNAs, and a spacer segment of polyethylene glycol that was used to extend the coding sequences away from the substrate. Hybridization was performed at 34 °C using 100 μL of 6× saline–sodium phosphate–EDTA buffer (0.90 M NaCl; 60 mM Na2HPO4; 6 mM EDTA; pH 6.8) containing 25% formamide. Fluorescence labeling with tag-specific Cy5 dye was used for post-hybridization detection. An Axon GenePix 4000B Microarray Scanner (Molecular Device, Union City, CA) was used to collect the fluorescent images, which were then digitized using Array-Pro image analysis software (Media Cybernetics; Rockville, MD). Data were analyzed by first subtracting the background, and then normalizing the remaining signals using a LOWESS (locally-weighted regression) filter.Citation8 Detectable miRNAs were selected based on the following criteria: (1) signal intensity >3-fold the background standard deviation; (2) a spot coefficient of variation (CV) <0.5, where CV = standard deviation/signal intensity. When repeating probes were present on an array, the transcript was classified as detectable only if signals from ≥50% of the repeating probes were above the detection limit. To identify miRNAs whose expression differed between the CIN and control rats, statistical analysis was performed. The ratio of the two sets of detected signals (log 2 transformed, balanced), and p-values from the t test were calculated; differentially detected signals were defined as those with p-values <0.01. miRNAs with a signal that changed by >2-fold were selected for detection in plasma.
Reverse transcription-real time quantitative PCR
Reverse transcription-real time quantitative PCR (RT-qPCR) was performed on selected differentially expressed miRNAs as a means of validating the microarray results in our current study. Reverse transcription reactions were performed using miScript II RT kits (Qiagen), and quantitative PCR was performed using a miScript SYBR Green PCR Kit (Qiagen) and miScript Primer Assay (Qiagen) in conjunction with an ABI PRISM7900HT sequence-detection system (Applied Biosystems; Carlsbad, CA). Reverse transcription reactions were conducted at 42 °C for 60 min, followed by 70 °C for 15 min, and then held at 4 °C. PCR was performed as follows: 95 °C for 2 min, 40 cycles of 95 °C for 15 s, and 60 °C for 30 s. All reactions were run in triplicate. The relative expression level (i.e., fold change) for each miRNA was calculated using the comparative cycle threshold 2−ΔΔCt method. Genes for U6 small nuclear RNA (snRNA) and Ce_miR-39 were used as housekeeping genes for kidney tissue and plasma, respectively.
Studies in patients undergoing coronary intervention
Patient population and study protocol
Studies in human CIN patients were performed to validate our results obtained in CIN rats. Between 1 February 2013 and 30 June 2014, we prospectively screened and enrolled 1248 consecutive patients who were scheduled to undergo coronary interventional procedures. CIN was defined according to its following established definition in the literature: either a >25% increase in SCr or an absolute increase in serum Cr to ≥0.5 mg/dL at 24–48 h after administration of contrast agents, when no other major kidney insult can be identified.Citation1,Citation2 Renal function was monitored by measuring SCr, and all patients had SCr assessment before PCI and 3, 6, 12, 24, and 48 h post-PCI. eGFR was assessed as described by the Modification of Diet in Renal Disease Study GroupCitation9: eGFR = 186.3 × SCr [μmol/L] − 1.154 × age − 0.203 × 0.742 (if female). Patient exclusion criteria were: (1) the use of drugs with renal toxicity; (2) severe heart failure, hepatic dysfunction or renal dysfunction (defined as an eGFR value <30 mL/min/1.73 m2); (3) an acute or chronic infectious disease; (4) an inflammatory disease or autoimmune disorder; (5) a known malignant disease and (6) lack of patient consent to participate in the study. All patients were maintained in a euvolemic state with intravenous 0.9% saline at rate 1 mL/kg/h for 12 h before and 12 h after coronary interventional procedures. Variation in the hydration rate was allowed for adjustments according to the clinical heart function of individual patient. All patients were encouraged to drink if they were thirsty. The study protocol was written in accordance with the Declaration of Helsinki and was approved by the Ethics Committee of Universidad Autónoma de la Ciudad de México. All patients signed a written Informed Consent prior to enrollment.
Analysis of miRNAs in human blood samples
Samples of fasting blood were collected from patients prior to and at 3, 6, 12, 24, and 48 h after their coronary artery procedure. For the human miRNA RT-qPCR assay, total RNA including miRNA was isolated from plasma samples using TRIzol reagent (Invitrogen) and purified using a miRNeasy mini kit (Qiagen). RNA quality was determined using an Agilent 2100 Bioanalyzer. TaqMan probe-based qRT-PCR was conducted according to the manufacturer’s instructions. cDNA was reverse-transcribed from RNA samples using a miRNA-specific, stem-loop RT primer from the TaqMan Small RNA Assay kit and reagents from the TaqMan MicroRNA Reverse Transcription Kit (Applied Biosystems). In the Real-time PCR step, PCR products were amplified from samples of cDNA using the TaqMan Small RNA Assay together with TaqMan Universal PCR Master Mix 2 an the Applied Biosystems 7900 Sequence Detection System. All samples were analyzed in triplicate when quantifying the levels of miRNAs in independent samples. miRNAs with a CT <30 and showing a ≥2-fold increase in CIN patients compared with non-CIN control subjects were selected for further study. Absolute concentrations of circulating miRNA were calculated based on an equation generated by a standard curve, and using synthetic miRNA oligonucleotides purchased from TaKaRa (Kyoto, Japan).
Statistical analysis
All statistical analyses were performed using PASW Statistics for Windows, Version 18.0 (SPSS Inc., Chicago, IL). Values for miRNA concentrations are expressed as the mean ± SD. The Shapiro–Wilk test was used to examine normal distribution. The student’s t-test and one-way ANOVA, followed by the Student–Newman–Keuls test, were used to compare continuous variables. Categorical data are presented as absolute values and percentages. For patient study, we used propensity-score analysis to match CIN patients with non-CIN patients in a one-to-one fashion to minimize potential confounding in the comparisons.Citation10 The propensity score used to match the baseline high-risk characteristics of the two groups was computed for each patient by means of a multivariate logistic model including the following variables: age, gender, body mass index, hypertension, diabetes, hyperlipidemia, smoking, prior AMI, prior PCI, previous coronary bypass, ejection fraction, hemoglobin level, blood creatinine, basal eGFR, total procedure duration and total contrast volume. Patients were subdivided according to their propensity deciles, and a sample-matching technique was performed to select an equal number of patients in the two groups on the basis of similar propensity scores. The procedure yielded two well-matched subgroups of 92 patients from our total cohort. Receiver operating characteristic (ROC) curves were constructed, and the area under each ROC curve (AUC) was calculated and used to evaluate the sensitivity and specificity of a particular miRNA for predicting CIN. To determine the correlation between two parameters, the Spearman rank correlation coefficient (Spearman’s rho) was used. All hypothesis testing was two-tailed, and p-values <0.05 were considered statistically significant.
Results
Altered renal function parameters in CIN rats
At 24 h after injection with contrast agent, rats in the CIN-induced group exhibited elevated levels of SCr and decreased creatinine clearance when compared with the control rats (0.34 ± 0.08 mg/dL vs. 0.71 ± 0.18 mg/dL; p = 0.03 and 1.82 ± 0.35 mL/min vs. 0.98 ± 0.21 mL/min; p = 0.01, respectively).
Identification of altered miRNAs in kidney tissue of CIN rats
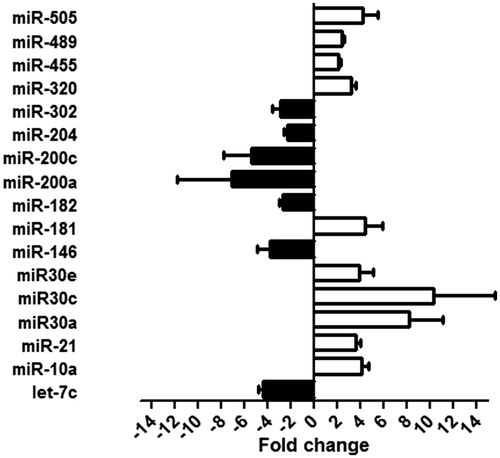
We screened the miRNAs found in the kidneys of CIN rats to identify those that were aberrantly expressed and might serve as biomarkers for CIN. Our microarray assay results identified 51 miRNAs that showed different levels of expression in the kidneys of CIN rats versus control rats. Among those 51 miRNAs, 17 miRNAs showed a >2.0-fold change in expression based on different fluorescence intensities in the CIN and control groups. The miRNAs which showed elevated expression levels included miR-10a, miR-21, miR30a, miR30c, miR30e, miR-181, miR-320, miR-455, miR-489, and miR-505. The down-regulated miRNAs included miRNAs let-7c, miR-146, miR-182, miR-200a, miR-200c, miR-204, and miR-302. A validation of the microarray assay results by RT-qPCR analysis is shown in .
Figure 2. Altered miRNAs expression in kidney tissue of CIN rats. Fold changes were observed in kidney tissue of CIN rats compared with control rats according to the validation result of quantitative real-time PCR.
Identification of altered miRNAs in the plasma of CIN rats
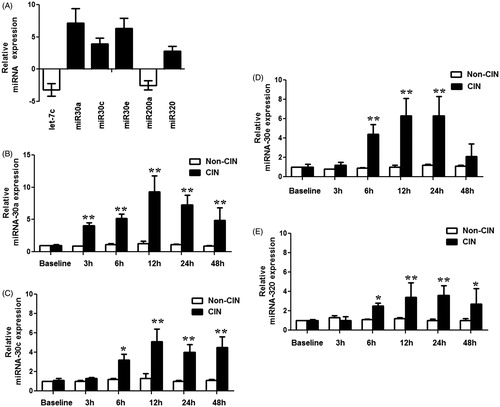
In order to identify miRNAs arising from the kidney that could serve as plasma-borne biomarkers of CIN, we investigated whether miRNAs regulated in kidney were also regulated in the plasma of CIN rats. Levels of various plasma miRNAs were assayed at 3 h, 6 h, 12 h, 24 h, and 48 h after injection of the contrast agent. Among the 17 aberrantly-expressed miRNAs found in CIN rat kidney tissue, only six showed significantly altered levels in the plasma of CIN rats. The levels of three kidney-enriched miR-30 family members (miR-30a, miR-30c, and miR-30e) as well as miR-320 in plasma were significantly increased, while the levels of miRNAs let-7a and miR-200a in plasma were significantly decreased in the CIN rats when compared with non-CIN rats (). A time-course study showed significantly increased levels of miR-30a in plasma within 3 h after injection of a contrast agent, and increased levels of miR-30c, miR-30e, and miR-320 within 6 h after injection. These results suggested that plasma levels of miR-30a, miR-30c, miR-30e, and miR-320 might serve as early biomarkers for CIN.
Figure 3. Altered miRNAs in plasma of CIN rats. (A) miRNA expression changes in plasma of CIN rats compared with control rats, measured by RT-qPCR analyses. (B–E) Time-course of miR-30a (B), miR-30c (C), miR-30e (D), and miR-320(E) in plasma of CIN and non-CIN rats. *p < 0.05; **p < 0.01, compared with non-CIN rats.
Validation of candidate miRNAs as CIN biomarkers in humans
Disparities among species might hamper the transfer of findings discovered in rats to their application in humans. We therefore examined the plasma miRNA levels in humans with or without CIN to validate our results found in rats. Among the 1436 patients who underwent a coronary interventional procedure, CIN occurred in 135 (9.4%) patients (CIN group). After excluding patients who did not meet enrollment criteria for the present study, a propensity score-matched analysis conducted to minimize potential confounding in comparisons yielded 92 matched pairs of patients from both the CIN and non-CIN groups. The 92 matched pairs in the two groups of patients showed no significant differences in baseline their characteristics, except for total contrast volume (). The mean SCr level in the group of CIN patients (1.19 ± 0.40 mg/dL) was significantly higher than that in the group of non-CIN patients (0.78 ± 0.21 mg/dL) only at 48 h after injection of the contrast agent (p < 0.05). Additionally, there were significant differences (p < 0.05) in eGFR values between the CIN and non-CIN patients at both 24 and 48 h following their interventional procedure ().
Figure 4. Dynamic changes in the SCr and eGFR values in study patients. Samples of fasting blood were collected from patients prior to and at 3, 6, 12, 24, and 48 h after their coronary artery procedure. Renal function was monitored by measuring SCr (A) and eGFR (B) in study patients. *p < 0.05, compared with patients without CIN.
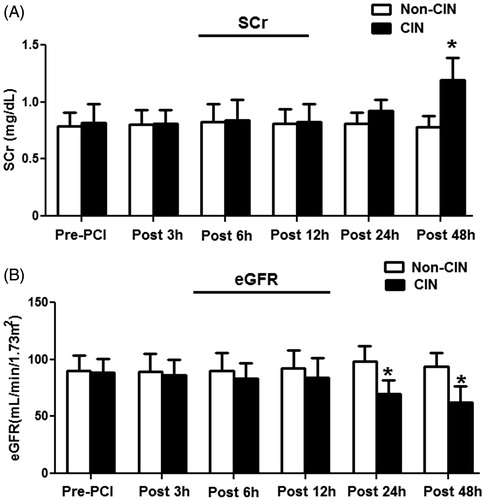
Table 1. Basal characteristics of study patients.
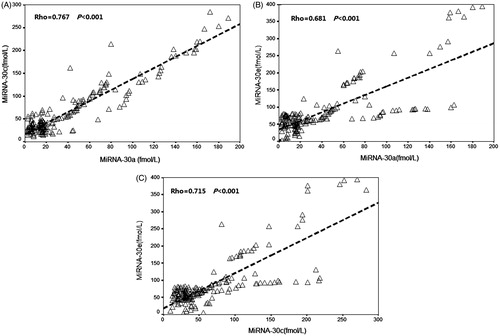
We next assessed the levels of plasma miR-30a, miR-30c, miR-30e, and miR-320 in the CIN patients to determine whether the elevated levels of plasma miRNAs found in rats with CIN would also be detected in patients with CIN. We found that plasma levels of miR-30a, miR-30c, and miR-30e in CIN patients at 6 h after an interventional procedure were significantly higher when compared with those in non-CIN patients ( and ). Plasma miR-30a levels increased significantly at 3 h, and plasma miR-30c and miR-30e levels significantly increased at 6 h after a procedure. All miRNA levels in the CIN patients peaked at 12 h after a procedure, and the average fold-changes for miR-30a, miR-30c, and miR-30e were 7.8, 3.5, and 2.6, respectively, when compared to their levels in non-CIN patients. However, miR-320 levels in CIN patients did not significantly change, and remained similar to those in non-CIN patients (). Positive correlation was observed between miR-30a peak level and SCr peak level (Rho = 0.774, p < 0.001), between miR-30c peak level and SCr peak level (Rho = 0.702, p < 0.001) and between miR-30e peak level and SCr peak level (Rho = 0.673, p < 0.001). There were 39.1% patients without any biomarkers increase, 10.9% with only miRNA increase, 44.6% with both miRNA and SCr increase, and 5.4% with only SCr increase. The correlation between the miRNAs is shown in .
Figure 5. Validating the results of candidate miRNAs screened from the CIN rats in patients with and without CIN. (A) The levels of plasma miR-30a, miR-30c, miR-30e, and miR-320 in CIN patients relative to non-CIN patients assessed by RT-qPCR analyses. Plasma miR-30a, miR-30c, and miR-30e were significantly higher levels in CIN patients compared with non-CIN patients within 6 h after procedures. However, miR-320 was not significantly altered in the CIN patients compared to non-CIN patients. *p < 0.05; **p < 0.01, compared with non-CIN patients. (B–D) Peak concentration of the miR-30a (B), miR-30c (C), and miR-30e (D) in plasma of individual CIN patients compared with non-CIN patients.
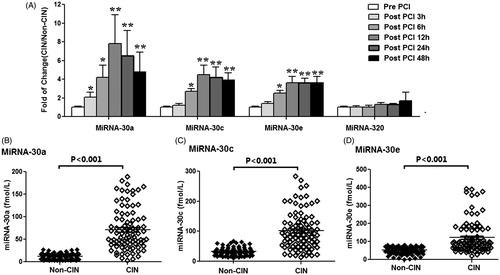
Figure 6. The correlation between the miR-30 family members (miR-30a, miR-30c, and miR-30e) in study patients. Positive correlation was observed between (A) miR-30a peak level and miR-30c peak level (Rho = 0.767, p < 0.001), (B) miR-30a peak level and miR-30e peak level (Rho = 0.681, p < 0.001), and (C) miR-30c peak level and miR-30e peak level (Rho = 0.715, p < 0.001).
ROC curve analyses of miR-30a, miR-30c, and miR-30e
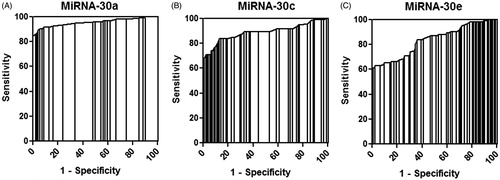
To further investigate the relationship between miRNAs and CIN, we performed ROC analyses to evaluate the ability of three miR-30 family members (miR-30a, miR-30c, and miR-30e) to discriminate CIN patients from non-CIN control subjects. The concentrations of these three miRNAs in human plasma samples were used to generate ROC curves for evaluating the capability of each miRNA to predict CIN. All three miRNAs peaked at 12 h in CIN patient plasma, and the ROC curves for miR-30a, miR-30c, and miR-30e showed strong separations between CIN and non CIN patients (), with AUC values of 0.954 (95% CI = 0.920–0.988, p < 0.001), 0.888 (95% CI = 0.836–0.940, p < 0.001), and 0.835 (95% CI = 0.776–0.893, p < 0.001), respectively. The specificities of miR-30a, miR-30c, and miR-30e were 97.8 (at 26.6 fmol/L), 98.9% (at 67.5 fmol/L) and 98.9% (at 80.3 fmol/L), respectively, and their sensitivities were 85.9%, 65.2%, and 60.9%, respectively. The positive predictive values of miR-30a, miR-30c, and miR-30e were 91.3%, 93.1% and 94.9%, respectively, and their negative predictive values were 78.2%, 67.6%, and 61.3%, respectively. These results indicated that miR-30a, miR-30c, and miR-30e could be used to discriminate CIN patients from non-CIN patients undergoing coronary interventional procedures.
Figure 7. ROC curve analysis of miR-30a, miR-30c, and miR-30e. ROC curve analysis for (A) miR-30a, (B) miR-30c, and (C) miR-30e indicated that these miRNAs could distinguish CIN patients from non-CIN patients with high sensitivity and specificity.
Discussion
To our knowledge, this is the first report identifying miRNAs as potential circulating diagnostic markers for CIN. Using the rat CIN model, we identified 17 miRNAs that were differentially expressed in the kidneys of CIN rats when compared with non-CIN control rats. Among these 17 aberrantly-expressed miRNAs, only six also showed significantly altered levels in the plasma of CIN rats, and four of those miRNAs showed significantly increased plasma levels in CIN rats. Studies were also conducted in human patients undergoing coronary interventions to validate the results found in rats. The results showed that plasma levels of three miR-30 family members (miR-30a, miR-30c, and miR-30e) were significantly higher in CIN patients when compared with those in non-CIN patients, and thus might serve as biomarkers for CIN.
miRNAs constitute a class of short endogenous RNA molecules that are important regulators of gene expression, and participate in almost every cellular process; therefore, their dysregulation is associated with a wide range of pathologies.Citation3,Citation4 Moreover, miRNAs show very specific patterns of expression in different tissues and cell types. Increasing evidence suggests that miRNAs are key regulators of normal kidney function and development. Studies using tissue profiling assays have demonstrated that the kidney and its constituent cells contain unique miRNAs, and particularly members of the miR-10 and miR-30 families and miR-192.Citation3,Citation4 Additionally, recent studies have revealed dysregulated miRNA expression in animal models and human tissue samples of kidney disease.Citation11–15 A consistent pattern of up-regulated and down-regulated miRNA expression has been described in response to acute and chronic kidney injuries. Studies using renal biopsies from diabetic patients have shown downregulation of miR-192 expression in diabetic kidney glomeruli,Citation11 while another study showed upregulation of miR-21 expression in kidneys in a mouse model of type 2 diabetes.Citation12 Godwin et al.Citation13 employed a mouse renal ischemia reperfusion injury model to identify a signature of nine miRNAs (miR-21, miR-20a, miR-146a, miR-199a-3p, miR-214, miR-192, miR-187, miR-805, and miR-194) that were differentially expressed in kidney tissue when compared to sham control tissue. In the present study, we assessed alterations in miRNA expression in the kidney tissues and plasma of rats used in a CIN model. Our results showed that six miRNAs were differentially expressed in both the kidney tissue and plasma of CIN rats when compared to their expressions in non-CIN control rats. Moreover, the levels of four miRNAs (miR-30a, miR-30c, miR-30e, and miR-320) were significantly increased in the plasma of rats with CIN. These dysregulated miRNAs could possibly serve as biomarkers for CIN or targets for intervention in CIN.
The early diagnosis of CIN is a key step in its successful treatment. Traditionally, CIN has been diagnosed by measuring increases in SCr – the end product of nitrogen metabolism.Citation1,Citation2 However, SCr levels were elevated at a relatively late stage of CIN, and have a low sensitivity for detecting CIN. Moreover, while several novel markers of CIN have been proposed and tested,Citation16,Citation17 their use in the clinic has remained cumbersome. Recent studies have demonstrated that miRNAs can be released into circulation by cells and tissues, and that these circulating miRNAs are stable and can serve as noninvasive biomarkers for various diseases, including kidney diseases.Citation3,Citation4 The use of miRNAs as biomarkers for kidney disease has been previously investigated in patients in Intensive Care Units, and as well as patients recovering from cardiac surgery and kidney transplantation.Citation4,Citation18 All of these studies reported that specific miRNA species were able to serve as early biomarkers for various kidney diseases. In the present study, we tested the hypothesis that circulating levels of miRNA might represent an early biomarker for contrast agent-induced kidney injury. Our results showed that three miR-30 family members (miR-30a, miR-30c, and miR-30e) could serve as improved early diagnostic markers for CIN. In our study with CIN patients, the SCr concentrations showed significant changes at 48 h after a coronary intervention, and eGFR values in CIN patients were significantly different at 24 h, when compared with eGFR values in non-CIN patients. However, all three miR-30 family members showed significantly elevated levels in the plasma of CIN patients within 6 h after a contrast agent-induced injury, and peaked at 12 h. Furthermore, the ROC analyses of these three miR-30 family members indicated that these miRNAs could be used to distinguish CIN patients from non-CIN patients with high degrees of specificity and sensitivity. These results suggest that plasma levels of miR-30a, miR-30c, and miR-30e can possibly serve as early biomarkers for CIN. This new generation of renal biomarkers could have a great impact on clinical practice, and significantly contribute to the improved management of CIN patients.
Study limitations
The present study has some limitations. First, although previous reports have identified dysregulated miRNA in urine samples of several kidney diseases, we did not find significant changes in miR-30a, miR-30c and miR-30e levels in urine samples in CIN rats up to 12 h after the contrast media injection. Thus, we did not assess the urine miRNAs as early biomarkers for CIN. Second, the recommended assessment of SCr at follow-up is 48–72 h for CIN. However, the present study only followed up 48 h post-PCI. Third, we excluded patients with severe renal dysfunction (i.e., eGFR <30 mL/min/1.73 m2). Further study need to perform to investigate the value of three miR-30 family members for monitoring the development of CIN in this subgroup.
Conclusions
In conclusion, the present study provides the first evidence that circulating miRNAs, and especially miR-30 family members (miR-30a, miR-30c, and miR-30e), might serve as novel noninvasive, early biomarkers for CIN. Further studies with larger sample sizes are required to validate our findings.
Declaration of interest
The authors report no conflicts of interest. The authors alone are responsible for the content and writing of the paper.
References
- Golshahi J, Nasri H, Gharipour M. Contrast-induced nephropathy: A literature review. J Nephropathol. 2014;3(2):51–56
- Mohammed NM, Mahfouz A, Achkar K, Rafie IM, Hajar R. Contrast-induced nephropathy. Heart Views. 2013;14(3):106–116
- Matsumoto S, Sakata Y, Nakatani D, et al. A subset of circulating microRNAs are predictive for cardiac death after discharge for acute myocardial infarction. Biochem Biophys Res Commun. 2012;427(2):280–284
- Aguado-Fraile E, Ramos E, Conde E, Rodríguez M, Liaño F, García-Bermejo ML, . MicroRNAs in the kidney: Novel biomarkers of acute kidney injury. Nefrologia. 2013;33(6):826–834
- Duffield JS, Grafals M, Portilla D. MicroRNAs are potential therapeutic targets in fibrosing kidney disease: Lessons from animal models. Drug Discov Today Dis Models. 2013;10(3):e127–e135
- Gazi S, Altun A, Erdogan O. Contrast-induced nephropathy: Preventive and protective effects of melatonin. J Pineal Res. 2006;41(1):53–57
- Gao X, Gulari E, Zhou X. In situ synthesis of oligonucleotide microarrays. Biopolymers. 2004;73(5):579–596
- Bolstad BM, Irizarry RA, Astrand M, et al. A comparison of normalization methods for high density oligonucleotide array data based on variance and bias. Bioinformatics. 2003;19(2):185–193
- Levey AS, Bosch JP, Lewis JB, Greene T, Rogers N, Roth D. A more accurate method to estimate glomerular filtration rate from serum creatinine: a new prediction equation. Modification of Diet in Renal Disease Study Group. Ann Intern Med. 1999;130(6):461–470
- D'Agostino RB Jr. Propensity score methods for bias reduction in the comparison of a treatment to a non-randomized control group. Stat Med. 1998;17(19):2265–2281
- Kato M, Zhang J, Wang M, et al. MicroRNA-192 in diabetic kidney glomeruli and its function in TGF-beta-induced collagen expression via inhibition of E-box repressors. Proc Natl Acad Sci USA. 2007;104(9):3432–3437
- Zhong X, Chung AC, Chen HY, et al. miR-21 is a key therapeutic target for renal injury in a mouse model of type 2 diabetes. Diabetologia. 2013;56(3):663–674
- Godwin JG, Ge X, Stephan K, Jurisch A, Tullius SG, Iacomini J. Identification of a microRNA signature of renal ischemia reperfusion injury. Proc Natl Acad Sci USA. 2010;107(32):14339–14344
- Wang JF, Zha YF, Li HW, et al. Screening plasma miRNAs as biomarkers for renal ischemia-reperfusion injury in rats. Med Sci Monit. 2014;20:283–289
- Kanki M, Moriguchi A, Sasaki D, et al. Identification of urinary miRNA biomarkers for detecting cisplatin-induced proximal tubular injury in rats. Toxicology. 2014;324:158–168
- He H, Li W, Qian W, et al. Urinary interleukin-18 as an early indicator to predict contrast-induced nephropathy in patients undergoing percutaneous coronary intervention. Exp Ther Med. 2014;8:1263–1266
- Hudzik B, Szkodzinski J, Danikiewicz A, et al. Serum interleukin-6 concentration predicts contrast-induced nephropathy in patients undergoing percutaneous coronary intervention. Eur Cytokine Netw. 2010;21(2):129–135
- Sui W, Yang M, Li F, et al. Serum microRNAs as new diagnostic biomarkers for pre- and post-kidney transplantation. Transplant Proc. 2014;46:3358–3362