
Abstract
Graves’ disease is an autoimmune hyperthyroidism caused by thyrotropin receptor antibodies (TRAbs). Because Epstein–Barr virus (EBV) persists in B cells and is occasionally reactivated, we hypothesized that EBV contributes to TRAbs production in Graves’ disease patients by stimulating the TRAbs-producing B cells. In order for EBV to stimulate antibody-producing cells, EBV must be present in those cells but that have not yet been observed. We examined whether EBV-infected (EBV(+)) B cells with TRAbs on their surface (TRAbs(+)) as membrane immunoglobulin were present in peripheral blood of Graves’ disease patients. We analyzed cultured or non-cultured peripheral blood mononuclear cells (PBMCs) from 13 patients and 11 healthy controls by flow-cytometry and confocal laser microscopy, and confirmed all cultured PBMCs from 8 patients really had TRAbs(+) EBV(+) double positive cells. We unexpectedly detected TRAbs(+) cells in all healthy controls, and TRAbs(+) EBV(+) double positive cells in all cultured PBMC from eight healthy controls. The frequency of TRAbs(+) cells in cultured PBMCs was significantly higher in patients than in controls (p = 0.021). In this study, we indicated the presence of EBV-infected B lymphocytes with TRAbs on their surface, a possible player of the production of excessive TRAbs, the causative autoantibody for Graves’ disease. This is a basic evidence for our hypothesis that EBV contributes to TRAbs production in Graves’ disease patients. Our results further suggest that healthy controls have the potential for TRAbs production. This gives us an important insight into the pathogenesis of Graves’ disease.
Introduction
Graves’ disease is an autoimmune hyperthyroidism. Graves’ disease patients produce thyrotropin receptor antibodies (TRAbs), which are autoantibodies against the thyroid-stimulating hormone (TSH: thyrotropin) receptor (TSHR). TRAbs are heterogeneous antibodies, but the majority of TRAbs measured in sera are stimulating type. TRAbs inhibit binding of TSH to the TSHR and stimulate thyroid follicular cells to produce excessive thyroid hormones, resulting in hyperthyroidism [Citation1,Citation2].
It has been suggested that Graves’ disease patients have genetic susceptibility, and many susceptibility genes including HLA and cytotoxic T lymphocyte-associated factor 4(CTLA-4) genes have been reported to contribute to the disease development [Citation1–5]. However, these genetic factors do not explain the entire etiology, and the environmental factors; stress, infection, iodine intake for instance, are thought to be associated as well. The most intriguing environmental factor is infection [Citation1–3].
Epstein–Barr virus (EBV; human herpesvirus 4) is ubiquitous, and almost all adults have anti-EBV antibodies in their serum. After primary infection, EBV latently persists mainly in B lymphocytes and occasionally reactivates. EBV has been suggested to be related to various autoimmune diseases [Citation6,Citation7], because the infectious mononucleosis (IM), the symptomatic primary infection, is sometimes accompanied with many autoantibodies in peripheral blood [Citation8] or followed by some autoimmune diseases [Citation9,Citation10].
We previously reported the influence of EBV reactivation on TRAbs production using correlations between serum TRAbs levels and EBV EA antibody levels in Graves’ disease patients [Citation11]. We considered that EBV infection could be a factor that modifies antibody production by B cells. Almost all humans experience primary EBV infection at an early stage of life, and EBV persists in their B cells. Several reports have suggested a relationship between plasma cell differentiation and EBV reactivation [Citation12,Citation13]. These reports support the possibility of antibody production modification by EBV in the host B cells.
We hypothesized that Graves’ disease patients have EBV-infected B cells that are predisposed to TRAbs production, and in these cells, EBV could modify TRAbs production and thereby have some effect on the development or exacerbation of Graves’ disease. In order for EBV to stimulate the antibody-producing cells, the virus must be present in those cells but that has not yet been observed.
In this study, we examined whether EBV-infected (EBV(+)) B cells with TRAbs on their surface (TRAbs(+)) as the membrane immunoglobulin were present in the peripheral blood of Graves’ disease patients.
We used the flow-cytometry (FCM) and confocal laser microscopy to detect EBV-encoded small RNA (EBER) 1 and surface TRAbs. EBER1 is a non-coding RNA that is considerably more prevalent than other EBV-related antigens, with a maximum of 107 copies/cell [Citation6]. A probe for EBER1 in situ hybridization was used for fluorescent labeling to detect EBV infected cells [Citation14]. Serum TRAbs titers are useful for diagnosis of Graves’ disease, and many excellent and widely used systems are available for measurement of serum TRAbs [Citation15–17]. We applied these methods to our fluorescent staining system for surface TRAbs on suspended cells.
Thus, we confirmed the existence of TRAbs(+) EBV(+) double-positive (DP) cells in the peripheral blood mononuclear cells (PBMCs) from Graves’ disease patients. Detection of these cells may prove that EBV has the potential to stimulate TRAbs production in those cells.
We unexpectedly observed TRAbs(+) EBV(+) DP cells in PBMCs from healthy controls as well as Graves’ disease patients.
Methods
Subjects
A total of 13 Graves’ disease patients and 11 healthy controls participated in the study (). All subjects provided informed written consent for participation in the study, and the study protocol was approved by the Medical Ethics Committee for Human Subject Research at the Faculty of Medicine, Tottori University, Yonago, Japan.
Table 1. Clinical data, EBV infection status and TRAbs(+) cells%.
The mean age (± SD) of Graves’ disease patients was 36.38 ± 8.67 years and of those who participated in the FCM analysis of TRAb(+) EBV(+) DP cells was 38.25 ± 8.48 years, while the mean age of the healthy controls were 45.91 ± 13.53 years and 45.88 ± 13.35 years, respectively.
At the time of diagnosis, the patients had symptoms and laboratory data that included at least one of the following: (1) signs of thyrotoxicosis such as tachycardia, weight loss, finger tremor, and sweating; (2) diffuse enlargement of the thyroid gland; (3) exophthalmos and/or specific ophthalmopathy. All of the patients also met the following criteria: (1) elevated serum levels of free T4 and/or free T3; (2) suppression of serum TSH (<0.1 μU/ml); (3) positive for TRAbs or thyroid-stimulating antibody. Nine of the 13 patients were undergoing treatment with antithyroid drugs (methimazole or propylthiouracil), two of the patients underwent thyroidectomy, and two of the patients were in remission.
Control subjects were selected from healthy laboratory staff. Their thyroid functions were normal, and they have no familial history of thyroidal disease. No subjects were considered to have an IM at the time of sampling, and we confirmed all of the subjects have persistent EBV infection by EBV Bam HIW region PCR.
Serum levels of anti-EBV-early antigen (EA) IgG, anti-EBV-encoded nuclear antigen (EBNA) 1 IgG, and TRAbs are shown in .
Preparation of PBMCs
Peripheral blood samples were obtained from patients and control subjects. PBMCs were separated from each blood sample by Ficoll–Conray density gradient and stored at −80 °C until they were used for FCM.
PBMCs used as FCM samples for EBER1 analysis were cultured for several days in RPMI1640 with 0.1 μg/ml cyclosporine A [Citation18,Citation19] before use.
EBER1 flowcytometric in situ hybridization for FCM
We utilized the probe for in situ hybridization of EBER1 to detect the EBV(+) cells according to the method of Kimura et al. [Citation14]. In brief, PBMCs were fixed with 1% (vol/vol) acetic acid in 4% paraformaldehyde/PBS for 40 min at 4 °C, and permeabilized in 50 μl of 0.5% Tween20/PBS at room temperature. The cells were resuspended in 45 μl of hybridization solution containing 12 nmol/l of the EBER1 peptide nucleic acid (PNA) probe (Dako, Glostrup, Denmark). The probe had been labeled with fluorescein isocyanate (FITC). Hybridization was performed for 1 h at 56 °C. The cells were then washed twice with 0.5% Tween20/PBS at 56 °C. The Alexa Fluor® 488 Signal Amplification Kit (Molecular Probes, Eugene, OR) was used to enhance fluorescence.
Alexa Fluor 488 fluorescence for EBER1 was detected as two peak signals (). We considered only the stronger peak as positive because of the possibility that cells in the weaker peak contained fluorescence from the PNA probe remaining in cells without hybridization. The two peak in derived from FITC that EBER1 probe originally conjugated.
Figure 1. FCM pattern of EBER1 and TRAbs in cultured PBMCs. We confirmed the background for each fluorescence by fluorescence minus one (FMO) control [Citation22,Citation23] as the negative controls using cultured PBMCs from a patient (A–D). There was no leaking of fluorescence but was weak non-specific fluorescence with the APC staining. We did not take the weak APC fluorescence as the positive results because these were difficult to distinguish from non-specific fluorescence. Right two panels are the representative data of healthy control (E), and patient (F). TRAbs(+) EBV(+) DP cells appeared in the right upper quadrant. (A) non-stain control. (B) background without APC. (C) background without Alexa Fluor 488. (D) full stain. (E) dot-plot of a healthy control. (F) dot-plot of a patient. Abbreviations: APC, allophycocyanin; DP, double-positive; EBER, EBV-encoded small RNA; EBV, Epstein–Barr virus, human herpesvirus 4; FCM, flow-cytometry; FMO, fluorescence minus one; TRAbs, thyrotropin receptor antibodies.
![Figure 1. FCM pattern of EBER1 and TRAbs in cultured PBMCs. We confirmed the background for each fluorescence by fluorescence minus one (FMO) control [Citation22,Citation23] as the negative controls using cultured PBMCs from a patient (A–D). There was no leaking of fluorescence but was weak non-specific fluorescence with the APC staining. We did not take the weak APC fluorescence as the positive results because these were difficult to distinguish from non-specific fluorescence. Right two panels are the representative data of healthy control (E), and patient (F). TRAbs(+) EBV(+) DP cells appeared in the right upper quadrant. (A) non-stain control. (B) background without APC. (C) background without Alexa Fluor 488. (D) full stain. (E) dot-plot of a healthy control. (F) dot-plot of a patient. Abbreviations: APC, allophycocyanin; DP, double-positive; EBER, EBV-encoded small RNA; EBV, Epstein–Barr virus, human herpesvirus 4; FCM, flow-cytometry; FMO, fluorescence minus one; TRAbs, thyrotropin receptor antibodies.](/cms/asset/2da377c8-5221-4add-925d-3564caf4fe45/iaut_a_879863_f0001_b.jpg)
Fluorescent staining for surface TRAbs
PBMCs were washed with 0.1% bovine serum albumin (BSA)/PBS and incubated with 0.1 μg/106 cells of full-length recombinant human TSHR (Abnova, Taipei, Taiwan) for 30 min at 4 °C. After incubation, the cells were washed and incubated with 1 μg/106 cells of biotinylated goat anti-TSHR IgG (Santa Cruz Biotechnology, Santa Cruz, CA) for 30 min at 4 °C. The cells were rewashed and incubated with 0.5 μg/106 cells of allophycocyanin (APC)–streptavidin (Beckman Coulter, Fullerton, CA) for 30 min at 4 °C.
Western blot analysis of anti-TSHR goat polyclonal IgG
Since anti-TSHR IgG was goat polyclonal antibody. We verified the specificity of this antibody by Western blotting.
The lysate of human thyroid gland and PBMC (control) were separated using sodium dodecyl sulfate-polyacrylamide gel electrophoresis (SDS-PAGE), and transferred onto polyvinylidene fluoride (PVDF) membrane. We confirmed that this antibody recognized the TSHR β-subunit (40–46 kDa) and intact TSHR (120 kDa) [Citation20,Citation21].by each single band (Supplementary Figure 1).
Primary antibodies used were: anti-TSHR goat polyclonal IgG (left), anti-β-actin rabbit IgG (middle: positive control), anti-rabbit IgG goat polyclonal IgG (right: negative control).
Verification of the TRAbs detection system
Besides the unstained control, three control-stained samples were compared with samples properly stained for surface TRAbs (Supplementary Figure 2). Control samples were prepared without TSHR, anti-TSHR IgG, or APC-Streptavidin to confirm that each process was necessary and to confirm the frequency of non-specific binding. PBMCs from nine patients and six controls were prepared for FCM as follows: TSHR(+), biotinylated anti-TSHR(+), APC–streptavidin(+) (fully stained); TSHR(+), biotinylated anti-TSHR(−), APC–streptavidin(+); TSHR(−), biotinylated anti-TSHR(+), APC–streptavidin(+); TSHR(+), biotinylated anti-TSHR(+), APC–streptavidin(−); TSHR(−), biotinylated anti-TSHR(−), APC–streptavidin(−) (unstained control).
FCM and cell sorting
PBMCs were stained using the flowcytometric EBER1 in situ hybridization method and our TRAbs labeling system. Cell samples were analyzed by Alexa Fluor 488 and APC fluorescence and sorted with a flow-cytometer (MoFlo XDP; Beckman Coulter, Fullerton, CA).
We confirmed the background of each fluorescence by fluorescence minus one (FMO) control as negative control () [Citation22,Citation23]. The FMO control analysis confirmed that there was no leaking of fluorescence but there was weak non-specific fluorescence with the APC staining. We did not take the weak APC fluorescences as the positive results because these were difficult to distinguish from non-specific fluorescence.
Confocal laser microscopy
All of the sorted cells were collected on silane-coated glass slides and examined by confocal laser microscopy (TCS SP-2; Leica, Wetzlar, Germany).
4′,6-diamidino-2-phenylindole (DAPI: Molecular Probes/Invitrogen, Eugene, OR) was used as the nuclei marker to exclude the cellular debris.
Statistical analysis
We used SPSS for Windows 15.0 J for statistical analyses (SPSS Inc., Chicago, IL).
Mann–Whitney’s U test was adopted for the comparison of cell frequencies in patients and controls.
Results
The patients and controls had lymphocytes with cell surface TRAbs stained as spots
We detected TRAbs(+) cells by FCM with non-specific binding of approximately 0.1% at each intermediate step (Supplementary Figure 2).
In confocal laser microscopy of TRAbs(+) cells, cell surface TRAbs were stained as single or several red spots of APC (Supplementary Figure 3A) and non-specifically bound cells were dimly stained (Supplementary Figure 3B).
The actual number of surface TRAbs must be more than several, but only a few spots were observed on one cell surface. We supposed that TRAbs are rarely expressed surface immunoglobulins or that TRAbs oligomerize during the antigen–antibody reaction. An alternative explanation may be that since we used no less than three molecules to detect TRAbs, some conjugation may be blocked mechanically or some may be broken by the washing and/or mixing procedures involved.
We observed the same red-spotted fluorescence in positive cells from both patients and controls.
These results suggest that both Graves’ disease patients and healthy controls have lymphocytes with surface TRAbs.
FCM and confocal laser microscopy detected EBV(+) TRAbs(+) DP cells
Since the frequency of EBV infected cells, reported to be one in 105–6 PBMCs from latently infected subject [Citation6,Citation7], was too low for effective analysis by FCM; thus, we cultured PBMCs to expand the EBV(+) cell population (). During culture, the population of EBV(−) lymphocytes decreased, and only EBV(+) B cells expanded with many cell clumps because EBV transforms its host cells [Citation6,Citation7,Citation18,Citation19]. In the cultured PBMCs, the TRAbs(+) EBV(+) DP cells were detected by FCM, and the sorted DP cells were identified by confocal laser microscopy.
and (F) shows representative FCM data and shows representative DP cells from a control (1E, 2A) and a patient (1F, 2B). The granular signals of Alexa Fluor 488 (EBER1) were observed in the nucleus, and red spots representative of APC (TRAbs) were detected on the cell surface. The Alexa Fluor 488 signal was also discerned in the cytoplasm, and blue DAPI signal represented the cell nucleus.
Figure 2. Images of TRAbs(+) EBV(+) double-positive cells from a healthy control (A) and a Graves’ disease patient (B). Cell surface TRAbs were stained as red spots of APC. The granular signals of Alexa Fluor 488 showed EBV encoded small RNA (EBER) 1 in the nuclear structures. The Alexa Fluor 488 signal was also observed in the cytoplasm, and a deep blue DAPI signal represented the cell nucleus. Abbreviations: APC, allophycocyanin; DAPI, 4′, 6-diamidino-2-phenylindole; EBER, EBV-encoded small RNA; EBV, Epstein–Barr virus, human herpesvirus 4; TRAbs, thyrotropin receptor antibodies.
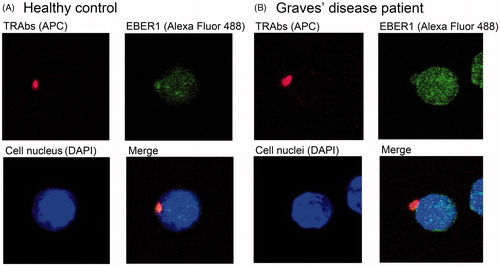
DP cells were observed in every patient and controls examined ().
These results suggest that TRAbs(+) EBV(+) DP cells really exist in the peripheral blood of both Graves’ disease patients and healthy controls.
The frequency of TRAbs(+) cells is higher in patients than in controls
The individual FCM data and the mean frequencies of TRAbs(+) cells are summarized in .
The mean frequency of TRAbs(+) cells in non-cultured PBMCs was 0.191% in the patients and 0.170% in the controls (; Supplementary Figure 2).
In detecting DP cells, we cultured PBMC samples. Though this culture was artificial condition, the frequency of TRAbs(+) cells in the cultured PBMCs was regarded as the same as that in the non-cultured PBMCs in both patients and healthy control ().
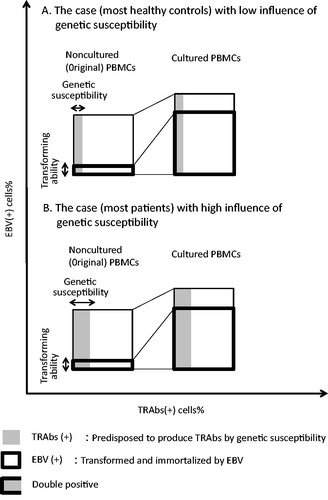
Figure 3. Effects of short-term culture of PBMCs (Figures do not represent the accurate cell frequency). After short-term culture, EBV(−) lymphocytes decreased and only EBV(+) cells increased, because EBV(+) cells were immortalized by persistent EBV. DP cells increased with the expansion of EBV(+) cells. However, the percentage of TRAbs(+) cells in the PBMCs was regarded as the same as that in the noncultured PBMCs. (A) The case (most healthy controls) with low influence of genetic susceptibility. In the case with low genetic influence, the frequencies of TRAbs(+) cells in original PBMCs and thus cultured PBMCs are low for the case to be healthy. (B) The case (most patients) with high influence of genetic susceptibility. Under the high influence of genetic susceptibility, the frequencies of TRAbs(+) cells both in original PBMCs and cultured PBMCs are high. Abbreviations: DP, double-positive; EBV, Epstein–Barr virus, human herpesvirus 4; PBMC, peripheral blood mononuclear cells; TRAbs, thyrotropin receptor antibodies.
Thus, we could estimate the frequencies of TRAbs(+) cells in original PBMCs by those in cultured PBMCs as well. This frequency of TRAbs(+) cells in cultured PBMCs was significantly higher in PBMCs in Graves’ disease patients than in healthy controls (p = 0.021; ).
The higher frequency of TRAbs(+) cells in both non-cultured and cultured PBMCs from patients suggests the influence of genetic susceptibility.
The frequency of TRAbs(+) cells was not parallel to the serum TRAbs level
We noticed that some healthy controls (control Nos. 5 and 11) had a high frequency of TRAbs(+) cells, which was equivalent to that in Graves’ disease patients, whereas one patient (patient No. 12) had few TRAbs(+) cells and high serum TRAbs levels ().
These cases suggest that the number of TRAbs(+) cells is not the only factor responsible for the serum TRAbs level.
Discussion
Our hypothesis was that Graves’ disease patients have EBV-infected B cells that are predisposed to TRAbs production, and in these cells, EBV could modify TRAbs production and have some effect on the development or exacerbation of Graves’ disease. The aim of this study was to determine whether Graves’ disease patients have EBV-infected B cells that have TRAbs as surface immunoglobulins. We also attempted to confirm differences between patients and controls by comparing their FCM results.
For the purpose of our research, we developed a labeling system for detecting cells with TRAbs on their surface by FCM. With this system, we could detect TRAbs(+) cells by APC staining with non-specific binding of approximately 0.1% at each intermediate step (Supplementary Figure 2). However, since the frequency of TRAbs(+) cells in PBMCs was not high, we were concerned that it would be difficult to identify TRAbs(+) cells in non-specific binding. Therefore, we examined the FCM-sorted positive cells by confocal laser microscopy, which revealed that the non-specifically bound cells were dimly stained, and the TRAbs on the cell surface appeared as red spots (Supplementary Figure 3). Thus, we could identify TRAbs(+) cells by combining FCM and confocal laser microscopy.
In this FCM system, the frequency of TRAbs(+) cells in non-cultured PBMCs was 0.191% in patients and 0.170% in controls (, Supplementary Figure 2).
It was unexpected that all of the healthy controls examined had TRAbs(+) cells, because in general, only Graves’ disease patients were believed to have TRAbs that stimulate thyroid follicular cells to produce excessive thyroid hormone [Citation1,Citation2].
In 1994, Fan et al. reported that they detected TRAbs in the supernatant of PBMCs transformed by exogenous EBV [Citation24]. The frequency of the TRAbs-positive culture plate wells was 27% for Graves’ disease patients and 3% for normal subjects. Therefore, we considered that healthy subjects also have several TRAbs-producing cells, and the difference between patients and healthy controls depends on the amount of TRAbs released by these cells.
In clinical routine laboratory tests, we sometimes observe low level of TRAbs in healthy individuals. We cut them off as negative, but these cases may indicate that normal individuals have TRAbs producing cells. All of the healthy controls in our study showed serum TRAbs levels below the clinical cut-off value (<1.0 IU/l; ); however, some of them (control Nos. 2, 3, 10, and 11) had low level of TRAbs ().
In addition to the labeling of TRAbs(+) cells, it was necessary to mark EBV infected cells to detect TRAbs(+) EBV(+) DP cells. TRAbs(+) cells in PBMCs were expected to be detected at a frequency of approximately 0.2% (, Supplementary Figure 2), but it was difficult to detect EBV (+) cells by FCM because their frequency is reported to be one in 105-6 PBMCs from individuals with latent EBV infection [Citation6,Citation7].
Therefore, we first cultured sample PBMCs and collected them after sufficient clumps of EBV-infected cells had formed. In infected cells, EBV transform and immortalize their hosts for their survival [Citation6,Citation7,Citation25,Citation26], therefore, the culture in vitro resulted in the expansion of the EBV infected cell population, enough for FCM analysis ().
Thus, we obtained methods for detecting TRAbs(+) EBV(+) DP cells by flowcytometric in situ hybridization with Alexa Fluor 488, together with labeling for TRAbs(+) cells by APC. On the FCM analysis, we confirmed the background for each fluorescence by FMO control as negative control ().
shows the TRAbs(+) EBV(+) DP cell of a patient observed by confocal laser microscopy. We confirmed TRAbs on the cell surface as the APC spot and EBER1 in the nuclear structure with Alexa Fluor 488, which indicated that among the TRAbs-producing B cells, there really are EBV-infected cell. We found the same DP cells in the PBMCs of the healthy controls as well ().
These results suggest that normal subjects as well as patients have TRAbs(+) EBV(+) DP cells, and together with previous reports [Citation11–13], they support that persisting EBVs can modify TRAbs production of the host cells.
Because culture is an artificial state, the frequency of DP cells in cultured PBMCs is different from that in non-cultured PBMCs, but the frequency of TRAbs(+) cells in cultured PBMCs was regarded as the same as that in non-cultured PBMCs ().
We compared the frequency of TRAbs(+) cells in cultured PBMCs of patients and controls according to FCM data (). In cultured PBMCs, the frequencies of TRAbs(+) cells of patients were significantly higher (p = 0.021) than those of controls. Also in noncultured PBMCs, the frequency of TRAbs(+) cells in patients was higher than that in controls, though it was not significant because the numbers of the cases were small (, Supplementary Figure 2).
The higher frequency of TRAbs(+) cells in patients suggests the influence of genetic susceptibility.
Upon individual analysis, we noticed that some control subjects (Nos. 5 and 11) had high frequency of TRAbs(+) cells equivalent to that of the patients, whereas one patient (No. 12) had few TRAbs(+) cells and an increased titer of TRAbs (2.69 IU/l).
Genetic susceptibility that may regulate the number of TRAbs(+) cells, is important for the etiology of Graves’ disease, but additional factors may be required to drive TRAbs-predisposed cells to TRAbs production.
TRAbs(+) cells must differentiate into plasma cells before producing TRAbs. According to previous reports, EBV reactivation is suggested to be associated with plasma cell differentiation [Citation11–13]. Therefore, the release of TRAbs from DP cells may depend on the extent of EBV reactivation. In another autoimmune disease, Sjögren's syndrome, EBV reactivation was observed in the inflammatory site [Citation27,Citation28].
Furthermore, we examined whether these DP cells actually release TRAbs when persistent EBV were reactivated. We cultured the DP cells contained EBV(+) cells in 33 °C, for 14 days for reactivation [Citation29,Citation30], and confirmed that the TRAbs concentration increased after the 33 °C stimulation in every culture fluid (preliminary data not shown). In the patients of autoimmune disease, EBV is reported to transform host B cells to release autoreactive IgM antibody more than other classed antibodies, but the autoreactive IgG antibody is more pathogenic than the IgM antibody [Citation31,Citation32]. We are planning to investigate these points in our next subjects.
In this study, we identified TRAbs(+) EBV(+) DP cells in the peripheral blood of both Graves’ disease patients and healthy controls by a combination of FCM and confocal laser microscopy. The presence of TRAbs(+) EBV(+) DP cells is the basic evidence for our hypothesis that persistent EBV may modify the TRAbs production and have some effect on the development or exacerbation of Graves’ disease (). Our results further suggest that healthy controls have the potential for TRAbs production, which had been believed to be specific to Graves’ disease patients. This gives us an important insight into the pathogenesis of Graves’ disease.
Figure 4. The hypothesis of EBV-related pathogenesis in Graves’ disease: EBV may have the potential to stimulate TRAbs production in host B cells. EBV-infected memory B cell with TRAbs on its surface could be terminally differentiated to plasma cell (possibly through EBV-reactivation) and produces excessive TRAbs that are the causative antibodies of Graves’ disease. Abbreviations: EBV, Epstein–Barr virus, human herpesvirus 4; TRAbs, thyrotropin receptor antibodies.
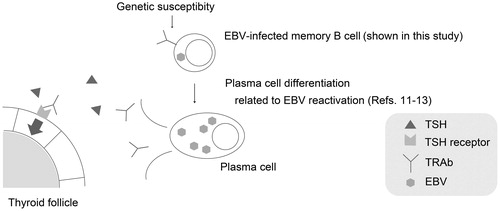
We propose that healthy controls as well as Graves’ disease patients possess genetic susceptibility to Graves’ disease, and persistent EBV may be one of important triggers in the production of TRAbs the causative autoantibody of Graves’ disease.
Declaration of interest
The authors report no conflict of interest. The authors alone are responsible for the content and writing of the article.
Supplementary material available online
Supplementary Figures 1–3
Supplementary Material
Download PDF (644.6 KB)Acknowledgements
The authors would like to thank Enago (www.enago.jp) for the English language review. The authors thank Dr. Shuji Fukata (Tajiri Clinic), Professor Shin-Ichi Hayashi (Tottori University), Professor Takeshi Sairenji (EM Research Organization), and Dr. Yoshiko Hoshikawa (Tottori University) for kind guidance and discussion. We also thank Dr. Kiyosuke Ishiguro (Tottori University) for providing suggestive samples. The authors thank Dr. Kaoru Kato (Tottori University), Dr. Hitoshi Sano (Tottori University), and Mr. Kiyoshige Yamamoto (Tottori University) for helpful assistance.
References
- Davies, P., and T. Larsen . 2007. Thyrotoxicosis. In Williams Textbook of Endocrinology , 11th ed. H. M. Kronenberg, S. Melmed, K. S. Polonsky, and P. R. Larsen , eds. Saunders, Philadelphia, PA. p. 333–376
- Weetman, A. P., and A. M. McGregor. 1994. Autoimmune thyroid disease: further developments in our understanding. Endocr. Rev. 15: 788–830
- Tomer, Y., and A. Huber . 2009. The etiology of autoimmune thyroid disease: a story of genes and environment. J. Autoimmun. 32: 231–239
- Tomer, Y., A. Greenberg, G. Barbesino, et al. 2001. CTLA-4 and not CD28 is a susceptibility gene for thyroid autoantibody production. JCEM. 86: 1687–1693
- Ueda, H., J. M. M. Howson, L. Esposito, et al. 2003. Association of the T-cell regulatory gene CTLA4 with susceptibility to autoimmune disease. Nature. 423: 506–511
- Kieff, E. D., and A. B. Rickinson . 2006. Epstein–Barr virus and its replication. In Fields Virology , 5th ed. D. M. Knipe and P. M. Howley , eds. Lippincott Williams & Wilkins, Philadelphia, PA. p. 2603–2654
- Rickinson, A. B., and E. Kieff . 2006. Epstein–Barr virus. In Fields Virology , 5th ed. D. M. Knipe and P. M. Howley , eds. Lippincott Williams & Wilkins, Philadelphia, PA. p. 2655–2700
- Sutton, R. N. P., R. T. D. Emond, D. B. Thomas, and D. Doniach . 1974. The occurrence of autoantibodies in infectious mononucleosis. Clin. Exp. Immunol. 17: 427–436
- Whittingham, S., J. McNeilage, and I. R. Mackay . 1985. Primary Sjögren's syndrome after infectious mononucleosis. Ann. Intern. Med. 102: 490–493
- James, J. A., K. M. Kaufman, A. D. Farris, et al. 1997. An increased prevalence of Epstein–Barr virus infection in young patients suggests a possible etiology for systemic lupus erythematosus. J. Clin. Invest. 100: 3019–3026
- Nagata, K., S. Fukata, K. Kanai, et al. 2011. The influence of Epstein–Barr virus reactivation in patients with Graves’ disease. Viral Immunol. 24: 143–149
- Crawford, D. H., and I. Ando . 1986. EB virus induction is associated with B-cell maturation. Immunology. 59: 405–409
- Laichalk, L. L., and D. A. Thorley-Lawson . 2005. Terminal differentiation into plasma cells initiates the replicative cycle of Epstein–Barr virus in vivo. J. Virol. 79: 1296–1307
- Kimura, H., K. Miyake, Y. Yamauchi, et al. 2009. Identification of Epstein–Barr virus (EBV)-infected lymphocyte subtypes by flow cytometric in situ hybridization in EBV-associated lymphoproliferative disease. J. Infect. Dis. 200: 1073–1087
- Rees Smith, B., and R. Hall . 1974. Thyroid-stimulating immunoglobulins in Graves’ disease. Lancet. 2: 427–431
- Michelangeli, V., C. Poon, J. Taft, et al. 1998. The prognostic value of thyrotropin receptor antibody measurement in early stages of treatment of Graves’ disease with antithyroid drugs. Thyroid. 8: 119–124
- Costagliola, S., N. G. Morgenthaler, R. Hoermann, et al. 1999. Second generation assay for thyrotropin receptor antibodies has superior diagnostic sensitivity for Graves’ disease. JCEM. 84: 90–97
- Frisan, T., V. Levitsky, and M. Masucci . 2001. Generation of lymphoblastoid cell lone (LCLs). In Epstein–Barr Virus Protocols (Method in Molecular Biology Vol. 174). J. Wilson and G. H. W. May , eds. Humana Press, Totowa. p. 125–127
- Nilsson, K. 1971. High-frequency establishment of human immunoglobulin-producing lymphoblastoid lines from normal and malignant lymphoid tissue and peripheral blood. Int. J. Cancer. 8: 432–442
- Tanaka, K., G. D. Chazenbalk, S. M. McLachlan, and B. Rapoport . 1999. Subunit structure of thyrotropin receptors expressed on the cell surface. J. Biol. Chem. 274: 33979–33984
- Oda, Y., J. Sauders, S. Roberts, et al. 1999. Analysis of carbohydrate residues on recombinant human thyrotropin receptor. JCEM. 84: 2119–2125
- Roederer, M. 2001. Spectral compensation for flow cytometry: visualization artifacts, limitations, and caveats. Cytometry 45: 194–205
- Perfetto, S. P., P. K. Chattopadhyay, and M. Roederer . 2004. Seventeen-color flow cytometry: unraveling the immune system. Nat. Rev. Immunol. 4: 648–655
- Fan, J. L., R. K. Desai, J. S. Dallas, et al. 1994. High frequency of B cells capable of producing anti-thyrotropin receptor antibodies in patients with Graves’ disease. Clin. Immunol. Immunopathol. 71: 69–74
- Henle, W., G. Kohn, H. zur Hauzen, and G. Henle . 1967. Herpes-type virus and chromosome marker in normal leukocytes after growth with irradiated Burkitt cells. Science. 157: 1064–1065
- Nilsson, K., G. Klein, W. Henle, and G. Henle . 1971. The establishment of lymphoblastoid lines from adult and fetal human lymphoid tissue and its dependence on EBV. Int. J. Cancer. 8: 443–450
- Fox, R. I., M. Luppi, H. I. Kang, and P. Pisa . 1991. Reactivation of Epstein–Barr virus in Sjögren's syndrome. Springer Semin. Immunopathol. 13: 217–231
- Nagata, Y., H. Inoue, K. Yamada, et al. 2004. Activation of Epstein–Barr virus by saliva from Sjögren's syndrome patients. Immunology 111: 223–229
- Nagoya, T., and Hinuma, Y. 1972. Production of infective Epstein–Barr virus in a Burkitt lymphoma cell line, P3HR-1. GANN. 63: 87–93
- Sairenji, T., G. Bertoni, M. M. Medveczky, et al. 1988. Inhibition of Epstein–Barr virus (EBV) release from P3HR-1 and B95-8 cell lines by monoclonal antibodies to EBV membrane antigen gp350/220. J. Virol. 62: 2614–2621
- Casali P., M. Nakamura, F. Ginsberg-Fellner, and A. L. Notkins . 1990. Frequency of B cells committed to the production of antibodies to insulin in newly diagnosed patients with insulin-dependent diabetes mellitus and generation of high affinity human monoclonal IgG to insulin. J. Immunol. 144: 3741–3747
- Nakamura M., S. E. Burastero, Y. Ueki, et al. 1988. Probing the normal and autoimmune B cell repertoire with Epstein–Barr virus. J. Immunol. 141: 4165–4172