Abstract
The pathological response and translocation of a commercial chrysotile product similar to that which was used through the mid-1970s in a joint compound intended for sealing the interface between adjacent wall boards was evaluated in comparison to amosite asbestos. This study was unique in that it presents a combined real-world exposure and was the first study to investigate whether there were differences between chrysotile and amosite asbestos fibers in time course, size distribution, and pathological response in the pleural cavity. Rats were exposed by inhalation 6 h/day for 5 days to either sanded joint compound consisting of both chrysotile fibers and sanded joint compound particles (CSP) or amosite asbestos. Subgroups were examined through 1-year postexposure. No pathological response was observed at any time point in the CSP-exposure group. The long chrysotile fibers (L > 20 µm) cleared rapidly (T1/2 of 4.5 days) and were not observed in the pleural cavity. In contrast, a rapid inflammatory response occurred in the lung following exposure to amosite resulting in Wagner grade 4 interstitial fibrosis within 28 days. Long amosite fibers had a T1/2 > 1000 days and were observed in the pleural cavity within 7 days postexposure. By 90 days the long amosite fibers were associated with a marked inflammatory response on the parietal pleural. This study provides support that CSP following inhalation would not initiate an inflammatory response in the lung, and that the chrysotile fibers present do not migrate to, or cause an inflammatory response in the pleural cavity, the site of mesothelioma formation.
Introduction
The purpose of the present study was to evaluate the pathological response and translocation of a commercial chrysotile product similar to what was used through the mid-1970s in a joint compound intended for sealing the interface between adjacent wall boards and to determine how this response compares to that produced by amosite asbestos. While previous studies have characterized the pathological response and translocation of chrysotile and amphibole asbestos fibers in the lung and have demonstrated a large difference in response in the lung between these two fiber types (Bernstein & Hoskins, Citation2006), they have not evaluated a combined real-world product exposure and have not examined the translocation to the pleural cavity, the site of mesothelioma formation.
Fibers have been evaluated for biopersistence and pathological response using a variety of protocols and methods ranging from short-term to chronic exposure and with intratracheal and inhalation exposure in rodents. Exposure method, duration, and fiber dimension (length and diameter) can influence the measure of biopersistence; consequently, it was essential in comparing results to use studies having similar routes of exposure, duration, fiber dimensions, and dose. The exposure design of this study was based upon one such protocol frequently used for the evaluation of fiber biopersistence (EUR 18748 EN, 1999; ILSI, Citation2005).
In this study, the joint compound was applied and then sanded to simulate the exposure in the use of the product. Sanding of the joint compound resulted in concomitant exposure to both chrysotile fibers and joint compound particles (CSP; inherent within the joint compound). However, sanding resulted in a paucity of fibers greater than 20 um. Consequently, in order to fulfill requirements in the protocol mentioned above (> 100 f/cc longer than 20 um; this length category being related to pathogenesis) the resulting test material included chrysotile fibers added to the sanded joint compound (CSP). This article presents lung results through 90 days and the initial pleural results through 181 days after cessation of exposure. Due to the large volume of data the remaining results will be presented in a subsequent paper.
The protocol used in the study involved the exposure of rats 6 h a day for five days to a well-defined aerosol. Subgroups of animals were examined starting immediately after the 5-day exposure and at time points through 1 year postexposure. The protocol was specifically designed to examine the pathological response in both the lung and pleura.
An important part of this study was to design procedures for evaluation of the pleural space while limiting procedural artifacts. This was especially important because the rat visceral pleural space is a cavity bounded on one side by visceral pleura, a very thin membrane covering the lung, and on the other side, parietal pleura intimately associated with the chestwall and diaphragm. The procedures and initial results presented herein provide two independent methods for examining the translocation of fibers to the pleural cavity and any associated inflammatory response following exposure to either CSP or to amosite asbestos. These methods included examination of the diaphragm as a parietal pleural tissue and the in situ examination of the lungs and pleural space obtained from freeze-substituted tissue in deep frozen rats.
The diaphragm was chosen as a representative parietal pleural tissue because at necropsy it could be removed within minutes of sacrifice with minimal alteration of the visceral lung surface. The area of the diaphragm chosen for examination included an important lymphatic drainage site (stomata) on the diaphragmatic surface. The use of both confocal microscopy and scanning electron microscopy (SEM) enables the identification of fibers as well as examination for possible inflammatory response. The examination of the pleural space in situ including the lung, visceral pleura, and parietal pleura in rats deep frozen immediately after termination, provided a noninvasive method for determining fiber location and inflammatory response.
CSP sample characteristics
The original formulations for the Ready-mix used to produce the sanded material specified grade 7RF9 chrysotile, which was obtained historically primarily from the Philip Carey mine in Canada. Because this mine was no longer in operation, an alternative source of chrysotile which has similar characteristics was used in the reformulation (Brorby et al., Citation2008). The ingredients of this recreated material are shown in . Extensive characterization including comparison of the bivariate size distribution was performed to confirm that the chrysotile used in the recreated formulation in this study (JM 7RF3) closely matched that from a historical sample of the joint compound (Brorby et al., Citation2008). No historical Ready-mix formulations specified use of amphibole asbestos at any time.
Table 1. Ready-mix ingredients [reproduced with permission from Brorby et al. (Citation2008)].
To simulate typical usage of the joint compound, the re-created material was applied to pieces of drywall the ends of which were sealed with tape according to the instructions for the original material. The material was allowed to dry for at least 48 h and then sanded. Individual boards were sanded for 20–30 min. Four different boards were used to obtain a sufficient mass of material for the studies. The sanded material was collected in a large Ziploc bag and the bag was sent to the Research and Consulting Company Ltd. [RCC (Currently known as Harlan Laboratories Ltd.)], Füllinsdorf, Switzerland, where the inhalation exposures were performed.
Materials and methods
All studies performed were conducted by RCC Ltd. (Basel, Switzerland) according to the Swiss Ordinance relating to Good Laboratory Practice adopted May 18, 2005 (RS 813.112.1). This ordinance is based on the Organisation for Economic Co-operation and Development (OECD) Principles of Good Laboratory Practice, as revised in 1997 and adopted November 26, 1997 by decision of the OECD Council [C (97)186/Final].
A pilot-study using both chrysotile alone and a CSP &chrysotile mixture was performed to assess the feasibility of a mixed exposure study. A few animals were exposed to each test material for 5 days and then examined for up to 3 days postexposure. The results, reported by Bernstein et al. (Citation2008), confirmed the feasibility of performing this mixed exposure study. This publication provides a detailed description of the fiber exposure methods.
The methodology used in the fiber exposure and the in-life phases of the study conforms to the guideline issued by the European Commission (EC; EUR 18748 EN, 1999) with the following enhancements:
The fiber evaluation was performed using an Analytical Scanning Transmission Electron Microscope with Energy Dispersive x-ray analysis (ASTEM-EDS) using an accelerating voltage of 80 kV and a magnification of at least 10,000×.
The analytical part of the ISO 13794 method for the determination of asbestos in ambient air by the indirect-transfer transmission electron microscopy (TEM) procedure was used.
The stopping rules for fiber counting included specific rules for the four length categories as follows: 100 fibers with a length < 5 μm, 200 fibers with a length between 5 and 20 μm, 100 fibers with a length > 20 μm, and 100 particles.
Sample preparation
The JM 7RF3 grade 7 chrysotile sample was received by RCC Ltd. from Exponent, Inc. The fiber as received contained fiber bundles which were too thick to be rat-respirable. To separate the fiber bundles, the fiber was processed using a small scale, table-top, Cyclotec 1093 Sample Mill (FOSS Tecator, Sweden). This is a low volume device which opens the fiber bundles while minimizing thermal degradation or contamination. Samples of a few milligrams of chrysotile were placed into the Cyclotec for a period of 1 min. This procedure was repeated three times for each sample to effectively open the bundles. No further processing was performed on the chrysotile. The length distribution of the aerosol was consistent with that of the pre-Cyclotec processed chrysotile sample.
Amosite used in this study was from the same batch as used in previous studies (Hesterberg et al., Citation1997, Citation1999a, Citationb; McConnell et al., Citation1999; Rogers et al., Citation1999).
Animal exposure
Acclimation: all animals were acclimatized to the restraint tubes and the inhalation exposure conditions by sham dosing over a period of 4 days of approximately 1, 2, 4, and 6 h on each successive day, respectively.
Three groups of rats were exposed for 6 h per day for 5 days to:
Group 1: filtered air alone (negative control group).
Group 2: a fixed exposure level of well-characterized CSP.
Group 3: a fixed exposure level of well-characterized amosite asbestos fibers.
Groups of 93 weanling (8–10 week old) male rats were exposed by inhalation in a flow-past nose-only exposure system for 6 h/day for a period of five consecutive days to either CSP (group 2) or to amosite asbestos (group 3). This system is derived from Cannon et al. (Citation1983) and is different from conventional nose-only exposure systems in that fresh fiber aerosol is supplied to each animal individually and exhaled air is immediately exhausted. In the negative control group (group 1), 56 rats were exposed in a similar fashion to filtered air passed through an un-loaded aerosol generator. In group 2, additional commercial grade 7RF3 chrysotile was added to the sanded powder containing short fiber chrysotile to assure compliance with the fiber exposure specifications of the EC protocol (EUR 18748 EN, 1999). In groups 2 and 3, a fiber concentration higher than that required by the EC Protocol of 100 fibers with length L > 20 μm/cm3 was used in order to assure there was sufficient long fiber exposure.
For group 2 (CSP), two aerosols were generated using individual rotating brush aerosol generators. A fiber aerosol was generated from chrysotile fiber 7RF3 and a separate dust/fiber aerosol was generated from sanded material. The chrysotile fiber aerosol was passed through a 500-ml Pyrex glass cyclone to assist in the elimination of fiber bundles. The sanded powder aerosol was passed though a micronizing jet mill to reduce the particle size to be rat-respirable. In-line 63Ni charge neutralizers were used to reduce the electrostatic charge to Boltzmann equilibrium. Following the charge neutralizers, the fiber and powder aerosols were mixed through a stainless steel Y-piece connection and then delivered directly into the nose-only flow-past exposure chamber.
For group 3, amosite fiber, the aerosol was generated using a rotating brush aerosol generator followed by a 63Ni charge neutralizer to reduce electrostatic charge on fibers to Boltzmann equilibrium. The aerosol was then delivered directly into the nose-only flow-past exposure chamber.
Control animals were treated with filtered air passed through a separate brush-feed generator.
The aerosol mass was sampled for approximately 5 h during each exposure. Aerosol samples were collected on the appropriate filters in the vicinity of the animal’s snout. Likewise, the temperature, relative humidity, and oxygen concentration were measured on atmosphere/aerosol samples collected directly from the delivery tube in the breathing zone of the animals. Also, in order to monitor and control the gravimetric concentration of the sanded powder aerosol alone, filter samples were also taken from a sampling outlet following the micronizing jet mill.
Gravimetric determination of aerosol concentrations
Gravimetric determinations of aerosol concentration were performed at least once daily for each group using a Millipore Durapore filter (type HVLP, polyvinylidene difluoride membrane, pore size 0.45 μm), loaded in a 47-mm in-line stainless steel filter sampling device. For groups 2 and 3, gravimetric samples were taken at different levels of the exposure system to ensure that uniformity was within ± 15% of the average value.
Sampling of fiber number and size distribution of aerosol concentrations
For bivariate length and diameter analysis of fiber size distribution and counting, aerosol samples were collected in the vicinity of the animal’s snout onto Nucleopore filters (PC membrane, diameter 47 mm, pore size 0.2 μm; SN 111.106, Nucleopore Ltd.). On each occasion, two samples (one main sample and one reserve) were taken for approximately 5 h during each exposure period in parallel with the sampling scheduled for gravimetric determination of aerosol concentrations. The bivariate analysis of fiber size distribution and counting (expressed in fiber number per cubic centimeter of aerosol) was performed by Gesellschaft für Schadstoffanalytik mbH (GSA; Germany), using ASTEM-EDS.
Particle size of dust aerosol
Particle size distribution of the exposure aerosol generated from sanded powder of group 2 was measured gravimetrically during the aerosol generation setup prior to the 5-day treatment period using a seven-stage cascade Mercer impactor (model 02-130, In-Tox Products, Inc., Albuquerque, NM). Mass median aerodynamic diameter (MMAD) and geometric standard deviations were calculated on the basis of the results from the Mercer impactor, using Microsoft Excel software. The target was to produce a rat-respirable aerosol in the range of 1–4 µm MMAD.
Counting rules for the evaluation of aerosol and lung burden samples by TEM
All fibers visible at a magnification of 10,000× were considered. The size and number of all objects seen at this magnification were determined with no lower or upper limit imposed on either length or diameter. The bivariate length and diameter was recorded individually for each object (particle/fiber) measured. Fibers were defined as any object that had an aspect ratio of at least 3:1. The diameter was determined at the greatest width of the object. All other objects were considered as nonfibrous particles.
Fibers were divided into three length categories for analysis purposes:
Fibers with a length < 5 μm.
Fibers with a length between 5 and 20 μm.
Fibers with a length > 20 μm.
Fields-of-view were examined for each length category until the defined minimum number of fibers for each length category were recorded or, where a maximum of 1 mm2 of the filter surface was examined. The stopping rules for counting each sample were adopted from the recommendations presented in the EC protocol (EUR 18748 EN, 1999), and were based on the number of fibers per sample necessary in order to have statistical reproducibility of the means.
The minimum number of fibers/particles examined in each length category:
Fibrous particles:
For fibers with a length < 5 μm, 100 fibers (200 fiber ends)
For fibers with a length between 5 and 20 μm, 200 fibers (400 fiber ends)
For fibers with a length > 20 μm, 100 fibers (200 fiber ends)
Nonfibrous Particles:
Fields-of-view were examined until the aforementioned stopping criteria for fibers were reached or a total of 100 particles were recorded.
An area of 0.5 mm2 of the filter was evaluated for control group samples.
Clinical examination and body weights
Clinical signs were recorded on the first day of the acclimatization period, twice daily during the treatment period (once pre-exposure and once postexposure outside the restraint tubes), once weekly during the first month of the postexposure observation period, and every second week thereafter.
Observations were detailed and recorded using explicitly defined scales. Observations included, but were not be limited to, changes in behavior, somatomotor activity, and body position, respiratory, and circulatory effects, autonomic effects such as salivation, central nervous system effects, e.g. tremors or convulsions, reactivity to handling or sensory stimuli, altered strength, and alteration of the skin, fur, nose, eyes, and mucous membranes. During exposure, the animals were in restraint tubes, so only grossly abnormal signs were visible.
Each animal was weighed on day 1 of the acclimatization period, on days 1, 3, and 5 of the treatment period once weekly during the first month postexposure and every second week thereafter.
Methods for determination of postexposure endpoints
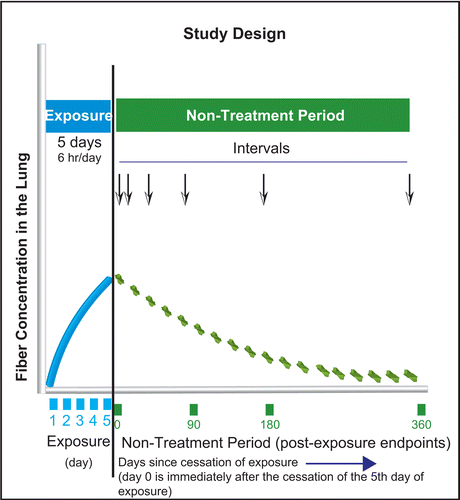
The time course of the study design is shown in . Following the 5 days of exposure, the time point for postexposure analysis was immediately following the end of the 5th day of exposure. This was termed day 0 of the nontreatment postexposure period. As described below, this was the first time point at which fiber lung burden and histopathology was analyzed.
Figure 1. Time course of the study design. Following the 5 days of exposure, the first time point for postexposure analysis was immediately following the end of the 5th day of exposure. This was termed day 0 of the nontreatment post-exposure period. As described below, this is the first time point at which fiber lung burden and histopathology was analyzed.
Postexposure endpoints were developed in order to best answer the questions posed by this study. In the lung, these included:
determination of the size and number of fibers of fibers in the lung in order to determine the biopersistence of the fibers,
pathological response to the presence of fibers using histological examination, and
confocal microscopic examination in order to determine in which lung compartments the fibers were located and to visualize the juxtaposition of the fibers within the lung and any associated cellular response.
In the pleura, endpoints included:
determination of the size and number of fibers on the diaphragm as a representative parietal pleural tissue, and any associated pathological response as a function of time postexposure, and
examination of the lung pleural interface using frozen chest sections in order to examine non-invasively the translocation of fibers to the pleura cavity and any pathological response.
summarizes the end points analyzed in subgroups of rats at each of the postexposure time points shown. The details of the methods are provided following.
Table 2. Postexposure end points analyzed in subgroups of rats at each time points shown.
Lung digestion for fiber/particle analysis
Lungs from subgroups of animals were weighed and then digested by low temperature plasma ashing and subsequently analyzed by TEM for total fiber number and size (bivariate diameter and length) distribution in the lungs. Mediastinal lymph nodes were resected and preserved.
The respiratory tract was dissected under a dissecting microscope. All procedures were designed so as to avoid contamination of the dissected organs by fibers from the fur or fibers that might be deposited on dissecting instruments.
The lung lobes were weighed together and inserted into an appropriately labeled plastic bag and deep frozen without fixation. They were subsequently transferred from dry ice to a refrigerator at −20 ± 5°C until digested. The frozen lung lobes were dried in an Edwards EF4 Modulyo freeze dryer. The dry tissue from all lungs was plasma ashed for at least 16 h in a Plasma Systems 200 multiple-chamber unit from Technics Plasma GmbH.
Upon removal from the ashing unit, the ash from each lung was weighed and suspended in 10 ml methanol using a low-intensity ultrasonic bath. The suspension was then transferred into a glass bottle with the combustion boat rinse and the volume made up to 20 ml. These vials were then sealed and express mailed under ambient conditions to GSA for bivariate analysis of fiber size distribution and counting using ASTEM-EDS.
The analytical procedures used for fiber recovery (lung digestion and TEM) have been validated using an independent comparative analysis with confocal microscopy, which was noninvasive [a cube of the lung was analyzed in three dimensions (3D)], and have been shown not to bias the size distribution or number of the measured fibers.
Lung: histopathology and confocal microscopy
The lungs from the subset of animals assigned to lung histopathology and confocal microscopy were divided in two for processing and examination as follows:
Left lung: histopathological examination
Right lung: confocal microscopy
Histopathology
For groups 2 and 3, separate subgroups of animals (three animals per group) were taken for histopathological examination of the respiratory tract at 0, 7, 14, 30, and 90 days after the last exposure. Following resection, the left lung, and mediastinal lymph nodes were processed, embedded in paraffin, cut at a nominal thickness of 2–4 μm, and stained with hematoxylin and eosin for histopathological examination. Similarly prepared sections were stained with Masson’s trichrome stain which was used for identification of collagen in the lungs. For the filtered air control group, histopathology was examined using the same procedures at 0, 14, 30, and 90 days after the last exposure.
Confocal microscopy
Confocal microscopy was performed on the right lung using Sarastro 2000 or 2010 (Molecular Dynamics, Inc.) laser scanning microscopes fitted with 25 mW argon-ion lasers and an upright Zeiss Axiophot or inverted Nikon Diaphot 2 microscopes, both modified for reflected light imaging. These confocal microscopes were used to record image data in dual channel reflected and fluorescent imaging mode. The optical bench settings were: excitation—488 nm (Lucifer yellow), emission > 510 long pass filter, laser power 12–15 mW, 30% transmission, photomultiplier voltage set between 500 and 800 volts. Fluorescently labeled cellular constituents and reflective/refractive fibers (and particles) were imaged simultaneously with this arrangement. Each ‘exposure’ produced two digital images in perfect register with one another.
Images were recorded through 40 or 60× objectives. The dimensions of voxels in the recorded volume were (x, y, and z dimensions respectively) 0.13, or 0.17 μm, 0.13 or 0.17 μm, and 0.3 or 0.39 µm. Image analysis procedures in some cases include: median filtering, selected pixel thresholding with reset to zero to remove background, and lookup table adjustment of slope, X-intercept and γ adjustment was performed to reduce background noise and highlight features of interest using ImageSpace software. 3D Projections, oriented in 3D space to show fiber profiles (when present) were rendered using VoxelView software (Rogers et al, Citation1999).
Searches
All fiber number, length, diameter, and location data were recorded following random data collection procedures. All images recorded during the random collection phase of this study were not intended to be ‘picture perfect’ in every aspect; rather, these images depict the actual association of the test article within specific regions of lung over time and reflect the true nature of the image data collected. On occasion, ‘purposeful searches’ were undertaken in which specific features of interest were imaged for use in 3D reconstruction projections.
The purposeful searches were performed on prepared sections containing chestwall and lung which were placed in the microscope with the depth of the embedded tissue being examined brought into focus. Image data was recorded through the volume of embedded lung tissue up to 200 µm below the surface. Since the pleural space presents as a linear element in profile, purposeful searches of the lung were made until the pleural surface was encountered, then a field-of-view containing visceral, parietal surfaces and pleural space was recorded. Profiles of the pleural space were recorded from alternating fields-of-view.
Morphometric methods
In the case of 3D microscopic methods, strategies for specimen examination and image sampling depend on the questions to be addressed. Although questions regarding the size distribution of fibers retained within the entire lung would be more efficiently answered by the conventional ashing/electron microscopic technique, questions about the numbers (and sizes) of fibers within various anatomical compartments would be answered most effectively by confocal microscopy employing serial optical section techniques. In many instances, the true length of individual fibers was captured within the volume recorded in serial section stacks. This occurs if the fiber profile was oriented such that two free ends were present.
We report all fiber profiles in length classes beginning with 3 microns or longer. Foreign body profiles when observed on-end deviate in 3D space and were identified as fibers in this condition. Particulate material remains as a single spot or profile and does not deviate along X or Y axis when serial section data were scrolled up and down along the z-axis.
The following sampling strategies were designed in order to determine the number of fibers retained within the parenchyma, and the conducting airways.
Sampling strategy for parenchyma
As parenchyma comprises about 90% of the lung’s volume and varies little, if at all, from one region of the lung to another, it was possible to acquire random fields-of-view of parenchyma from which quantitative data may be obtained. Our procedure was to place the microscope objective at random over the lung specimen exposed at the surface of the epoxy embedment, collect a depth series of images, return to the initial starting depth, move two field widths in the positive x-direction, and repeat the process. Twenty-five depth series per piece of lung (for a total of 100 fields-of-view per animal) were obtained in this way. (If the perimeter of the lung section was encountered, the objective was moved two field widths in the positive y-direction, and the stepping was continued in the negative x-direction.) At each location, if the profile of a conducting airway was in the volume to be recorded by the depth series, the field-of-view was skipped, and another step was made, until a volume was found which did not contain an airway. Each volume was recorded by obtaining 25 optical sections separated by 0.3 μm along the z-axis. The real-world dimensions of a volume, therefore, were 61.6 μm × 61.6 μm × 7.5 μm in x, y, and z, respectively. Well over 45,000 micrographs were recorded to obtain the necessary quantitative information from this compartment.
The number of fibers in each volume was counted by a human operator who was able to scan up and down through the depth series of images while looking for the characteristic bright points or lines indicative of a reflective or refractile particle or fiber. The person counting fibers did not know which experimental group the images were drawn from, that is, the counting was done under ‘single blind’ conditions. These counts provided data with units of (number of fibers/volume of parenchyma in cubic micrometers). Knowing the volume represented by each depth series and the volume of parenchyma (including airspaces) in the animal’s entire lungs, the fiber load in the lung’s parenchyma could be calculated.
Whenever a fiber was detected, the anatomic compartment in which it occurred was also noted. In instances where free ends of the fiber was observed, fiber length was recorded using 3D measurement technique. For example, while observing the middle section of a stack of 25 serial optical sections, a fiber profile was encountered, the sections would be scrolled upward, toward section pair #1 to identify the endpoint of the fiber. A x,y coordinate point would be recorded in a results table along with the section number. Then the section stack would be scrolled downward noting the x,y position of the fiber as the sequential sections were examined until the fiber no longer appeared in the serial section stack. The distance in microns traversed in the x and y coordinates relative to the first point until the final x,y coordinate was recorded gave an accurate length measurement in 3D space since the step interval and optical section thickness was known (Bernstein et al., 2005, Citation2006).
Fibers in parenchyma were classified as occurring:
in alveoli, alveolar ducts, or respiratory bronchioles, in contact with the surface of tissue,
in ducts or alveoli, but not in contact with tissue in the recorded volume,
wholly or partly inside alveolar macrophages,
partly or fully embedded into the interstitial space (fibers in this compartment often had one end in the interstitium and the other end in the airspace engulfed by macrophages).
These counts made it possible to estimate, e.g. the fraction of parenchymal fiber present inside macrophages.
Sampling strategy for airways
As the bronchial airways occupy only 10% of total inflated lung volume and exist as a tree-like structure, a field-of-view positioned at random on a lung sample has a rather low probability of containing any airways. As a result, a different sampling strategy was used where examination proceeded along a randomly positioned line on the lung sample’s surface and fibers recorded whenever an airway was approximately parallel to this line.
Ten depth series (dimensions identical to parenchymal depth series) were recorded from each of four samples per animal, and these stacks held, on average, 75 μm of airway wall each. Well over 36,000 micrographs were recorded for this phase of the study.
Fibers in airways were classified as occurring:
On surface of or intercalated within ciliated epithelium of conducting airway
Within airway macrophage
In airway lumen; portion of fiber visualized not touching tissue
Penetrating the airway wall or located completely underneath the airway wall.
Inflammatory cells
Inflammatory cells were identified morphologically in serial section image data. Mononuclear cells, such as alveolar macrophages, were easily distinguished from neutrophils, which exhibit polymorphonuclear profiles.
Pleural analyses
We used two methods to evaluate the translocation of fibers from the lung to the pleural cavity and any associated pathological response without the introduction of possible artifacts due to tissue manipulation or contamination.
Pleural method 1—diaphragm
This procedure was designed to estimate the fiber load and pathological response associated with parietal pleural surfaces of the diaphragm following the inhalation exposure. The sampling approach surveyed a circular area 78.5 µm2 of parietal pleura removed from the same location on each diaphragm. By design, the same piece of tissue was used to investigate the subsurface fiber distribution by confocal microscopy, followed by surface analysis using SEM. For each animal, random fields-of-view were recorded without bias to estimate the number of fibers associated with parietal pleural tissue.
Tissue collection
Parietal pleural tissue (diaphragm) was obtained from animals (n = 5) in each of the exposure groups at 0 days, after 7 days, after 14 days, after 30 days, and after 90 days postexposure. At the time of death, the chest was opened, lungs removed intact, and the diaphragm carefully excised from the chest wall. The diaphragm with parietal surface facing up, was pinned flat against filter paper placed on a wax base. The parietal tissue was immediately fixed by immersion in Karnofsky fixative.
Preparation procedure
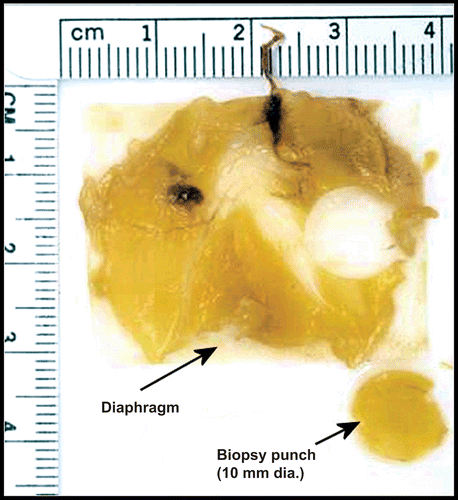
The diaphragm and the sampling region for image analysis is shown in . A consistent sampling location was selected to limit inter animal variability. Sampling from the same region of diaphragm was considered to limit systematic bias between animals and groups. A biopsy punch (10 mm diameter) was used to collect standardized areas of parietal pleural tissue for microscopic analysis. Within this standardized area, random searches were performed. Secondary tick marks were applied to the edge of each tissue disk by a razor blade to retain parietal surface orientation. We found that a biopsy punch minimized tissue handling and allowed for the selection of the same region of the diaphragm from all animals. Upon removal from the diaphragm, parietal pleural pieces were dehydrated in graded ethanol to absolute, stained with Lucifer Yellow-CH, and rendered optically clear in a 1:1 mixture of benzol alcohol and benzoyl benzoate (BABB). Specimens were then examined by confocal microscopy. Following confocal microscopic imaging, the BABB was removed by immersion in absolute ethanol and tissue discs were then transitioned by immersion in an organic solvent hexamethyldisilazane (HMDS). HMDS exhibits very low surface tension properties and was used as a transition fluid during the drying procedure. Tissue discs were then mounted on 12 mm diameter SEM stubs using carbon tape and sputter coated with gold in preparation for SEM. Approximately 1/10th the area of the diaphragm was sampled. Typically the diaphragm was approximately 780 mm2, with a circular area of 78 mm2 sampled.
Parietal pleural confocal image collection and analysis
Parietal pleural pieces were placed in a silicone rubber imaging chamber filled with BABB and sealed under a cover slip. Fields-of-view were randomly selected and stacks of 25 serial sections each were recorded. Five fields-of-view were recorded from each parietal pleural tissue specimen. Stacks of image data were analyzed for the number of subsurface fibers and fiber 3D length.
Searches
All reported fiber number, length, diameter, and location data were recorded following the random data collection procedures. All images recorded during the random collection phase of this study were not intended to be ‘picture perfect’ in every aspect; rather these images depict the actual association of the test article within specific regions of lung over time and reflect the true nature of the image data collected. As with the lung, random searches of the pleura were used to reflect the true nature of the image data collected. On occasion, ‘purposeful searches’ were undertaken in which specific features of interest were imaged for use in 3D reconstruction projections.
Parietal pleural SEM image collection and analysis
Parietal pleural tissue specimens prepared for SEM were examined at 1000× magnification. Five random fields-of-view were recorded from each tissue piece. SEM image data were analyzed for inflammatory cells and fiber profiles.
Pleural method 2—chest wall
This procedure was designed to investigate the fiber load and pathological response within the pleural space between the visceral and parietal surfaces of the intact chest wall following inhalation exposure. The sampling approach surveyed a cross-section of epoxy-embedded, freeze-substituted chest wall prepared in cross-section. Tissue surfaces of the lung, visceral, and parietal pleura, as well as features of interest within the pleural space, were analyzed by confocal microscopy. Random fields-of-view (n = 10) per animal were recorded along the visceral pleural surface to estimate the number of fibers and inflammatory cells present in the pleural space compartment.
Tissue collection
At 181, 272, and 365 days following cessation of exposure, three animals from each group were sacrificed and the intact bodies snap frozen by immersion in liquid nitrogen. Rats were sealed in plastic bags, shipped in dry ice, and stored at −80°C in vacuum sealed plastic bags prior to analysis.
Chest wall preparation procedure
Beginning at the base of the skull, cross-sectioned slabs (13 mm thick) of the entire chest region were collected from rat bodies. Slabs were cut in sequence under dry ice conditions using a high speed band saw. Each slab was placed in liquid nitrogen upon being cut. Each rat body was returned to liquid nitrogen between cuts. Slab collection required approximately 3 sec per pass of the saw blade.
Frozen slabs were positioned in dry ice and trimmed down to the ribs and intercostal muscle layer. Cross-sections of chest wall were then subjected to a low temperature (−80°C) methanol/acetone freeze substitution with repeated changes for 30 days followed by step up to −4°C then to room temperature. Freeze-substituted chest wall slabs were stained by immersion in methanolic Lucifer Yellow-CH. Epoxy infiltration proceeded with transition in propylene oxide, with embedment in Spurr epoxy plastic and cured at 60°C. Chest wall slabs were cut using a 4 inch diameter diamond blade with a 4 mm thick kerf. Cut pieces were then polished to a flat glass-smooth surface on a gemstone lapidary tool.
Confocal image collection and analysis
Polished chest wall pieces were affixed to glass slides and imaged under by confocal microscopy. Fields-of-view that exhibited a pleural space width of 10 µm or wider were selected. Stacks of 25 serial sections each were recorded. Ten fields-of-view were recorded from the pleural space of each animal. Stacks of image data were analyzed for the number of fibers and fiber 3D length. On occasion, purposeful searches were undertaken to re-examine features of interest.
Image data was recorded subjacent to the surface of the cut surface of chest wall pieces in order to avoid any artifacts from the physical cutting process of the chestwall. Optical sectioning technique were employed using the confocal microscope to limit the effect of physical damage to fibers. The confocal microscope permits extended depth viewing (up to 200 microns) into undisturbed regions of tissue such as chestwall.
Results
Validation of lung digestion procedure
Comparative confocal microscopy was used to assure that the lung digestion and TEM procedures used in this study did not affect the fiber dimensions of the chrysotile present in the lung (Bernstein et al., Citation2004).
The results of this analysis confirmed that there was a very good correlation between the length distribution as measured by the lung digestion procedure/TEM and the confocal methodology with a correlation r2 = 0.9 and that the TEM procedure does not reduce the length distribution of the fibers seen in confocal analysis. In addition, the mean number of fibers remaining at each time point for the chrysotile group showed a good correlation (r2 = 0.9) between the TEM measurements from the lung digestion procedure and the measurements obtained by confocal microscopy.
Aerosol exposure
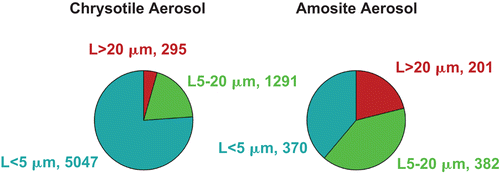
The aerosol concentration and size distribution of all groups are shown in . The fiber aerosol concentrations were chosen based upon the EC protocol, which specifies that the exposure atmospheres should have at least 100 fibers/cm3 longer than 20 µm. In this study, additional chrysotile was added to the sanded material in order to achieve the mean number of fibers/cm3 longer than 20 µm. The resulting mean number of fibers longer than 20 um was 295 for chrysotile and 201 for amosite.
Table 3. Aerosol concentration and size distribution of the air control, CSP, and amosite inhalation exposure atmospheres.
The mean gravimetric concentration of the chrysotile exposure atmosphere was 2.64 mg/m3. The corresponding mean gravimetric concentration of the sanded material (including sanded 7RF3 chrysotile) was 1.05 mg/m3, with the sanded material having a MMAD of 1.18 µm. The corresponding mean gravimetric concentration of the amosite-exposure atmosphere was 6.39 mg/m3. As shown below, this difference was due to the difference in the amosite fiber size distribution in comparison to the chrysotile.
The mean number of WHO fibers (defined as fibers > 5 μm long, < 3 μm wide, and with length:width ratios > 3:1; WHO, Citation1985) in the CSP atmosphere was 1496 fibers/cm3, which was more than 10,000 times the Occupational Safety and Health Administration (OSHA) occupational exposure limit of 0.1 fibers/cm3. The amosite-exposure atmosphere had fewer shorter fibers, resulting in a mean of 584 WHO fibers/cm3. The mean total number of fibers of all sizes in the exposure atmosphere was 6543 fibers/cm3 for chrysotile and 953 fibers/cm3 for amosite.
illustrates the mean number of fibers in the exposure atmospheres in each of the three length categories < 5 µm, 5–20 µm and > 20 µm for chrysotile and amosite.
Figure 3. The mean number of fibers in the exposure atmospheres in each of the three length categories < 5 µm, 5–20 µm and > 20 µm are illustrated for the chrysotile and amosite aerosols.
The bivariate length and diameter size distributions of the CSP aerosol and the amosite aerosol are shown in . The CSP consisted largely of shorter fibers even though there were nearly 300 fibers/cm3 from 20 to 180 µm in length, most of which were less than 0.3 µm in diameter (rat-respirable). The amosite-exposure atmosphere had slightly thicker fibers nearly all of which were still less than 1 µm in diameter, and therefore rat-respirable. The longer fibers ranged in length from 20 to 150 µm.
Figure 4. The bivariate length and diameter size distributions of chrysotile fibers and sanded joint compound particles aerosol and the amosite aerosol.
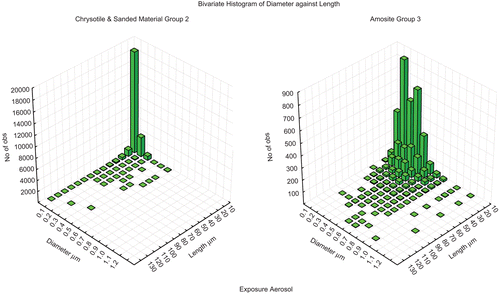
The mean equivalent fiber diameter was 0.03 µm for the CSP atmosphere and 0.17 µm for the amosite asbestos atmosphere. Such equivalent fiber diameters would result in maximal deposition in the more distal portions of the lung (Harris & Fraser, 1976). As presented below in the comparison of lung airway versus parenchyma fiber concentrations as determined by confocal microscopy () over 99% of the fibers in the CSP were observed in the parenchyma.
SEM photomicrographs of the aerosol from the CSP atmosphere and the amosite-exposure atmosphere are shown in the Supplementary data, Figure S1.
Fiber lung burdens
The mean concentrations and dimensions of the fibers recovered from the lungs at each time point for CSP and for amosite, respectively, are presented in and .
Table 4. CSP exposed lungs—mean concentrations and dimensions of the fibers recovered from the lungs at each time point.
Table 5. Amosite-exposed lungs—mean concentrations and dimensions of the fibers recovered from the lungs at each time point.
The lung burden immediately after cessation of the 5 days of exposure (referred to as day 0) represents the clearance dynamics of the fibers in the lung over these 5 days of exposure. As presented in and , immediately after cessation of the 5-day exposure there was a mean of 0.31 million fibers/lung in the CSP exposed rats. This compared to a mean of 2.74 million fibers/lung in the amosite-exposed rats. If both fibers were equally biopersistent, the mean in the CSP group would be similar to, or even greater than the mean of the amosite group. However, as a result of the lower biopersistence of chrysotile, the longer fibers have been clearing since the first day of the 5-day exposure so that even immediately after cessation of the last exposure, considerably fewer fibers were remaining in the lungs.
In the CSP group the number of fibers greater than 20 μm in length continued to diminish rapidly after cessation of exposure, with none observed at 90 days. At 90 days, 91% of all fibers present were less than 5 μm in length. The geometric mean length (GML) at 90 days was 2.31 μm, the longest fiber present was 20 μm, and the geometric mean diameter (GMD) was 0.04 μm. In contrast, in the amosite-exposure group, more than 11% of the fibers remaining at 90 days were greater than 20 µm in length, with only 48% of the fibers less than 5 µm in length. The GML at 90 days was 5.65 µm, the longest fiber present was 110 µm, and the GMD was 0.29 µm.
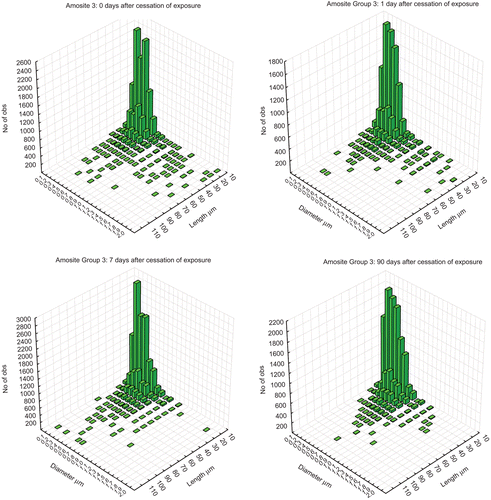
and show the bivariate length and diameter histograms (sum of all lungs) in the lungs of the animals at 0, 1, 14, and 90 days following cessation of the 5 days of exposure for the CSP and amosite groups, respectively. In the CSP exposed group (upper panels), at 0 and 1 day, while the majority of fibers were shorter as in the aerosol, a distribution of longer fibers up to 90 µm in length was also present. By day 14, the fibers longer than 30–40 µm were no longer observed. By 90 days after cessation of exposure no fibers longer than 20 µm in length were observed. In the amosite-exposed group (lower panels), the distribution of fibers remaining in the lungs of animals exposed to amosite was quite different than was seen with chrysotile. At 0 and 1 day after cessation of exposure, considerably more long fibers with lengths up to 110 µm were present. By day 14 after cessation of exposure, the fibers thicker than approximately 1 µm have been cleared suggesting that they were on the tracheobronchial tree.In contrast to the chrysotile exposure, where no longer fibers remained in the lungs by 90 days postexposure, the distribution of the longer fibers that were less than approximately 1 µm in diameter remained largely unchanged in the amosite-exposure group at 90 days.
Figure 5. The bivariate length and diameter histograms (sum of all lungs in that group at each time point) of the number of fibers remaining in the lungs of chrysotile fibers and sanded joint compound particles exposed animals at 0, 1, 14, and 90 days following cessation of exposure.
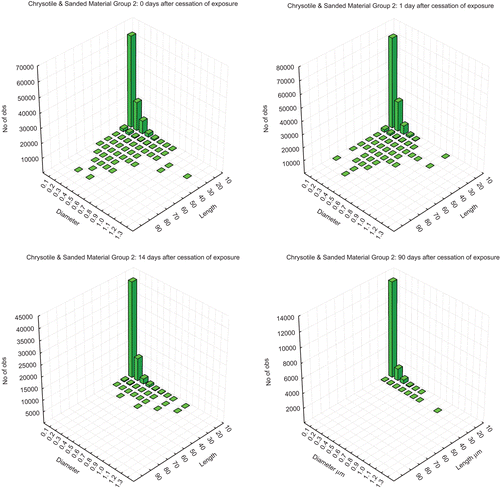
Figure 6. The bivariate length and diameter histograms (sum of all lungs in that group at each time point) of the number of fibers remaining in the lungs of the amosite-exposed animals at 0, 1, 14, and 90 days following cessation of exposure.
As described above, the air control was exposed to filtered air without any fibers using similar aerosol generation and exposure systems. The lungs from the control animals were processed and analyzed using the same procedures. No WHO fibers (including fibers L > 20 µm) were observed in the lungs of the control animals at 0, 14, 30, or 90 days postexposure.
Fiber clearance
The chrysotile fibers longer than 20 µm in the lung were rapidly removed with a clearance halftime of 4.5 days (). The clearance halftimes were determined using the statistical procedures specified in the EC protocol (EUR 18748 EN, 1999). The clearance curve was fitted to the data using nonlinear regression techniques with a single or double exponential (StatSoft, Inc., Citation2008).
Figure 7. Clearance of fibers longer than 20 µm from chrysotile fibers and sanded joint compound particles-exposure group (group 2) and the amosite-exposure group (group 3).
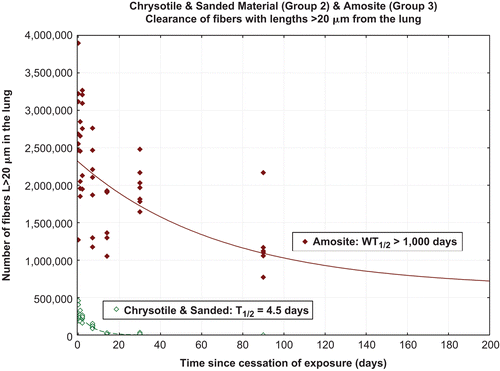
Those amosite fibers longer than 20 µm which deposit on the bronchial tree were cleared. However, longer fibers which deposited in the deep lung persist with a resulting halftime greater than 1000 days.
shows the clearance halftimes for fibers with lengths 5–20 µm. For the CSP group the intermediate length chrysotile fibers were cleared with halftime of 13 days. Amosite, fibers of intermediate length cleared with halftime longer than 1000 days.
Figure 8. Clearance of fibers 5–20 µm in length from chrysotile fibers and sanded joint compound particles (group 2) and the amosite-(group 3).
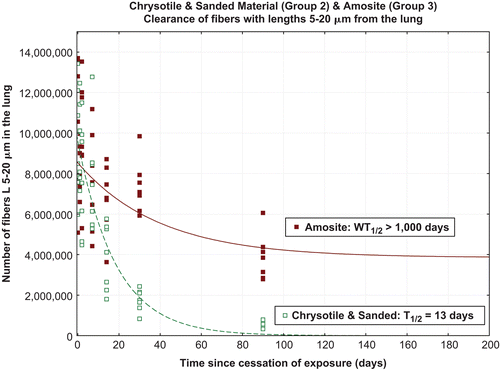
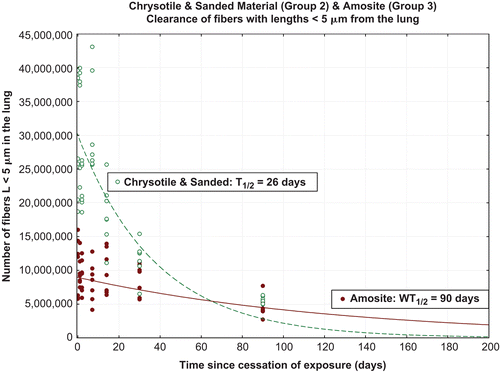
As shown in , chrysotile fibers less than 5 µm clear with a halftime of 26 days, again faster than reported for insoluble particles. The short amosite fibers, i.e. less than 5 µm in length, clear with a halftime of 90 days, which was similar to that reported for the clearance of insoluble particles.
Pathological findings in the lung
While the fiber clearance results sharply differentiate chrysotile fiber retention from that of amosite asbestos, the histopathology findings provide a basis for determining the biological relevance of this difference.
The summary incidence of histopathological findings in the lung through 90 days after cessation of exposure is presented in . The specific histological findings seen in the lung and the mean grade observed for each finding is indicated. For those groups and time points for which no observations were noted, a dash is shown. Severity was scored on the following scale: no lesions, minimal, slight, moderate, marked, or massive (grades 0–5 respectively).
Table 6. Histopathological findings in the lung at 0, 7, 14, 28, and 90 days postexposure in the air control animals (group 1), the CSP animals (group 2), and the amosite asbestos-exposed animals (group 3).
There were no exposure-related histopathological findings, including any indication of an inflammatory response, at any time point, in animals exposed to either filtered air or CSP. Although macrophage aggregation was noted in one rat in the CSP group at 90 days after cessation of exposure, the pathologist did not consider this finding to be related to exposure.
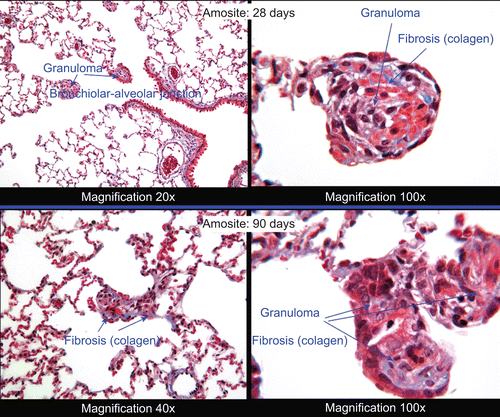
In the amosite asbestos exposure group, macrophage aggregation and microgranuloma were seen in all animals immediately after the cessation of the five-day exposure. This persisted through days 7 and 14 and developed with increasing severity. By day 28, interstitial fibrosis was observed. The severity of this fibrotic response increased further by 90 days.
The Wagner score for inflammatory change and fibrosis was evaluated for all rats at scheduled sacrifices as presented in (McConnell et al., Citation1984; McConnel & Davis, Citation2002). In this system a grade of 1 was considered normal, grades 2–3 were evidence of focal cellular change, while grades 4–8 represent increasing degrees of fibrosis. Grades 1–3 were considered reversible while grades 4–8 were considered irreversible.
In both the air control group and in the CSP group, the pathological findings corresponded with a Wagner score of 1 at all time points.
In the amosite asbestos exposure group, the pathological findings corresponded with a Wagner score of 2 starting at day 0 and continuing through day 14. By day 28, the pathological response corresponded to a Wagner score of 4, indicating interstitial fibrosis. This level of response persisted through day 90.
These findings were illustrated in the histopathological micrographs shown in and .
Figure 10. Histopathological photomicrographs: on the left is a control lung at 28 days following cessation of exposure. On the right is a lung from the chrysotile fibers and sanded joint compound particles group at 90 days following cessation of exposure. In the upper right-hand corner is a terminal bronchiole leading through the bronchiolar alveolar junction into the alveoli. A few macrophages can be seen in some of the alveoli (magnification 40×).
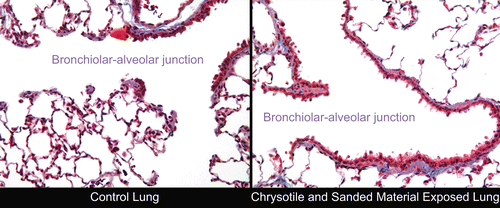
Figure 11. Histopathological photomicrographs: microgranuloma observed in an amosite-exposed lung at 28 and 90 days postexposure. Left pane at lower magnification of 20× or 40×. Right pane at a magnification of 100× showing at 28 days collagen developing in the granuloma (blue color). The right pane at 90 days shows granuloma with collagen deposition sufficient to be characterized as interstitial fibrosis.
shows a lung section from the air control group (left pane) at 28 days postexposure in comparison to the CSP group (right pane) at 90 days following cessation of exposure. The appearance of the lung from the CSP group was consistent to the air control group. A terminal bronchiole leading through the bronchiolar alveolar junction into the alveoli is seen in the upper right-hand corner. A few macrophages can be seen in some of the alveoli.
shows microgranuloma in an amosite-exposed animal at 28 days postexposure and the further development of the inflammatory response at 90 days postexposure. The right panes show higher magnification (100×) of one of the granulomas. By 28 days postexposure, collagen can already be seen developing in the granuloma (blue-color). By 90 days postexposure, the lesions in the amosite-exposed animals were sufficient to be characterized as interstitial fibrosis. The right pane shows granuloma formation with extensive inflammation and further collagen deposition at higher magnification (100×). A long amosite fiber can also be seen.
Confocal microscopy of the lung
While the histopathological micrographs presented above provide a classical recognition of the state of the lung tissues, they often were not able to show the actual fibers present, due to the use of thin sections and the refractive index of the fibers. In addition, the thin sections used in histopathological examinations sample only a very small portion of the total lung.
The use of confocal microscopy provides a methodology through which these limitations can be overcome. As presented above, the confocal microscopy methodology examines a cube of lung tissue in a noninvasive manner, and therefore, provides a parallel method for validating that the lung digestion procedures did not alter fiber characteristics.
Confocal microscopy identifies the location of each fiber individually in the lung. On a broad scale this allows the differentiation of the number of fibers in the airways and in the parenchyma. Such noninvasive differentiation allows assessment of whether the fibers in the aerosol were able to reach the gas exchange region of the lung.
In addition, the confocal images provide a means of conceptualizing the interaction between the cells (macrophages, epithelial cells, etc.) and the fibers. The importance of fiber length in this process has been frequently discussed. With the confocal images, the question of whether the frustrated macrophage phagocytosis associated with longer fibers was related to inflammatory response can be better understood.
Regional quantification of fibers in the lung
Airway versus parenchyma
One issue that was often of concern in performing inhalation studies was whether the test material has reached the site where disease can develop. Because confocal microscopy procedures used in this study can determine not only the number and size of fibers present but also where within the lung compartments the fibers were located, this methodology provides a unique ability to determine the fraction of inhaled fibers which penetrated to the lung parenchyma.
presents for CSP the estimated mean total number of fibers in the parenchyma and in the airway of the lung as extrapolated from confocal measurements. While the total order of magnitude was influenced by the estimated volume of the lung, the combined values were proportional to those observed following lung digestion by TEM. The difference in magnitude between the confocal lung burden estimates and the TEM measurements was a result of the estimation procedure for the lung volume. The lung volume estimates assume that all lungs were fully inflated to a pressure of 25 cm H2O. Of the 42 animals prepared for quantitative confocal microscopy two had no airway inflation and three exhibited under inflated lungs. In all cases, the number of fiber profiles observed in these animals were not affected, with the inflation effecting only the volume estimate. In addition, as the left lung was assigned for histopathological examination, the lung volume estimates were based on an accurate lung weight of only the right lung as recorded by Rogers Imaging Corporation. Total lung weight was estimated using a correction based on known lung displacement sizes of left and right lungs from as determined in previous studies (Bernstein et al., Citation2004).
Table 7. Confocal analysis—for CSP the estimated mean total number of fibers in the parenchyma and in the airway of the lung as extrapolated from the confocal microscopy measurements.
As demonstrated in , immediately after the cessation of exposure, over 99% of the fibers in the CSP were observed in the parenchyma, confirming that fibers did reach the gas exchange region of the lung. By 90 days after cessation of exposure the fiber load remaining was observed entirely in the parenchyma.
Localization of fibers within the airways and parenchyma
In addition to estimating total airway and parenchyma fiber load, the confocal microscopy procedures used in this study determined the location within the lung of each fiber individually. These were grouped according to the following categories.
Fibers in airways were classified as occurring:
on surface of or intercalated within ciliated epithelium of conducting airway,
within airway macrophage,
in airway lumen; portion of fiber visualized not touching tissue, and
penetrating the airway wall or located completely underneath the airway wall.
Fibers in parenchyma were classified as occurring:
in alveoli, alveolar ducts, or respiratory bronchioles, in contact with the surface of tissue,
in ducts or alveoli, but not in contact with tissue in the recorded volume,
wholly or partly inside alveolar macrophages, and
partly or fully embedded into the interstitial space (fibers in this compartment often had one end in the interstitium and the other end in the airspace engulfed by macrophages).
shows the distribution of fibers within the airways and the distribution of fibers within the parenchyma according to these categories as a function of time after cessation of exposure for CSP and the amosite-exposure group.
Figure 12. Distribution of fibers in the airways by subcompartment as a function of time after cessation of exposure for chrysotile fibers and sanded joint compound particles compared to the amosite asbestos exposure group.
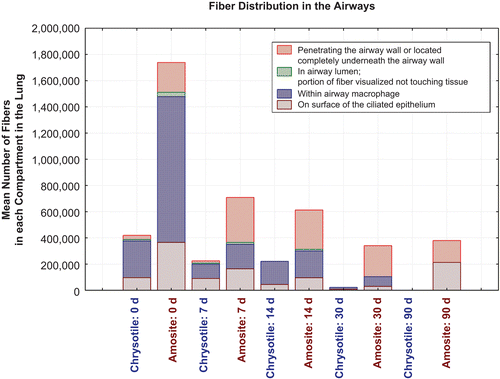
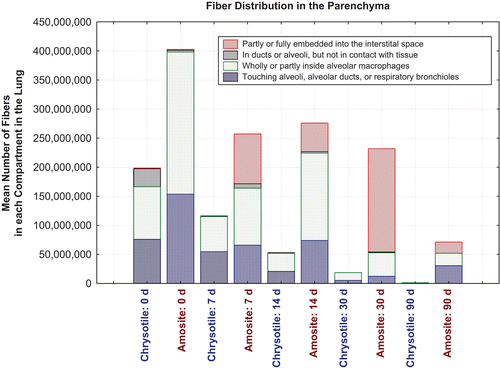
Figure 13. Distribution of fibers in the parenchyma by subcompartment as a function of time after cessation of exposure for chrysotile fibers and sanded joint compound particles compared to the amosite asbestos exposure group.
Immediately after exposure, in the CSP group, a mean of 420,000 fibers longer than 5 µm (0.2% of the total lung fiber burden) was observed in the airways with the majority located either in airway macrophages or on the ciliated epithelial surface (). The number of fibers in the airways was slowly reduced over the next 14 days, and by day 30, most of the tracheal bronchial clearance was complete. At 90 days, no chrysotile fibers were observed in the airways. The bivariate TEM fiber analysis () has shown that by 90 days, all chrysotile fibers remaining in the lung were shorter than 20 µm.
Immediately after cessation of exposure, 99.8% of the fibers were found in the parenchyma (). The majority of these were seen either in alveolar macrophages or touching the alveolar or ductal epithelium. The numbers in each compartment were reduced over subsequent time points, with fibers found only in the macrophages by 90 days.
In the amosite exposure group, a similar distribution of fibers in the airways was found on day 0, although considerably more fibers were present, the majority were found in airway macrophages or intercalated within ciliated epithelium of conducting airways (). By 90 days, fibers were observed on the surface of or intercalated within ciliated epithelium of the conducting airways and penetrating or located completely underneath the airway wall. The length distribution of the longer amosite fibers as observed by the bivariate TEM fiber analysis () did not change by 90 days, with numerous fibers longer than 20 µm remaining.
While at day 0 only a small percentage of amosite asbestos fibers were found either partly or fully embedded in the interstitial space, the number in the interstitium increased substantially over subsequent time points with approximately 20,000,000 amosite fibers remaining in the interstitium at 90 days postexposure, in contrast to the CSP, where no fibers were found partly or fully embedded in the interstitial space after 7 days ().
In the random sampling of the lung from CSP exposed animals used in the confocal analysis, one fiber longer than 20 microns was observed in an animal at the 7-day time point. By the 14 and 30 day time points, no fibers greater than 20 microns were observed in randomly collected image data. The mean length of the chrysotile fibers in CSP decreased from 5 µm at day 0 to 1.5 µm at 90 days.
The length distribution of amosite fibers showed a much different result where the mean length increased from 14.8 µm at 0 days, to 21 µm at 90 days indicating a preferential retention of long amosite fibers.
Inflammatory cells
No neutrophils were observed in any of the animals exposed to CSP. Thus, there was no evidence for an inflammatory reaction at the time points examined to date.
In animals exposed to amosite, numerous enlarged macrophages with vacuolated cytoplasmic profiles were frequently observed. In addition, numerous smaller cells, indicative of neutrophils, were often intermixed with macrophages in the alveolar spaces.
Confocal microscopy images of the lung
The limit of detection of the confocal method used to quantify the disposition of the chrysotile fibers in the lung was approximately 150 nm point-to-point resolution. Since most fibers were oriented to present various oblique profiles in longitudinal orientation, most fibrils greater than 150 nm in diameter were detected. Analysis of the bivariate length and diameter data obtained from the TEM analysis of the lung digestion procedures confirmed that the confocal analysis provided an accurate account of all fibers longer than 20 μm in the lung on day 0, as all such fibers observed by TEM were thicker than 0.15 μm. Shorter fibers with diameters greater than 0.15 μm were present in considerably larger number than thinner fibers (diameter < 0.15 μm) such as to provide an excellent account of the disposition of these length fibers as well. Similar results were seen throughout the study.
Each confocal 3D image examined a volume of lung tissue approximately 61.6 μm × 61.6 μm × 7.5 μm in x, y, and z, respectively with over 45,000 micrographs recorded to obtain the necessary quantitative information. The confocal analysis was noninvasive and provides an undisturbed true indication of both fiber location and lung pathology.
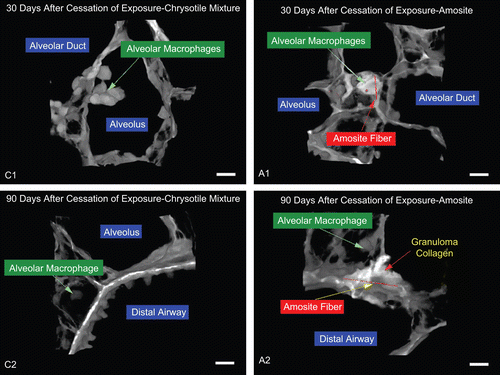
and show representative 3D projections reconstructed from confocal images of similar regions in the lung for CSP (left side, sublabeled C1,…) and the amosite-exposure group (right side, sublabeled A1,…) at 0, 20 and 90 days after cessation of exposure. In these images the cellular tissue is grayish in color while the collagen is the brighter white-color. The fibers are indicated in red.
Figure 14. Day 0—chrysotile: small fibers and particles are seen along with a number of macrophages which are likely phagocytizing the small fibers and particles. Amosite: a very long amosite fiber in the alveolar duct surrounded by numerous macrophages. The micron bar in the lower right corner is 10 µm in length.
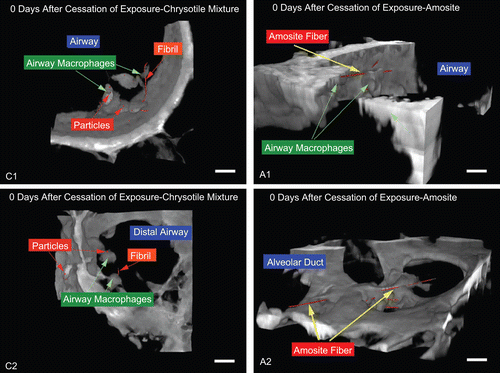
Figure 15. 30 and 90 days—chrysotile: airway macrophages are noted although no chrysotile fibers are evident. Amosite: long amosite fibers are seen embedded in the interstitium and the cellular matrix. The micron bar in the lower right corner is 10 µm in length.
shows fibers in the airways immediately after cessation of the 5-day exposure (postexposure analysis time point 0 days). show a long chrysotile fiber together with shorter fibers and particles from the exposure aerosol. Airway macrophages were associated with the particles and fibers. shows the airway region in the amosite-exposure group where a number of long fibers have been partially phagocytized by one or more airway macrophages. shows a very long amosite fiber in the alveolar duct surrounded by numerous macrophages. A number of smaller fibers intertwined in these macrophages can also be seen.
shows an alveolus with 3 or 4 macrophages at 30 days postexposure. No chrysotile fibers were seen external to the macrophages. shows an alveolus from an amosite-exposed animal at 30 days postexposure with a long fiber partially engulfed by macrophages and the tips of other fibers. The macrophages have almost completely filled this alveolus. This was likely a similar confocal view of one of the granulomas seen in the histopathology photomicrographs in .
shows a normal airway with adjacent interstitium and a distal airway with adjacent alveoli containing a macrophage at 90 days after cessation of the CSP-exposure. Again, no chrysotile fibers were evident at this time point. In the amosite-exposure group at 90 days postexposure, shows a granuloma within an alveolus completely filled with cellular matrix and a long amosite fiber. The brighter white regions of were indicative of collagen formation (fibrosis) in response to the amosite-exposure.
Images of the lymphatic ducts in the lung showing the clearance of the shorter fibers in both the CSP and the amosite asbestos exposure groups were shown in the Supplemental data, Figure S2.
Translocation of fibers to the pleural cavity and pathological response
While the disposition of fibers within the lung, clearance, and the interaction of remaining fibers with the lung tissue were important in determining the potential for inducing pulmonary toxicity, the results of this study also provide a basis for evaluating whether and how fast a fiber reaches the pleural cavity and whether it initiates a pathological response once there. Initial results from this aspect of the study were presented here.
The goal of this aspect of the project was to determine the extent and time course of translocation of fibers to the pleural cavity, to compare inflammatory cell accumulations on parietal surfaces in response to amosite and chrysotile fibers, and to probe the parietal surface tissue architecture for fibers in context with lymphatic ducts and pores at these sites. The study was designed to provide unique tissue response data concerning fiber egress to and through the parietal pleura using noninvasive techniques. The migration of fibers from the lung to the parietal pleura was examined and the presence of fibers was correlated with early biological response such as macrophages and inflammation. Quantitative microscopy was used to identify the transport pathway of fibers and to locate, to a high degree of accuracy, fibers within the parietal/visceral pleural tissues following aerosol exposure.
Examination of the diaphragm as a representative parietal pleural tissue
present images representative of the findings obtained thus far from the examination of the diaphragm. shows images of the diaphragm surface at 0 days immediately after cessation of the 5-day exposure for the air control, CSP, and the amosite-exposure group. At this time point there was no distinction among the diaphragms from the three groups.
Figure 16. images of the diaphragm surface at 0 days immediately after cessation of exposure for the air control, the chrysotile fibers and sanded joint compound particles group, and the amosite group. At this time point there is no distinction among the diaphragms from the three groups. The micron bar in the lower right corner is 10 µm in length.

Figure 17. Confocal image of the amosite-exposure group at 7 days after cessation of exposure. Amosite fibers with an accompanying macrophage inflammatory response are seen already. The micron bar in the lower right corner is 10 µm in length.
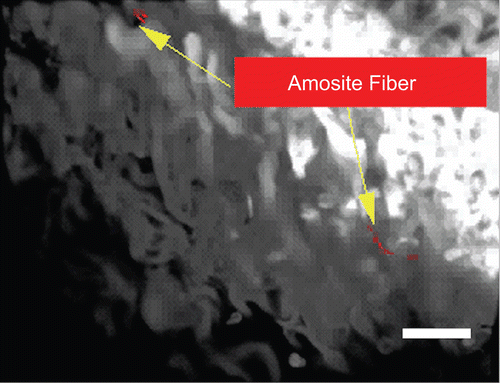
Figure 18. The diaphragms from the amosite-exposed group at 14, 30 and 90 days after cessation of exposure show increasing cellular proliferation on the surface. The micron bar in the lower right corner is 10 µm in length (the bar sort of blends in with the photo). The chrysotile fibers and sanded joint compound particles group was not different from the air control.

Figure 19. Scanning electron micrograph of the diaphragm from amosite-exposed group at 90 days after cessation of exposure. The surface of the amosite-exposed diaphragm shows extensive inflammatory proliferation with numerous activated inflammatory cells. The micron bar is 2 µm in length.
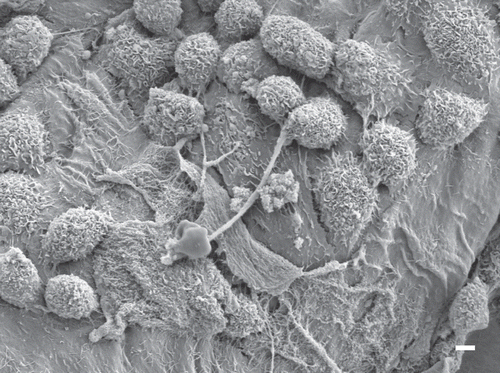
Figure 20. Chest wall: low temperature photomicrographs of the pleural space were recorded at selected locations to examine the presence of possible intrapleural pathology and inflammatory cells. The pleural space was surveyed for the presence of inflammatory cell accumulation and foreign bodies/fibers. The micron bar in the lower left corner is 10 µm in length.
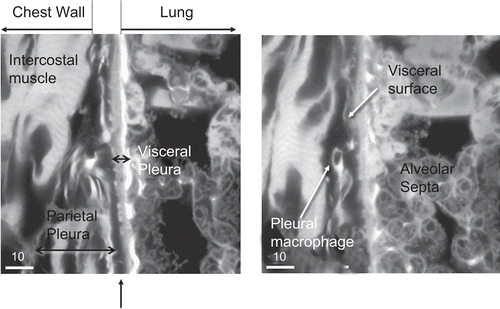
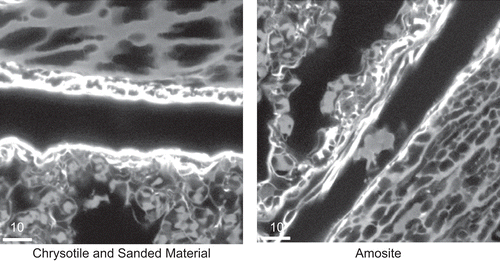
Figure 21. Representative images of the pleural space at 181 days after cessation of exposure for the chrysotile fibers and sanded joint compound particles group and the amosite group. No inflammatory cells were observed in the pleural space of the CSP exposed animal. The right-hand image is from an amosite-exposed animal and shows a mass of inflammatory cells within the pleural space. The micron bar in the lower left corner is 10 µm in length.
shows a confocal image of the amosite-exposure group at 7 days after cessation of exposure. Amosite fibers were seen on the surface of the diaphragm.
shows the progression of cellular proliferation and inflammatory response on the surface of the diaphragm at 14, 30, and 90 days after cessation of exposure for the amosite-exposure group. By 90 days, the diaphragms of amosite-exposed animal show large areas of cellular proliferation and abnormality.
The diaphragms from the CSP group showed no abnormality or inflammation at any time point and were not different from diaphragms from the air control group.
is a SEM photomicrograph of the surface of an amosite-exposed diaphragm at 90 days postexposure showing extensive inflammatory proliferation. Numerous activated inflammatory cells (including macrophages and neutrophils as confirmed through the confocal examination) were seen on the surface.
Examination of the pleural space using freeze-substituted chest wall specimens
The final results of this analysis will allow estimates of fiber size and location in the pleural space. The results thus far provide a qualitative indication of pleural translocation and pathological response.
shows the pleural space anatomy as observed from freeze-substituted chest wall specimens. The pleural space is shown traversing the center of each image. On the right side of the pleural space is the visceral pleura with the lung structure showing the alveolar septa behind. On the left side of the image is the parietal pleura with the intercoastal muscle behind. The right-hand image in also illustrates a pleural macrophage within the pleural space.
shows representative images of the pleural space at 181 days after cessation of exposure for the CSP group and amosite group on the left and right image panes, respectively. No inflammatory cells were observed in the pleural space of the CSP exposed animal (left image). The right-hand image from an amosite-exposed animal shows a small aggregate of activated pleural macrophages within the pleural space.
Discussion
This study was designed to determine whether there was a difference in the persistence and pathological response in the lung between a commercial product containing chrysotile fibers in comparison to the amphibole, amosite asbestos. Another key part of this study was to address whether there was a difference between these two fibers in terms of the quantity and rate of fiber transfer and any subsequent pathological response in the pleural cavity, the site of mesothelioma formation. This is the first study to evaluate these parameters using noninvasive techniques, thereby minimizing the potential for artefacts and bias.
The results from this study show a clear difference between the kinetics in and pathological response of the lung and pleural cavity when exposed to CSP in comparison to amosite asbestos through 90 days after cessation of exposure. No pathological response was observed at any time point in the CSP-exposure group. The Wagner score remained at 1 which was the same as the air control group. The long chrysotile fibers (L > 20 µm) cleared rapidly with a clearance halftime of 4.5 days and were not observed in the pleural cavity. In contrast, an immediate inflammatory response occurred following exposure to amosite that progressed to Wagner grade 4 interstitial fibrosis within 28 days following cessation of exposure. The long amosite fibers had a clearance halftime greater than 1000 days. The longer amosite fibers persisted in the lung and could not be cleared further after initial tracheal bronchial clearance. In addition, long amosite fibers were observed in the pleural cavity within 7 days following cessation exposure. By 90 days postexposure, the long amosite fibers in the pleural cavity were associated with a marked inflammatory response on the parietal pleural surface.
In the CSP group, the intermediate length fibers (5–20 µm) also cleared rapidly with a halftime of 13 days, while fibers shorter than 5 µm cleared with a halftime of 26 days. These clearance halftimes were faster than those reported for insoluble nuisance dusts, which clear with halftimes of 60–90 days (Stoeber et al., Citation1970; Muhle et al., Citation1987). In the amosite-exposure group, intermediate length fibers (5–20 µm) cleared with a halftime greater than 1000 days, while fibers shorter than 5 µm cleared with a halftime of 90 days, similar to insoluble nuisance dusts. The large inflammatory response in the lung and the resulting granulomatous formations in the alveoli caused by the longer amosite fibers appear to have also encompassed the intermediate length fibers, which were effectively locked in place as a result of this cellular response.
The distribution of fibers in the lung as determined by the morphometric confocal microscopy analysis has shown that the majority of fibers in the airways were cleared either in alveolar macrophages or directly on the ciliated epithelial surface. In the CSP group, fibers were no longer observed in the airways by 90 days after exposure. In the amosite-exposed animals, while fibers were no longer observed in the airway macrophages by 90 days after cessation of exposure, fibers were observed on the ciliated epithelium and penetrating the airway wall or completely underneath the airway wall.
The CSP exposed animals also show a steady decrease in fiber number in the alveoli and alveolar macrophages through 90 days postexposure. At 90 days, the few remaining fibers longer than 5 µm were observed only in alveolar macrophages. As demonstrated in both the histopathological examination and in the confocal imaging, these fibers were not associated with any inflammatory or pathogenic response.
In the amosite-exposed animals, while the majority of parenchymal fiber burden was in the alveoli and alveolar macrophages at zero days after cessation of exposure, many fibers were observed on the ciliated epithelium and partly or fully embedded into the interstitial space by 7 days. Fibers often had one end in the interstitium and the other end in the airspace engulfed by macrophages. This differentiation persists through 90 days after exposure. The histopathological examination and confocal imaging both clearly show that amosite fibers were embedded in the intense inflammatory and pathological response observed in the lung. The confocal images also show that the granulomas observed in amosite-exposed animals consist of one or more long amosite fibers surrounded by numerous macrophages and possibly other inflammatory cells. Shorter amosite fibers were often seen bound up in this cellular matrix.
The findings of this study were consistent with the current understanding of the physiology of the pleura. Plural liquid is mainly an infiltrate from capillaries in the parietal pleura lining the chest wall (Zocchi, Citation2002; Lai-Fook, Citation2004). Liquid filters into the pleural space driven by Starling forces through the parietal pleura. The pressure differential across the visceral pleura is in favor of liquid absorption (Agostoni, Citation1972, Citation1986, Citation1991, Citation1998; Negrini, Citation1995; Miserocchi & Negrini, Citation1997). The transpleural pressures were such that short thin fibers that may be present in the lymphatic system in the lung would not be likely to drain into the pleural space.
The lung tissue, however, is in constant movement as it inflated and deflated during each respiration. The alveoli expand nonuniformly and increase in size by a mean of 14% during respiration (Perlman & Bhattacharya, Citation2007). With nonuniform expansion weak points can be formed during respiration. From the confocal results of the current study the durable amosite fibers can penetrate the interstitial barrier possibly through such weak points and traverse the lung. When this happens in those alveoli adjacent to the visceral pleural surface the long biopersistent fibers could traverse into the pleural cavity.
A recent review by Donaldson et al. (2010) describes evidence for both asbestos and carbon nanotubes that a fraction of all deposited particles reach the pleura and that a mechanism of particle clearance from the pleura exits, through stomata in the parietal pleura. The review also explains that these stomata were the site of retention of long fibers which cannot pass through the stomata and which as a result lead to inflammation and pleural pathology including mesothelioma.
Conclusions
This study has demonstrated that there iss an important difference in the persistence and pathological response in the lung between a commercial product containing chrysotile in comparison to the amphibole, amosite asbestos. In addition, this study demonstrates that there is a difference between these two products in terms of the quantity and rate of transfer and the subsequent pathological response in the pleural cavity, the site of mesothelioma formation. This was the first study to evaluate these parameters using noninvasive techniques, thereby minimizing the potential for both artefacts and bias.
No pathological response was observed at any time point in the CSP group. The Wagner score remained at 1 which was the same as the air control group. The long chrysotile fibers (L > 20 µm) cleared rapidly with a clearance halftime of 4.5 days and were not observed in the pleural cavity.
In contrast, an immediate inflammatory response occurred following exposure to amosite, progressed to Wagner grade 4, interstitial fibrosis within 28 days following cessation of exposure. The long amosite fibers had a clearance halftime greater than 1000 days. The longer amosite fibers persisted in the lung and could not be cleared further after initial tracheal bronchial clearance. These long fibers were observed in the pleural cavity within 7 days following cessation of exposure. By 90 days postexposure the long amosite fibers in the pleural cavity were associated with a marked inflammatory response on the parietal pleural surface.
This study provides support that the sanded joint compound would not initiate an inflammatory response in the lung following inhalation and that the chrysotile fibers present do not migrate to the pleural cavity, the site of mesothelioma formation.
Declaration of interest
This work was supported by a grant from Georgia-Pacific, LLC.
Supplementary Material
Download PDF (636.7 KB)References
- Agostoni E, D’Angelo E. 1991. Pleural liquid pressure. J Appl Physiol 71(2):393–403.
- Agostoni E, Zocchi L. 1998. Mechanical coupling and liquid exchanges in the pleural space. Clin Chest Med 19(2):241–260.
- Agostoni E. 1986. Mechanics of the pleural space. In: Macklem PT, Mead J, eds. Handbook of Physiology: The Respiratory System, Mechanics of Breathing. Baltimore: American Physiological Society, pp. 531–559.
- Agostoni E. 1972. Mechanics of the pleural space. Physiol Rev 52(1):57–128.
- Bernstein DM, Donaldson K, Decker U, Gaering S, Kunzendorf P, Chevalier J, Holm SE. 2008. A biopersistence study following exposure to chrysotile asbestos alone or in combination with fine particles. Inhal Toxicol 20(11):1009–1028.
- Bernstein DM, Hoskins JA. 2006. The health effects of chrysotile: current perspective based upon recent data. Regul Toxicol Pharmacol 45(3):252–264.
- Bernstein DM, Rogers R, Smith P. 2004. The biopersistence of brazilian chrysotile asbestos following inhalation. Inhal Toxicol 16(11–12):745–761.
- Brorby GP, Sheehan PJ, Berman DW, Greene JF, Holm SE. 2008. Re-creation of historical chrysotile-containing joint compounds. Inhal Toxicol 20(11):1043–1053.
- Cannon WC, Blanton EF, McDonald KE. 1983. The flow-past chamber: an improved nose-only exposure system for rodents. Am Ind Hyg Assoc J 44(12):923–928.
- European Commission. 1997. EC Directive 97/69/EEC. O.J. L 343/19 of 13 December 1997. Commission Directive 97/69/EC of 5 December 1997 adapting to technical progress for the 23rd time Council Directive 67/548/EEC on the approximation of the laws regulations and administrative provisions relating to the classification, packaging and labelling of dangerous substances.
- European Commission. 1999. ECB/TM/26 rev.7. Methods for the determination of the hazardous properties for human health of man made mineral fibers (MMMF). European Commission.Joint Research search Centre, Institute for Health and Consumer Protection, Unit: Toxicology and Chemical Substances, European Chemicals Bureau.
- Hesterberg TW, Axten C, McConnell EE, Hart GA, Miiller W, Chevalier J, Everitt J, Thevenaz P, Oberdörster G. 1999b. Studies on the inhalation toxicology of two fiberglasses and amosite asbestos in the syrian golden hamster. Part I. Results of a subchronic study and dose selection for a chronic study. Inhal Toxicol 11(9):747–784.
- Hesterberg TW, Chase G, Axten C, Miller WC, Musselman RP, Kamstrup O, Hadley J, Morscheidt C, Bernstein DM, Thevenaz P. 1999a. Biopersistence of synthetic vitreous fibers and amosite asbestos in the rat lung following inhalation. Toxicol Appl Pharmacol 151(2):262–275.
- Hesterberg TW, Axten C, McConnell EE, Oberdörster G, Everitt J, Miiller WC, Chevalier J, Chase GR, Thevenaz P. 1997. Chronic inhalation study of fiber glass and amosite asbestos in hamsters: twelve-month preliminary results. Environ Health Perspect 105(Suppl 5):1223–1229.
- ILSI. 2005. Testing of fibrous particles: short term assays and strategies. Inhal Toxicol 17(10):497–537.
- Lai-Fook SJ. 2004. Pleural mechanics and fluid exchange. Physiol Rev 84(2):385–410.
- McConnell EE, Axten C, Hesterberg TW, Chevalier J, Miiller WC, Everitt J, Oberdörster G, Chase GR, Thevenaz P, Kotin P. 1999. Studies on the inhalation toxicology of two fiberglasses and amosite asbestos in the Syrian golden hamster. Part II. Results of chronic exposure. Inhal Toxicol 11(9):785–835.
- McConnell EE, Davis JM. 2002. Quantification of fibrosis in the lungs of rats using a morphometric method. Inhal Toxicol 14(3):263–272.
- McConnell EE, Wagner JC, Skidmore JW, Moore JA. 1984. A comparative study of the fibrogenic and carcinogenic effects of UICC Canadian chrysotile B asbestos and glass microfibre (JM100). In: Thorstein Guthe (ed.) Biological Effects of Man-Made Mineral Fibers. Report of a WHO/IARC meeting. Copenhagen: WHO, pp. 234–252.
- Miserocchi G, Negrini D. 1997. Pleural space: pressure and fluid dynamics. In: Crystal RG, West JB, eds. The Lung: Scientific Foundations. Philadelphia: Lippincott-Raven, pp. 1217–1225.
- Muhle H, Pott F, Bellmann B, Takenaka S, Ziem U. 1987. Inhalation and injection experiments in rats to test the carcinogenicity of MMMF. Ann Occup Hyg 31(4B):755–764.
- Negrini D. 1995. Integration of capillary, interstitial and lymphatic function in the pleural space. In: Reed RK, Mc Hale NG, Bert JL, eds. Interstitium Connective Tissue and Lymphatics. London: Portland, pp. 283–299.
- Perlman CE, Bhattacharya J. 2007. Alveolar expansion imaged by optical sectioning microscopy. J Appl Physiol 103(3):1037–1044.
- Rogers RA, Antonini JM, Brismar H, Lai J, Hesterberg TW, Oldmixon EH, Thevenaz P, Brain JD. 1999. In situ microscopic analysis of asbestos and synthetic vitreous fibers retained in hamster lungs following inhalation. Environ Health Perspect 107(5):367–375.
- StatSoft, Inc. 2008. STATISTICA (data analysis software system), version 8.0. http://www.statsoft.com
- Stoeber W, Flachsbart H, Hochrainer D. 1970. Der aerodynamische durchmesser von latexaggregaten und asbestfassern. Staub-Reinh Luft 30:277–285.
- World Health Organization. 1985. Reference methods for measuring airborne man-made mineral fibers (MMMF). WHO/EURO MMMF Reference Scheme. Copenhagen: World Health Organization.
- Zocchi L. 2002. Physiology and pathophysiology of pleural fluid turnover. Eur Respir J 20(6):1545–1558.
