Abstract
This paper describes the current prevalence and time trends of childhood obesity worldwide, and the association between childhood obesity and socio-economic status (SES). Childhood obesity has become a global public health crisis. The prevalence is highest in western and industrialized countries, but still low in some developing countries. The prevalence also varies by age and gender. The WHO Americas and eastern Mediterranean regions had higher prevalence of overweight and obesity (30–40%) than the European (20–30%), south-east Asian, western Pacific, and African regions (10–20% in the latter three). A total of 43 million children (35 million in developing countries) were estimated to be overweight or obese; 92 million were at risk of overweight in 2010. The global overweight and obesity prevalence has increased dramatically since 1990, for example in preschool-age children, from approximately 4% in 1990 to 7% in 2010. If this trend continues, the prevalence may reach 9% or 60 million people in 2020. The obesity–SES association varies by gender, age, and country. In general, SES groups with greater access to energy-dense diets (low-SES in industrialized countries and high-SES in developing countries) are at increased risk of being obese than their counterparts.
Introduction
The childhood obesity epidemic has become a serious public health problem in many countries worldwide and it is a major public health challenge of the 21st century (CitationJanssen et al., 2005; CitationWang & Lobstein, 2006; CitationWang & Beydoun, 2007). Recent studies indicate that approximately 20% of school age-children in European countries are overweight or obese, and 5% are obese. In North America, these figures are 30% and 15%, respectively. It is estimated that 155 million, or one in 10 school-age (5–17 years old) children are overweight or obese (CitationWHO, 2009). During recent years, overweight and obesity have been increasing dramatically in many developing countries, particularly in urban settings and among high socio-economic status (SES) groups (CitationIOTF, 2007; CitationWang & Lobstein, 2006; CitationWang et al., 2007).
Although current understanding of the health consequences of overweight and obesity is predominately based on adult studies, increasing evidence suggests that childhood obesity has a number of immediate, intermediate, and long-term health consequences. Childhood obesity has long-term effects on mortality and morbidity (CitationDietz, 1998; CitationMust & Strauss, 1999). Overweight and obese children are likely to maintain their status into adulthood and are at higher risks for developing chronic diseases such as hypertension, dyslipidaemia, type 2 diabetes, heart disease, stroke, gallbladder disease, osteoarthritis, sleep apnoea and respiratory problems, and certain cancers (CitationWHO, 2010). The prevalence of type 2 diabetes has also been increasing among young people in many countries during recent years, largely due to obesity. Moreover, the epidemic also has many economic consequences.
Overweight and obesity, as well as their related diseases, are largely preventable. Prevention therefore needs to be high priority (CitationWHO, 2010). A broad understanding of the childhood obesity epidemic will help guide intervention efforts and develop effective population-based programmes and policies. To identify articles to review for this study, we searched PubMed for keywords including child, childhood, obesity, overweight, body mass index, BMI, epidemic and trend.
Classification of childhood overweight and obesity
Various measures and references have been used to define obesity and overweight in children and adolescents. This has likely affected prevalence estimates over time as well as across populations and between studies. Current consensus holds body mass index (BMI = weight/height (kg/m2)) as a good measure of adiposity in children and adolescents (CitationCole et al., 2000; CitationKuczmarski et al., 2000; CitationWang, 2004; CitationWHO, 1995, Citation2000). However, BMI varies substantially by age and gender during childhood and in adolescence. Thus, unlike in adults, BMI cut-off points used to classify obesity in children and adolescents should be sex–age-specific. Note that for adults, BMI of 25 and 30 are widely used to defined overweight and obesity, respectively (CitationWHO, 2000).
Different references based on weight-for-height indexes, such as BMI and weight-for-height, have been used to classify body weight status for children. However, application of these measures varies considerably (CitationCole et al., 2000; CitationGuillaume, 1999; CitationKuczmarski et al., 2000; CitationWang, 2004; CitationWHO, 1995). For example, in the USA, the sex–age-specific 85th and 95th BMI percentiles have been used. Other countries, such as China, France, the UK, Singapore and the Netherlands, have developed their own BMI references using local data. The corresponding BMI cut-off points to these references differ considerably. A global reference would be useful to facilitate international comparisons and to monitor the global obesity epidemic. Below we will highlight a few references that have been used widely.
The International Obesity Task Force reference
The International Obesity Task Force (IOTF) endorses a series of sex–age-specific BMI cut-off points for children age 2–18 years (CitationCole et al., 2000). It has been recommended for international use based on its unique strengths. First, it is based on large data sets from six countries – Brazil, Britain, Hong Kong, the Netherlands, Singapore, and the USA. Second, the cut-offs are linked to adult BMI cut-offs, which are established indicators of risks for adverse health outcomes. It is also simple to use and consistent for children and adolescents. However, there are also some concerns about the IOTF reference (CitationWang & Wang, 2002). For example, the reference data sets may not adequately represent non-western populations. There is also great variation in the prevalence of overweight and obesity across the six source nations. Furthermore, little is known as to how BMIs above the IOTF cut-off points are related to later health consequences, and whether the consequences vary across populations. Nonetheless, it should be noted that other existing BMI references share these limitations as well.
2006 WHO growth standards for preschool children
In 2006, the WHO released new growth standards for children from birth to the age of 60 months (5 years old) (CitationWHO, 2006). In order to establish growth standards for different races/ethnicities, the Multicentre Growth Reference Study (MGRS) recruited affluent, breast-fed, and healthy infants/children whose mothers did not smoke during or after delivery from six cities in Brazil, Ghana, India, Norway, Oman, and the USA. This study included a longitudinal sample that was followed from birth to 24 months as well as a cross-sectional sample of 18-month to 71-month-old children. The MGRS data showed great similarity in growth across all study centres with only about 3% of the total variation in growth attributable to race/country. Hence, data across the centres were able to be pooled to create a more powerful sample to generate cut-off points. These standards include anthropometric indicators such as height-for-age (length-for-age), weight-for-age, weight-for-height (weight-for-length), and BMI-for-age. BMI Z-score ≥ 2 was recommended to classify ‘obesity’ and BMI Z-score ≥ 1 to classify ‘overweight’.
2007 WHO growth reference for school-age children and adolescents
In 2007, the WHO released another set of growth references for children and adolescents aged 5–19 years (Citationde Onis et al., 2007). To our knowledge, these have not been widely used. The references were derived based on the same US dataset for the 1978 WHO/NCHS growth references, but used different growth curve smoothing techniques. The references include three indicators: BMI-for-age, weight-for-age, and height-for-age. Overweight and obesity cut-off points were based on BMI-for-age Z-scores. A Z-score of 1 was found to be equivalent to a BMI-for-age of 25.4 for boys and 25.0 for girls in 19 year olds. As these values are equal or close to the WHO BMI cut-off points of 25 used in adults, it was recommended to use a Z-score of 1 to classify ‘overweight’ and a Z-score ≥ 2 to classify ‘obesity’. BMI-for-age Z-scores < −2 and < −3 were set as the cut-off points for thinness and severe thinness, respectively.
BMI references used in the USA
In 2000, the US National Center for Health Statistics (NCHS) and the Centers for Disease Control and Prevention (CDC) updated growth charts using data from five national health examination surveys from 1963–1994. The resultant 2000 CDC growth charts provided new BMI percentiles (CitationKuczmarski et al., 2000) and recommended the use of sex- and age-specific 95th and 85th BMI percentiles to classify childhood obesity and overweight, respectively, in children over age 2 years. It should be noted that data from the most recent national surveys were excluded for children over the age of six when the NCHS developed these BMI cut-off points to avoid an upward shift of the weight and BMI curves. Moreover, the 85th and 95th percentile cut-off points are not tied to evidence of health risks. Before the release of the 2000 CDC growth charts, 85th and 95th percentiles based on data from the First National Health and Nutrition Examination Survey (NHANES, 1971–1974) were used in the USA as well as in many other countries to classify childhood obesity and overweight status (CitationMust et al., 1991; CitationWang et al., 2006).
The global epidemic of childhood overweight and obesity
Recent and current prevalence
Available data show that the combined prevalence of overweight and obesity (briefly called ‘combined prevalence’ in this report) is substantial in many regions and countries around the world, but large variations exist (see , and ). shows overweight and obesity prevalence in WHO-defined regions based on available data and the assumption that observed trends will continue. Our previous work to project combined prevalence for 2006 yielded a range from 17% in south-east Asia to 40% in the Americas (CitationWang & Lobstein, 2006). In general, combined prevalence is much higher in developed countries than in developing countries. There are also considerable age- and gender differences in many populations. Based on our estimations (CitationWang & Lobstein., 2006) and the findings of others (CitationJackson-Leach & Lobstein, 2006; CitationJanssen et al., 2005; CitationTremblay et al., 2002; CitationWillms et al., 2003), approximately 26% of school-age children in European countries were/are overweight or obese in 2006, and 5% were/are obese. In Americas, these figures were/are 28% and 10%, respectively.
Table 1. Prevalence (%) of overweight and obesity in school-age children based on available data and IOTF criteria, and estimated for 2006 and 2010.
Table 2. Combined childhood overweight and obesity prevalence (%) based on data collected since around the year 2000 for selected countries by WHO region.a
Table 3. Time trends in the combined prevalence (%) of overweight and obesity in preschool-age children aged 0–5 years for the years from 1990 to 2010 and projections for 2015 and 2020, by United Nations (UN) region.a
There are large between-countries variations in the prevalence across and within world regions (see , and ). show a global view of childhood overweight and obesity prevalence. Combined prevalence is high in western and industrialized countries, such as the USA, Canada, some European countries, some countries in South America, some nations in the Middle East, some nations in North Africa, and in the Asia-Pacific region (e.g. Indonesia and in New Zealand) (CitationAhrens et al., 2011). According to a recent study examining combined prevalence by WHO region (CitationAhrens et al., 2011), the region of the Americas (approximately 25–30%) and eastern Mediterranean region (approximately 20–40%) had higher prevalence than the south-east Asian and western Pacific regions including nations such as India, Malaysia, Vietnam, China, Australia, South Korea, and Japan. In contrast, the WHO African region had the lowest prevalence rate (about 10%). There were also differences between countries within the same WHO region. In the eastern Mediterranean region, the combined prevalences in Egypt and Kuwait were about 30% and 45% among girls, respectively, while the prevalence was only 14% amongst Iranian girls. Self-reported information in a 2001–2002 international school survey of 11, 13 and 15 year olds from 35 countries in Europe and North America (N = 162,305) showed large variation in the adolescent overweight prevalence rates in these countries, which ranged from 3.5% in Lithuanian girls to 31.7% in boys from Malta (CitationDue et al., 2009).
Figure 1. (A) Worldwide prevalence of obesity in children and adolescents. (B) Worldwide combined prevalence of overweight and obesity in children and adolescents. The prevalence estimates were calculated as the arithmetic mean of the age-specific estimates. Adapted from Epidemiology of Obesity in Children and Adolescents (Pigeot et al., 2011, p. 228, Figure 13.2) with kind permission of Springer Science & Business Media.
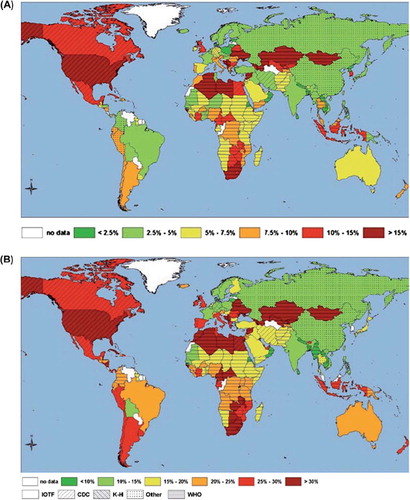
The International Association for the Study of Obesity (IASO) recently released combined prevalence figures for children and adolescents based on data from countries in the six WHO regions (CitationIASO, 2011); . The following countries had the highest combined rate in their respective WHO region: the USA (32%), Kuwait (44%), England (25%), New Zealand (28%), India (19%), Seychelles (18%). In the following we have highlighted one industrialized country (the USA) and one developing country's (China's) unique experiences of childhood obesity.
Example 1. The USA, the largest industrialized country
The USA has collected nationally representative data that allows the characterization of the extent of the obesity problem as well as time trends. In 2009–2010, 31.8% of children 2–19 years old were overweight or obese (BMI ≥ 85th percentile), and 16.9% were obese (BMI ≥ 95th percentile. The combined prevalence was lower in preschool age children compared to older children (approximately 27% versus 33%). Large disparities existed across ethnic groups, with lower prevalence in non-Hispanic whites (28%) compared to non-Hispanic blacks (39%) and Hispanics (39%) (CitationOgden et al., 2012).
In many developing countries, particularly those in Africa and south-east Asia, the combined prevalence is quite low, typically less than 5% or 10%. However, overall, nationally representative data are scarce in the developing world. Where data are available, the prevalence has increased over the past two decades, and currently, amongst urban and high SES groups in these countries, they have reached levels similar to those in some European countries.
Example 2. China, the largest developing country
While the overall combined prevalence is still low nationally (10–15%), it has been increasing rapidly over the past two decades. The prevalence in major cities and amongst high-SES groups has become similar to that in industrialized countries (CitationWang et al., 2007). In a large representative survey conducted in Beijing in 2004, we found 20% of children aged 0–18 years old were overweight or obese using the US BMI 85th percentile; and among urban boys, it was 34% (CitationShan et al., 2010).
Time trends in the prevalence of childhood obesity
Substantial data have been collected in many developed countries over the past two decades allowing for the examination of time trends in obesity in both adults and young people. However, comparable data are limited in developing countries. Nonetheless, several recent and comprehensive studies and reviews have examined trends over time. We studied the global trends in childhood obesity in a comprehensive meta-analysis of studies published between January 1980 and October 2005, from over 60 countries (CitationWang & Lobstein, 2006). We found the combined prevalence of overweight and obesity to increase in almost all countries for which data are available. Russia and Poland during the 1990s were exceptions to this trend. From the 1970s to the end of the 1990s, the combined prevalence doubled or tripled in several large countries in North America (i.e. Canada and the USA), the western Pacific region (i.e. Australia), and Europe (i.e. Finland, France, Germany, Italy, and Spain). We estimated the prevalence based on the IOTF BMI cut-off points ().
One recent study examined time trends in the combined prevalence in children age 0–5 years from 1990 to 2010, and projected worldwide rates for 2015 and 2020 () (Citationde Onis et al., 2010): 43 million children (35 million in developing countries) were estimated to be overweight or obese in 2010, and 92 million were at risk of overweight. This represents an estimated increase in global combined prevalence from 4.2% in 1990 to 6.7% in 2010. If such trends continue, these numbers may reach 9.1% (or approximately 60 million children) in 2020. For developing countries alone, the combined prevalence was estimated at 6.1% in 2010 and is expected to rise, perhaps as high as 8.6% by 2020. 2010 rates were lower in Asian than in Africa (4.9% versus 8.5%), but a much larger number of children are affected (17.7 million versus 13.3 million) in Asia compared to Africa. Given the dramatic increases in combined prevalence since 1990, the study concluded that effective interventions starting as early as infancy are necessary to reverse anticipated trends.
In some developing countries, the prevalence of child overweight and obesity has increased tremendously over the past two decades, with the combined prevalence within some sub-regions and population groups reaching levels of prevalence on par with some industrialized countries. This is especially the case in countries that have are in the midst of rapid social economic transitions (e.g. China, Brazil and Mexico). China, in particular, is illustrative of dramatic increases in obesity and overweight prevalence that outpace rates observed in industrialized countries.
Our understanding of the current global childhood obesity epidemic and time trend data remains limited despite a growing number of studies in this area. This is due to the lack of up-to-date, comparable and representative data from different countries. In addition, past studies have included dissimilar study samples (e.g. regarding age and SES) and used different criteria (e.g. cut-off points) to define obesity. Such makes it difficult to compare findings. Furthermore, there are large within-country differences in many countries for both the prevalence as well as secular trends of obesity. Variation occurs along lines of region, age, sex, race/ethnicity, and socio-economic status. For example, widely varied prevalence rates have been reported by different studies conducted in India across these factors (CitationWang et al., 2009).
Example 1. Trends in the USA
Since the late 1970s, the prevalence of overweight and obesity in children has increased for all ages between 2–19 years, but the increase in obesity levelled off in recent years. shows time trends in the prevalence of obesity (BMI ≥ 95th percentile) by age between 1971–1974 and 2009–2010. Between NHANES II (1976–1980) and 2003–2004, the average annual rate of increase in obesity prevalence was approximately 0.5 of a percentage point in children aged 2–19. However, this rate was slower in younger children. For example, during this period, the prevalence of overweight only increased from 7.2% to 13.9% in children aged 2–5 years, but almost tripled in children aged 6–11 (from 6.5% to 18.8%). In adolescents (12–19 years), the prevalence more than tripled, from 5.0% to 17.4%. In contrast, data from NHANES 2007–2008 shows a decrease in the prevalence of obesity among children aged 2–5 years, from 13.9% in NHANES 2003–2004 to 10.4%. During the same time period, the prevalence both in children aged 6–11 years and adolescents was only slightly increased (CitationOgden et al., 2010). In 2009–2010, the national prevalence of obesity (16.9%) was similar to that in 2007–2008; and it was 12.0%, 18.0%, and 18.4% in children aged 2–5, 6–11, and 12–19 years, respectively (CitationOgden et al., 2012).
Figure 2. Trends in the prevalence (%) of obesity (BMI ≥ 95th percentile) in US children and adolescents by age: 1971–1974 to 2009–2010. Based on national data collected in NHANES (CitationWang and Beydoun, 2007; CitationOgden et al., 2012).
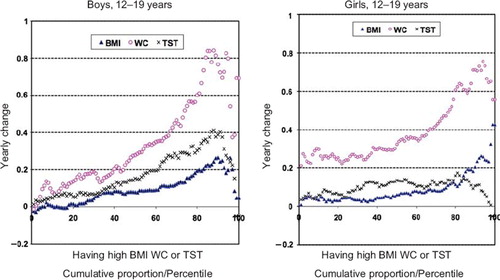
Examining time trends in prevalence estimates of overweight and obesity based on BMI is useful; however, it is also limited as it cannot reveal details about shifts in adiposity measures or distribution over time. To supplement our prevalence analyses, we have conducted a recent study to examine change over time in various adiposity measures among US adolescents. Specifically, measures we focused on included BMI, waist circumference (WC), and triceps skinfold thickness (TST) (CitationBeydoun & Wang, 2010). We used the NHANES III (1988–1994) and NHANES 1999–2004 data. As shown in , the overall means of BMI, WC, and TST increased significantly over time in adolescents (age 12–19 years), and sex differences were noted. Overweight US adolescents have gained more adiposity, especially central adiposity as reflected by WC, since the late 1980s. Our analyses indicate that solely examining changes over time in the prevalence of overweight and obesity is unable to capture such complex patterns. While yearly changes in BMI and WC increase in a linear fashion across cumulative proportion/percentile of body fat, changes in TST seem constant given its inverted U-shaped curve across the whole distribution. More effort should be made to understand the underlying causes of the differential patterns we observe in these various adiposity measures.
Figure 3. Yearly average change in BMI (kg/m2), waist circumference (WC) (cm) and triceps skinfold thickness (TST) (mm) by their percentile distributions in US adolescents: 1988–1994 to 1999–2004. OLS estimate of average yearly shift within percentile groups based on NHANES III (1988–1994) and 1999–2004 data. Adapted from CitationBeydoun & Wang (2010).
Example 2. Trends in China
Good nationally representative data collected in China has allowed the examination of national time trends in childhood obesity. Between 1992 and 2002, the prevalence of obesity and overweight nationwide increased in all gender and age groups. The combined prevalence increased by 31.7% from 3.9% in 1992 to 5.4% in 2002 in pre-school children (up to age 6), and by 17.9% from 5.7% in 1992 to 6.6% in 2002 in school-age children (7–17 years) (CitationWang et al., 2007). Additional important information has been provided by many other recent nationwide, regional and local surveys. Data from large nationwide school-based surveys showed that by 2005, the combined prevalence in urban areas reached 32.5% in boys and 17.6% in girls 7 years or older (CitationJi & Cheng, 2009), which was similar to that in some industrialized countries.
shows overall trends in prevalence based on data collected through a representative Chinese school-based cross-sectional survey series that collects health data amongst school-age children (CitationJi & Cheng, 2009). These surveys have been conducted every five years since 1985 by the Chinese National Survey on Students Constitution and Health Association. Remarkably, the combined prevalence of overweight and obesity in boys and girls has increased approximately 10-fold since the survey's start. In boys, the combined prevalence has risen more rapidly (from 2.8% in 1985 to 19.3% in 2005) than in girls (from 2.4% to 10.8%), especially in the more developed, higher SES cities of China's northern coast.
Figure 4. Trends in the prevalence (%) of overweight and obesity in Chinese school-age children, by gender: 1985–2005. Based on Chinese BMI cut-off points and data reported by Ji & Cheng (2008).
The association between SES and childhood obesity
Numerous studies published in different countries over the past three decades suggest that SES affects people's risk of developing obesity, both in adults and children (CitationMcLaren, 2007; CitationSobal & Stunkard, 1989). Overall, the current literature shows that obesity is related to SES; however, the association varies by gender, age, and country. Several comprehensive reviews have summarized findings from related studies (CitationBall & Crawford, 2005; CitationMcLaren, 2007; CitationMonteiro et al., 2004; CitationShrewsbury & Wardle, 2008; CitationSobal & Stunkard, 1989). SES may affect lifestyle, including a population's access to food and patterns of physical activity, and as a result, influence their energy balance. Many researchers have attempted to study the impact of SES on obesity risk, predominately using cross-sectional survey data collected in various population groups across different countries (CitationBeydoun & Wang., 2009; CitationMcLaren, 2007; CitationMonteiro et al., 2004; CitationPuhl & Heuer, 2009; CitationShrewsbury & Wardle, 2008; CitationSobal & Stunkard, 1989; CitationWang & Zhang, 2006; CitationZhang & Wang, 2004, Citation2007). Such studies can help us understand the population distribution and causes of obesity, as well as assist in the development of effective intervention programmes for the prevention and management of obesity.
In both industrialized and developing countries, studies suggest that SES groups with greatest access to energy-rich diets are likely to be at increased risk for obesity and overweight. Prospective studies have shown that the correlation reflects, in part, causation – SES helps to determine the prevalence of obesity and thinness. Meanwhile, the presence of obesity may influence SES as well (CitationStunkard, 1996). In general, studies show that low-SES groups in industrialized countries and high-SES groups in developing countries are at higher risk than their counterparts (CitationChen et al., 2011; CitationMurasko, 2011). The 1989 landmark comprehensive review (CitationSobal & Stunkard., 1989) summarized findings from 144 studies, and concluded then a different relationship between SES and obesity in developing and developed countries. It also noticed some gender- and age differences. Developed societies saw a consistently inverse association for women while findings for men and children were inconsistent. In developing societies, a strong positive relationship was observed for women, men, and children; there is a tendency for urban children and children in high-income families to be at increased risk for excess weight gain. Often there are also marked gender differences. Children and adolescents from advantaged backgrounds tend to be heavier than those from disadvantaged backgrounds, and the prevalence is much higher for boys than girls. The causal direction of the relationship between SES and obesity is complex.
A 2001–2002 study of adolescents from 35 countries in Europe and North America (N = 162,305) reported large international variation in the direction and magnitude of social inequality in adolescent overweight. Negative social gradients were found in most countries, but there were also a few positive social gradients, especially for boys, in some central European countries. Macroeconomic factors are associated with heterogeneity in the relationships between prevalence and social inequality in adolescent overweight. Prevalence of overweight was higher among children from less affluent families in 21 of 24 western and 5 of 10 central European countries. However, children from more affluent families were at higher risk of overweight in Croatia, Estonia and Latvia. In Poland, Lithuania, Macedonia and Finland, girls from less affluent families were more likely to be overweight while the opposite was found for boys (CitationDue et al., 2009). shows the association between prevalence of overweight and socio-economic inequality in overweight for five countries. Opposite patterns (e.g. Macedonia and Germany) are observed. Also, findings from Germany and the USA illustrate how two countries can have similar absolute socio-economic inequality in overweight but different relative inequality (CitationDue et al., 2009).
Figure 5. Association between family affluence and obesity in adolescent boys aged 11, 13 and 15 years from five countries: Example of overweight inequality regression lines. Data were collected from the Health Behavior in School-Aged Children study. Family affluence was measured as a function of family possessions (e.g. car ownership, number of computers, child had own bedroom) and number of family travels over the past year. Adapted by permission of Macmillan Publishers Ltd, International Journal of Obesity (CitationDue et al., 2009, p. 1088, ).
For US children and adolescents, we found, based on NHANES data collected between 1971 and 2002, that patterns of SES disparities in overweight varied across age, race/ethnicity and gender, and also changed over time (CitationWang & Zhang, 2006). SES disparities in overweight have decreased since the early 1990s with the rise of the obesity epidemic. A reverse association between SES and overweight was only observed in white girls; African American children of high SES were at increased risk. The differences in the prevalence of overweight by SES across sex and age groups are shown in . Overall, the prevalence of obesity in all groups has increased since the 1970s. However, there are distinct patterns across age, sex, and ethnic groups. Among boys aged 2–9 years between 1999 and 2002, a significant reverse association appeared between family income and overweight; no associations were significant among girls aged 2–9 years. A strong reverse association was also observed in adolescent boys aged 10–18 using NHANES III (1988–1994) data; although, this pattern became statistically non-significant by 1999–2002. In adolescent girls, a reverse association between family income and overweight remained significant. But, the ratio in the prevalence of overweight in the low-SES group compared with the high-SES group decreased from 3.1 in NHANES III (1988–1994) to 1.6 in NHANES 1999–2002.
Figure 6. Time trends in disparities of overweight prevalence by socio-economic status (SES) in US children and adolescents: 1971–1975 to 1999–2002. Obesity was defined as a BMI ≥ 95th percentile. The sample size in each National Health and Nutrition Examination Survey (NHANES) was: NHANES I (n = 6555), NHANES II (n = 6741), NHANES III (n = 9731), and NHANES 1999–2002 (n = 7390). Adapted by permission of the American Society for Nutrition from the American Journal of Clinical Nutrition (Youfa Wang & Qi Zhang, 2006, p. 709, ). *Significant between-group differences, P < 0.05 (chi-square tests).
In summary, there remain many controversies regarding the relationship between SES measures and obesity. A growing body of literature suggests that the SES–obesity association is complex and varies by several demographic (e.g. age, gender, ethnicity) or environmental (e.g. countries, SES) factors. With the progression of the obesity epidemic, it is possible that such associations may become weaker or even disappear in some populations (e.g. industrialized countries) or change direction in some populations (e.g. some developing countries) in the future (CitationJones-Smith et al., 2011; CitationWang & Zhang, 2006c). For example, in Brazil, the past prevalence was higher in women of higher-SES but, has become lower compared to women of lower-SES in recent years. The burden of obesity is shifting toward the poor from the rich (CitationMonteiro et al., 2007).
Discussion
In recent years, rich data, from both industrialized and developing countries, have become available and demonstrated that obesity has become one of the most serious global public health challenges of the 21st century. The combined prevalence has tripled in many countries worldwide since the 1980s and the number of people affected is expected to continue to rise for the near future. Obesity has many short- and long-term health and financial consequences for individuals, families and society. Obesity is already responsible for 2–8% of health costs and 10–13% of deaths in parts of Europe, and it is projected to be even worse in the USA, reaching 17% in 2030 (CitationWang et al., 2008).
Despite the overall high prevalence of childhood overweight and obesity around much of the world, large variations exist across regions, between countries and across population groups within countries. In general, the combined prevalence of overweight and obesity is much higher in developed countries than developing countries. For example, in 2010, the combined prevalence was 31.8% in US children and adolescents (CitationOgden et al., 2012), while it was < 5% in many developing countries (Citationde Onis et al., 2010). Nevertheless, overweight and obesity rates have been increasing dramatically in many countries and population groups. In recent years, the prevalence has increased at a much faster rate in some developing countries, such as China, compared to other industrialized countries, such as the USA. In developing countries, more urban groups and those of higher SES have suffered higher rates of overweight and obesity.
The obesity burden is huge at present, and will become worse in the future. In 2010, 43 million children (35 million in developing countries) were overweight and obese; 92 million were at risk of overweight. The global prevalence of childhood overweight and obesity increased from 4.2% in 1990 to 6.7% in 2010. Such a trend is expected to continue and the prevalence may reach 9.1% or approximately 60 million children in 2020. In developing countries, the combined prevalence was 6.1% in 2010 and may reach 8.6% in 2020. Childhood overweight and obesity have increased dramatically since 1990. It is beyond the scope of this review to examine the drivers of the current obesity epidemic in depth; however, a growing body of research identifies the important contributions of globalization and the resultant and many profound changes in society, living environments and individual behavioural patterns. Economic growth, modernization, urbanization and the globalization of food markets are additional forces. The impact of global exchanges of trade, information and culture, made possible by new information technologies, on health-related behaviours such as dietary intakes are likely considerable as well, though are not yet well understood.
Obesity is related to SES; however, the association varies by gender, age, and country. Studies in both industrialized and developing countries suggest that SES groups with greater access to energy-rich diets are more likely to be at increased risk for this condition. In general, low-SES groups in industrialized countries and high-SES groups in developing countries are at higher risk of being overweight than their counterparts. For example, a recent study showed that the prevalence of overweight was higher among children from less affluent families in 21 of 24 western and 5 of 10 central European countries compared to children from more affluent families. However, children from more affluent families were at higher risk of overweight in some countries (i.e. Croatia, Estonia and Latvia). In Poland, Lithuania, Macedonia and Finland, girls from less affluent families were more likely to be overweight while the opposite was found for boys (CitationDue et al., 2009).
Further research is needed to help better understand the many controversies regarding the relationships between SES and obesity. The current state of the literature suggests that the association between SES and obesity is complex. It varies by several demographic or environmental factors, and is bidirectional; obesity can negatively affect people's SES by limiting educational and employment opportunities. We suspect that, with the growing epidemic of obesity, the association between SES and obesity in some populations (e.g. industrialized countries) may possibly become weaker or even disappear. In some populations (e.g. some developing countries) it may instead change direction.
In conclusion, childhood obesity is a serious public threat in many industrialized and developing countries worldwide and the problem continues to grow. This epidemic situation calls for timely and effective population-based approaches to face its challenges. Overweight and obesity, as well as other lifestyle-related chronic diseases, are largely preventable. However, once developed, obesity is difficult to cure. Obesity has many health and financial consequences to individuals, their families and society at large. Therefore, prevention of childhood obesity should take high national priority in many countries. The development of new national and regional policies along with effective population-based intervention programmes for the prevention and management of obesity in children and adolescents are crucial to combat the growing epidemic of obesity and obesity-related non-communicable chronic diseases around the world.
Acknowledgement
We thank Dorothy Chiu for helping improve the manuscript.
Declaration of interest: This work is supported in part by research grants from the Eunice Kennedy Shriver National Institute of Child Health and Human Development (NICHD) and the US Office of Behavioral and Social Sciences Research (OBSSR, 1U54 HD070725-01), and the US National Institute of Diabetes and Digestive and Kidney Diseases (NIDDK, R01DK81335-01A1). The authors alone are responsible for the content and writing of the paper.
References
- Ahrens, W., Moreno, L.A. & Pigeot, I. (2011). Childhood obesity: Prevalence worldwide. In L.A. Moreno (Ed.), Epidemiology of Obesity in Children and Adolescents (pp. 219–235). New York: Springer.
- Ball, K. & Crawford, D. (2005). Socioeconomic status and weight change in adults: A review. Social Science and Medicine, 60, 1987–2010. doi:S0277 - 9536(04)00467-8
- Beydoun, M.A. & Wang, Y. (2009). Gender-ethnic disparity in BMI and waist circumference distribution shifts in US adults. Obesity, 17, 169–176. doi:10.1038/oby.2008.492
- Beydoun, M.A. & Wang, Y. (2010). Socio-demographic disparities in distribution shifts over time in various adiposity measures among American children and adolescents: What changes in prevalence rates could not reveal. International Journal of Pediatric Obesity, 6, 21–35. doi:10.3109/17477166.2010.488693
- Chen, T.J., Modin, B., Ji, C.Y. & Hjern, A. (2011). Regional, socioeconomic and urban-rural disparities in child and adolescent obesity in China: A multilevel analysis. Acta Paediatrica, 100, 1583–1589. doi:10.1111/j.1651-2227.2011.02397.x
- Cole, T.J., Bellizzi, M.C., Flegal, K.M. & Dietz, W.H. (2000). Establishing a standard definition for child overweight and obesity worldwide: International survey. British Medical Journal, 320, 1240–1243.
- de Onis, M., Blossner, M. & Borghi, E. (2010). Global prevalence and trends of overweight and obesity among preschool children. American Journal of Clinical Nutrition, 92, 1257–1264. doi:10.3945/ajcn.2010.29786
- de Onis, M., Onyango, A.W., Borghi, E., Siyam, A., Nishida, C. & Siekmann, J. (2007). Development of a WHO growth reference for school-aged children and adolescents. Bulletin of the World Health Organization, 85, 660–667. doi:S0042 - 96862007000900010
- Dietz, W.H. (1998). Health consequences of obesity in youth: Childhood predictors of adult disease. Pediatrics, 101, 518–525.
- Due, P., Damsgaard, M.T., Rasmussen, M., Holstein, B.E., Wardle, J., Merlo, J., … Valimaa, R. (2009). Socioeconomic position, macroeconomic environment and overweight among adolescents in 35 countries. International Journal of Obesity, 33, 1084–1093. doi:10.1038/ijo.2009.128
- Guillaume, M. (1999). Defining obesity in childhood: Current practice. American Journal of Clinical Nutrition, 70, 126S–130S.
- IASO (2011). Global childhood overweight. International Association for the Study of Obesity. http://www.iaso.org/site_media/uploads/Global_Childhood_Overweight_September_2011.pdf
- IOTF (2007). Worldwide prevalence of obesity. International Obesity Task Force. http://www.iotf.org
- Jackson-Leach, R. & Lobstein, T. (2006). Estimated burden of paediatric obesity and co-morbidities in Europe. Part 1. The increase in the prevalence of child obesity in Europe is itself increasing. International Journal of Pediatric Obesity, 1, 26–32.
- Janssen, I., Katzmarzyk, P.T., Boyce, W.F., Vereecken, C., Mulvihill, C., Roberts, C., … Pickett, W. (2005). Comparison of overweight and obesity prevalence in school-aged youth from 34 countries and their relationships with physical activity and dietary patterns. Obesity Reviews, 6, 123–132. doi:10.1111/ j.1467 - 789X.2005.00176.x
- Ji, C.Y., Working Group on Obesity in China. (2005). Report on childhood obesity in China (1)–body mass index reference for screening overweight and obesity in Chinese school-age children. Biomedical and Environmental Sciences, 18, 390–400.
- Ji, C.Y. & Cheng, T.O. (2009). Epidemic increase in overweight and obesity in Chinese children from 1985 to 2005. International Journal of Cardiology, 132, 1–10. doi:10.1016/j.ijcard.2008.07.003
- Jones-Smith, J.C., Gordon-Larsen, P., Siddiqi, A. & Popkin, B.M. (2011). Cross-national comparisons of time trends in overweight inequality by socioeconomic status among women using repeated cross-sectional surveys from 37 developing countries, 1989–2007. American Journal of Epidemiology, 173, 667–675. doi:10.1093/aje/kwq428
- Kuczmarski, R.J., Ogden, C.L., Grummer-Strawn, L.M., Flegal, K.M., Guo, S.S., Wei, R., … Johnson, C.L. (2000). CDC growth charts: United States. Advance Data, 1–27.
- McLaren, L. (2007). Socioeconomic status and obesity. Epidemiologic Reviews, 29, 29–48. doi:10.1093/epirev/mxm001
- Moon, J. S., Lee, S. Y., Nam, C. M., Choi, J. M., Choe, B. K., Seo, J. W., … Lee, C. G. (2008). 2007 Korean national growth charts: review of developmental process and an outlook. Korean Journal of Pediatrics, 51, 1–25.
- Monteiro, C.A., Conde, W.L. & Popkin, B.M. (2007). Income-specific trends in obesity in Brazil: 1975–2003. American Journal of Public Health, 97, 1808–1812. doi:10.2105/AJPH.2006.099630
- Monteiro, C.A., Moura, E.C., Conde, W.L. & Popkin, B.M. (2004). Socioeconomic status and obesity in adult populations of developing countries: A review. Bulletin of the World Health Organization, 82, 940–946. doi:S0042 - 96862004001200011
- Murasko, J.E. (2011). Trends in the associations between family income, height and body mass index in US children and adolescents: 1971–1980 and 1999–2008. Annals of Human Biology, 38, 290–306. doi:10.3109/03014460.2010.537698
- Must, A., Dallal, G.E. & Dietz, W.H. (1991). Reference data for obesity: 85th and 95th percentiles of body mass index (wt/ht2) and triceps skinfold thickness. American Journal of Clinical Nutrition, 53, 839–846.
- Must, A. & Strauss, R.S. (1999). Risks and consequences of childhood and adolescent obesity. International Journal of Obesity and Related Metabolic Disorders, 23, S2–11.
- Ogden, C.L., Carroll, M.D., Curtin, L.R., Lamb, M.M. & Flegal, K.M. (2010). Prevalence of high body mass index in US children and adolescents, 2007–2008. Journal of the American Medical Association, 303, 242–249. doi:10.1001/jama.2009.2012
- Ogden, C.L., Carroll, M.D., Kit, B.K. & Flegal, K.M. (2012). Prevalence of obesity and trends in body mass index among US children and adolescents, 1999–2010. Journal of the American Medical Association, 307, 483–490. doi:10.1001/jama.2012.40
- Puhl, R.M. & Heuer, C.A. (2009). The stigma of obesity: A review and update. Obesity, 17, 941–964. doi:10.1038/oby.2008.636
- Shan, X.Y., Xi, B., Cheng, H., Hou, D.Q., Wang, Y. & Mi, J. (2010). Prevalence and behavioral risk factors of overweight and obesity among children aged 2–18 in Beijing, China. International Journal of Pediatric Obesity, 5, 383–389. doi:10.3109/ 17477160903572001
- Shrewsbury, V. & Wardle, J. (2008). Socioeconomic status and adiposity in childhood: A systematic review of cross-sectional studies 1990–2005. Obesity, 16, 275–284. doi:10.1038/oby.2007.35
- Sobal, J. & Stunkard, A.J. (1989). Socioeconomic status and obesity: A review of the literature. Psychological Bulletin, 105, 260–275.
- Song, Y., Park, M. J., Paik, H. Y., Joung, H. (2010). Secular trends in dietary patterns and obesity-related risk factors in Korean adolescents aged 10–19 years. International journal of obesity (Lond), 34, 48–56.
- Stunkard, A.J. (1996). Socioeconomic status and obesity. Ciba Foundation Symposium, 201, 174–182; discussion 182–177, 188–193.
- Tremblay, M.S., Katzmarzyk, P.T. & Willms, J.D. (2002). Temporal trends in overweight and obesity in Canada, 1981–1996. International Journal of Obesity and Related Metabolic Disorders, 26, 538–543.
- Wang, Y. (2004). Epidemiology of childhood obesity – Methodological aspects and guidelines: What is new? International Journal of Obesity and Related Metabolic Disorders, 28, S21–28. doi:10.1038/sj.ijo.0802801
- Wang, Y. & Beydoun, M.A. (2007). The obesity epidemic in the United States – Gender, age, socioeconomic, racial/ethnic, and geographic characteristics: A systematic review and meta-regression analysis. Epidemiologic Reviews, 29, 6–28. doi:10.1093/epirev/mxm007
- Wang, Y., Beydoun, M.A., Liang, L., Caballero, B. & Kumanyika, S.K. (2008). Will all Americans become overweight or obese? Estimating the progression and cost of the US obesity epidemic. Obesity, 16, 2323–2330. doi:10.1038/oby.2008.351
- Wang, Y., Chen, H.J., Shaikh, S. & Mathur, P. (2009). Is obesity becoming a public health problem in India? Examine the shift from under- to overnutrition problems over time. Obesity Reviews, 10, 456–474. doi:10.1111/j.1467-789X.2009.00568.x
- Wang, Y. & Lobstein, T. (2006). Worldwide trends in childhood overweight and obesity. International Journal of Pediatric Obesity, 1, 11–25.
- Wang, Y., Mi, J., Shan, X.Y., Wang, Q.J. & Ge, K.Y. (2007). Is China facing an obesity epidemic and the consequences? The trends in obesity and chronic disease in China. International Journal of Obesity, 31, 177–188. doi:10.1038/sj.ijo.0803354
- Wang, Y., Moreno, L.A., Caballero, B. & Cole, T.J. (2006). Limitations of the current world health organization growth references for children and adolescents. Food and Nutrition Bulletin, 27, S175–188.
- Wang, Y. & Wang, J.Q. (2002). A comparison of international references for the assessment of child and adolescent overweight and obesity in different populations. European Journal of Clinical Nutrition, 56, 973–982. doi:10.1038/sj.ejcn.1601415
- Wang, Y. & Zhang, Q. (2006). Are American children and adolescents of low socioeconomic status at increased risk of obesity? Changes in the association between overweight and family income between 1971 and 2002. American Journal of Clinical Nutrition, 84, 707–716. doi:84/4/707
- WHO (1995). Physical status: The use and interpretation of anthropometry. Report of a WHO Expert Committee. World Health Organization Technical Report Series, 854, 1–452.
- WHO (2000). Obesity: Preventing and managing the global epidemic. Report of a WHO consultation. World Health Organization Technical Report Series, 894, i–xii, 1–253.
- WHO (2006). The WHO Child Growth Standards. http://www.who.int/childgrowth/en/
- WHO (2009). Obesity and overweight. http://www.who.int/mediacentre/factsheets/fs311/en/
- WHO (2010). Childhood overweight and obesity. http://www.who.int/dietphysicalactivity/childhood/en
- Willms, J.D., Tremblay, M.S. & Katzmarzyk, P.T. (2003). Geographic and demographic variation in the prevalence of overweight Canadian children. Obesity Research, 11, 668–673. doi:10.1038/oby.2003.95
- Zhang, Q. & Wang, Y. (2004). Trends in the association between obesity and socioeconomic status in U.S. adults: 1971 to 2000. Obesity Research, 12, 1622–1632. doi:10.1038/oby.2004.202
- Zhang, Q. & Wang, Y. (2007). Using concentration index to study changes in socio-economic inequality of overweight among US adolescents between 1971 and 2002. International Journal of Epidemiology, 36, 916–925. doi:10.1093/ije/dym064