Abstract
It is believed that in regulated exocytosis the vesicle membrane fuses with the plasma membrane in response to a physiological stimulus. However, in the absence of stimulation, repetitive transient fusion events are also observed, reflecting a stable state. The mechanisms by which the initial fusion pore attains stability are poorly understood. We modelled energetic stability of the fusion pore by taking into account the anisotropic, intrinsic shape of the membrane constituents and their in-plane ordering in the local curvature of the membrane. We used cell-attached membrane capacitance techniques to monitor the appearance and conductance of single fusion pore events in cultured rat lactotrophs. The results revealed a bell-shaped distribution of the fusion pore conductance with a modal value of 25 pS. The experimentally observed increase of the fusion pore stability with decreasing fusion pore radius agrees well with the theoretical predictions. Moreover, the results revealed a correlation between the amplitude of transient capacitance increases and the fusion pore conductance, indicating that larger vesicles may attain a stable fusion pore with larger fusion pore diameters.
Introduction
Membrane fusion is an essential event in many biological processes of eukaryotic cells [Citation1,Citation2] as for instance in the vesicular release of hormones and neurotransmitters. This process is thought to begin with the formation of a hemi-fusion stalk, an intermediate structure connecting the outer leaflets of fusing membranes (reviewed in [Citation3]). The hemi-fusion stalk then proceeds into a fusion pore, an aqueous channel connecting a spherical vesicle and the nearly ‘flat’ plasma membrane, through which cargo molecules diffuse from the vesicle lumen into the cell exterior. After formation, the fusion pore either closes and allows the vesicle to be reused in another round of exocytosis (transient or kiss-and-run exocytosis [Citation4]), or it fully opens, leading to a complete merger of the vesicle membrane with the plasma membrane (full fusion exocytosis [Citation5]). Rapid fusion pore openings and closures lasting from a few milliseconds (i.e., fusion pore flickering [Citation6]) to some minutes before complete expansion or closure of the pore have also been observed, sometimes exhibiting remarkable rhytmicity (‘the pulsing pore’ [Citation7,Citation8]). The fusion pore diameter is considered initially stable and narrow [Citation9,Citation10], which subsequently increases upon stimulation and therefore greatly facilitates the release of vesicle cargo molecules [Citation11,Citation12].
The understanding of mechanisms underlying the energetics and stability of fusion pores is fragmentary. Some acknowledged mechanisms consider formation of the pore energetically unfavourable by an argument that the repulsive electrostatic forces between two closely apposed phospholipid bilayers need to be overcome in order to reach the metastable transition states leading to fusion pore formation [Citation13]. In regulated exocytosis, SNARE (soluble N-ethylmaleimide-sensitive factor attachment protein receptor [Citation14]) proteins were suggested to reduce the energy barrier of the fusion pore formation [Citation15,Citation16]. It was indicated that without stabilizing factors fusion pores would spontaneously close or widen swiftly and irreversibly after their formation [Citation17]. On the other hand, repetitive fusion events of the same vesicle which have been reported even at resting conditions [Citation7,Citation8], indicate some stability between the interacting vesicle and plasma membrane.
The interpretation of fusion pore dynamics by SNARE-mediated mechanisms is further complicated by the discovery that changing vesicle size affects its fusion pore [Citation18]. In addition to proteins, negatively charged lipid molecules have been shown to strongly affect the probability of exocytosis [Citation19]. Thus, to understand how these complex mechanisms affect the fusion pore dynamics, we need to have a model which will describe in the first place the stability of the initially formed fusion pore, and then to predict how interacting molecules (proteins and/or lipids) mediate changes in pore stability leading to enlargement of the fusion pore diameter. Such a model should take into account high curvatures in the region of the fusion pore, as well as the specific shape of molecules in highly curved regions [Citation20,Citation21].
Recently, a theory was developed, describing stability of different types of membranous nanostructures, such as dimeric detergent-induced membrane nanotubes [Citation22,Citation23], nanotubes of giant unilamellar vesicles [Citation24], cell membrane pores [Citation25], narrow necks connecting daughter vesicles with parent membrane [Citation20,Citation26] and inverted hexagonal phospholipid phases [Citation21,Citation27]. It can be noted that in these structures the difference between the two principal membrane curvatures C1 and C2 (see for definition of C1 and C2) is very high, reaching the regime where the anisotropic intrinsic shape of the membrane constituents becomes locally and globally important [Citation22,Citation23,Citation28,Citation29]. The theory takes into account that a membrane constituent is in general asymmetric with respect to the axis perpendicular to the membrane, which means that different in-plane orientations of the constituent in the membrane would yield considerably different energies. Consequently, the constituent would spend on average more time in the orientation that is energetically more favorable, i.e., the average orientation of the anisotropic membrane constituent depends on the difference between the membrane principal curvatures C1 and C2.
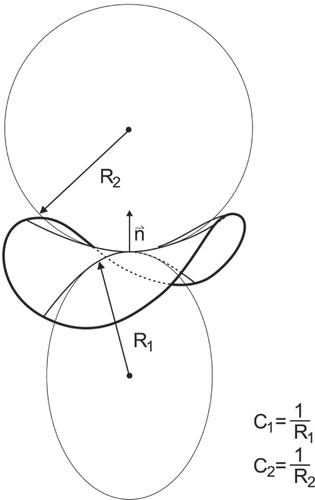
Figure 1. Principal membrane curvatures. Schematic presentation of the two principal membrane curvatures C1 and C2 (for the case of saddle-like membrane shape) defined in the origin of the membrane normal n. The principal curvatures C1 and C2 are inversely proportional to principal radii of curvatures R1 and R2, respectively. The principal radii of curvatures R1 and R2 are the maximal and the minimal radii of curvature of the curves defined by the cross-section of the normal plane with the membrane neutral plane.
Furthermore, in multicomponent membranes, lateral redistribution of components takes place, representing a degree of freedom of the system which may additionally contribute to a decrease of the membrane free energy [Citation20,Citation30–33]. It should be stressed at this point that considering the average orientational ordering of anisotropic membrane components (which may be single molecules or small membrane nanodomains) does not assume lattice-like packing of these components with fixed orientation and fixed position of membrane constituents but just takes into account the possibility of a decrease of the membrane free energy due to the average orientation and position of laterally mobile rotating anisotropic membrane constituents (lipids, proteins or nanodomains).
In this paper we studied repetitive fusion pore events in resting lactotrophs by using cell-attached patch-clamp capacitance and fusion pore conductance measurements as well as a mathematical modelling of the fusion pore. Within the theoretical model we described the system with the fusion pore as a multicomponent closed membrane with a small endovesicle connected to the inner surface of the target membrane by a membranous neck. We considered that the fusion pore has the same characteristics as the systems that were previously successfully described by the same mechanism and formalism [Citation23–29] and was therefore used to describe the fusion pore. This mechanism, which is the focus of our work is non-specific and relates only to in-plane anisotropy of intrinsic shapes of the membrane constituents (molecules or clusters of molecules) and interactions between the membrane constituents. The intrinsic shapes and the local interactions in turn depend on the local membrane curvature. The free energy of the system, considering the effects of positional and orientational distribution of membrane constituents in both membrane layers, was minimized within the sequence of calculated closed shapes with an endovesicle simulating narrowing of the neck connecting the vesicle and the cell membrane. The shape corresponding to the configuration with minimal free energy was considered as the equilibrium shape attained by the model system. The diameter of the pore, corresponding to the minimum of the free energy, was estimated and compared with respective experimental results. Moreover, the experimentally observed relationship between vesicle size and stable fusion pore diameter was found to correspond well with previously published observations. Physiological consequences of these novel principles in fusion pore stability are discussed.
Materials and methods
Cell preparation
Lactotrophs were isolated from adult male Wistar rat anterior pituitaries by the standard method [Citation34]. Cells were plated on poly-L-lysinated glass coverslips, and stored at 37°C, 92% humidity and 8% CO2. Experiments were carried out at room temperature 1–4 days after the isolation.
Euthanization of animals was in accordance with the following ethical codes and directives: International Guiding Principles for Biomedical Research Involving Animals developed by the Council for International Organizations of Medical Sciences and the Directive on Conditions for Issue of License for Animal Experiments for Scientific Research Purposes (Official Gazette of the Republic of Slovenia 40/85 and 22/87).
Immunocytochemistry
Lactotrophs were fixed with 4% paraformaldehyde and permeabilized with 0.1% Triton X-100; nonspecific sites were blocked with 3% bovine serum albumin and 10% goat serum. Prolactin was detected by incubating lactotrophs with rabbit anti-prolactin polyclonal antibodies (1:80; Chemicon) in combination with secondary Alexa Fluor546-conjugated anti-rabbit IgG antibodies (1:500; Molecular Probes). Before confocal microscopy, cells were treated with Slow Fade Light Antifade Kit (Molecular Probes). Immunolabelled cells were analyzed with an inverted Zeiss LSM 510 confocal microscope with an oil immersion plan apochromatic objective (60x, 1.4 NA) using 488-nm Ar-Ion laser excitation. Emission spectra were acquired with a 563-nm long-pass emission filter.
Electrophysiology
Cells were patch clamped and their membrane capacitance (CM) was measured by using the compensated cell-attached technique. Measurements were performed with a dual-phase lock-in patch-clamp amplifier (SWAM IIC, Celica, Ljubljana, Slovenia). A 10 kHz sine wave (111 mV r.m.s.) was superimposed on a command potential of 0 mV. We used fire-polished thick-wall pipettes (2 to 5 MΩ) heavily coated with Sylgard and low surface level of bath solution (200 μl per coverslip) to reduce the slow drift of the real (Re) and imaginary (Im) part of the admittance signal.
The bath and the pipette contained standard saline solution (10 mM HEPES/NaOH (pH 7.2), 10 mM D-glucose, 130 mM NaCl, 8 mM CaCl2, 1 mM MgCl2, and 5 mM KCl). During the measurements the phase setting of the lock-in amplifier was adjusted to nullify the changes in the Re signal in response to 10 fF calibration steps [Citation35,Citation36]. It was confirmed previously [Citation37] that for the frequencies of the sine-wave stimulation used (up to ∼20 kHz), the phase determination by the capacitance dithering provides a suitable calibration value. The criteria of correct phase setting were as described [Citation35,Citation38,Citation39]. Transient fusion events with narrow fusion pores reduce Im signal by producing the proportional increase in the Re [Citation10]. Accordingly, Cv (vesicle capacitance) and Gp (fusion pore conductance) were calculated from Im and Re as reported previously [Citation10]; Cv = [(Re2 + Im2)/Im]/ω, Gp = (Re2 + Im2)/Re), where ω denotes angular frequency (ω = 2пf, f is the sine-wave frequency, f = 1591 Hz). Fusion pore diameter was calculated by using the following equation: Gp = (πr2)/(ρλ), where r is the fusion pore radius, ρ saline resistivity and λ the length of a fusion pore. We assumed the pore to be filled with the standard bath solution with the resistivity (ρ) of the saline 100 Ω cm. According to the model (), the length of the fusion pore (λ) is considered to increase linearly in proportion with the vesicle size (if the diameter of the vesicle is doubled, the length of the fusion pore is doubled as well). For the starting point we determined that the smallest observed vesicle (198 nm in diameter) has a fusion pore length of 13 nm (thickness of the plasma and the vesicle membranes combined, comparable to the length of the gap junction channel [Citation9]). Vesicle diameters were calculated assuming spherical geometry and by using specific membrane capacitance (cM) of 8 fFμm-2.
Transient events were analyzed in the home-made software (CellAn, Celica, Slovenia) written for MATLAB (Math Works, Natick, MA, USA) on PC computers. We considered an event to be detectable, if the signal to noise ratio (SNR) was at least 3:1.
All statistics are in the format of mean ± standard error of the mean (SEM). Differences between samples were tested with Student's t-test, considering p < 0.05 (*). All chemicals were from Sigma-Aldrich.
Theoretical consideration: anisotropic membrane constituents as a possible stabilizing factor of the open fusion pores
The membrane is considered as a pair of coupled monolayers composed of different constituent species. Our theoretical analysis was limited to the case where fusion vesicles are depleted of membrane skeleton (see for example [Citation40]). In determining the shape of the system, the membrane is considered as a pair of coupled curved monolayers composed of different constituent species and described by a membrane surface. The curvature of the membrane surface at a given point is determined by the two principal curvatures C1 = 1/R1 and C2 = 1/R2 where R1 and R2 are the two principal curvature radii, and the corresponding principal axes system (). In calculating the energy, however, the two membrane monolayers are considered separately, the outer layer having a larger area than the inner layer. The sign of the principal curvatures of the outer membrane layer is equal to the sign of the curvature of the membrane surface, while the sign of the curvatures of the inner surface is opposite to the sign of the curvature of the membrane surface. As the curvature radii in the endovesicle are due to in certain regions of the membrane approaching the membrane thickness, we have considered that the principal curvatures of the outer layer are C1,out = 1/(R1+tout), C2,out = 1/(R2+tout) while the principal curvatures of the inner layer are C1,in = −1/(R1+tin), C2,in = −1/(R2+tin), where tout and tin are the respective distances between the membrane surface and the midplane of the outer and the inner membrane layer. It was taken that tout = 1.25 nm and tin = −1.25 nm.
It is taken that a membrane constituent, due to its structure and local interactions energetically prefers a particular local curvature given by intrinsic principal curvatures C1m,i and C2m,i (see Supplementary Figures A1 and A2 in the Appendix A, online version only), where i denotes the constituent species. In general, the two intrinsic principal curvatures differ from each other (C1m,i ≠ C2m,i) and the constituent is called anisotropic [Citation20–22], while in a special case when the intrinsic curvatures are equal (C1m,i = C2m,i) it is called isotropic [Citation41,Citation42]. Membrane constituents can be small molecules, e.g., phospholipids [Citation22,Citation24,Citation26], larger molecules (also called inclusions) [Citation20,Citation43] or complexes of molecules [Citation29,Citation44]. Phospholipid molecules, for example, are composed of a hydrophilic head group and (usually) two hydrophobic tails. Two hydrocarbon tails give the lipid molecule an intrinsically anisotropic shape with respect to its axis perpendicular to the membrane surface [Citation21,Citation24,Citation27], moreover, the headgroups may also contribute to the anisotropy of the lipid molecule ([Citation22,Citation23,Citation28,Citation45] and references therein).
When the constituent is inserted into the membrane at a point with given principal curvatures and the corresponding principal axes system, both, the membrane surrounding and the constituent should be adjusted to fit the constituent into the membrane. The energy which is spent for this purpose reflects the mismatch of the principal curvatures and the intrinsic principal curvatures as well as the in-plane rotation of the principal axes systems.
Different in-plane orientations of the constituent are energetically nonequivalent and it is assumed that while undergoing perpetual motion the constituent, positioned at a point where C1,j differs from C2,j, j = out, in, will spend more time in the orientation which is energetically more favorable [Citation22,Citation28]. Moreover, as the membrane constituents are considered as laterally mobile, a certain species of the constituents will accumulate at the regions of favourable curvature and will be depleted from regions of unfavourable curvature. Taking into account the statistical averaging at the given temperature, it can be interpreted that anisotropic constituents undergo average orientational ordering in strongly anisotropic curvature field of the membrane layer. It was previously shown that lateral and average orientational ordering of the membrane constituents which is coupled to the membrane curvature (shape) represents the mechanism for stabilization of strongly anisotropically curved membranous structures [Citation20–22,Citation24,Citation25,Citation30,Citation31,Citation33,Citation46]. The fusion pore is a strongly anisotropically curved membranous structure, therefore we used the afore-mentioned mechanism and formalism to describe the fusion pore stability.
It was assumed that in the equilibrium, the membrane will attain the configuration (consistently related lateral and average orientational distribution and shape) corresponding to the minimum of the free energy of the system. In the model, each of the membrane layers was taken to contain isotropic constituents (type 1) and anisotropic constituents (type 2) which were free to redistribute laterally over a lattice with equal lattice sites. We described this degree of freedom by the local relative area densities of the species, namely m1,j and m2,j = 1 – m1,j, where the indexes 1 and 2 denote the respective types of constituents and the index j denotes the inner (j = in) and the outer membrane layer (j = out). To derive the energy of the membrane, the monolayer area was divided into small patches of constant curvature, which however contained a large number of constituents so that the methods of the statistical physics could be applied. The direct interaction between constituents was taken into account within the Bragg-Williams approximation (quadratic in m2,j, j = out, in). The free energy of each membrane layer (Fj, j = out, in) thus contains contributions of all membrane constituents of both types, their configurational entropy and the contribution of the direct interactions between anisotropic constituents,
where fi,j is the free energy of the i-th membrane constituent in the j-th layer (see Supplementary Appendix A):
Hj = (C1,j + C2,j)/2, and Dj = |C1,j - C2,j|/2, j = out, in are the mean curvature and the curvature deviator of the respective layers, Hm,i = (C1m,i + C2m,i)/2 and Dm,i = ∣C1m,i - C2m,i∣/2 are the intrinsic mean curvature and the intrinsic curvature deviator corresponding to the i-th kind of membrane constituents, Ki and Ki are the constants describing the mismatch of the actual and the intrinsic curvature tensors for the constituents of the i-th kind, I0 is the modified Bessel function, k is the Boltzmann constant, T is the temperature, w is the constant of the short-range direct interaction between constituents of type 2 (in units of kT), Z2 is the number of the neighbouring molecules involved in the direct interactions [Citation47], m0 is the area density of the number of lattice sites and dA is the area element (also Supplementary Appendix A).
To obtain the equilibrium configuration of the system (i.e., configuration of small vesicle fused with the larger closed membrane surface) for a particular choice of the model parameters, the membrane shape corresponding to the lowest total membrane free energy F = Fin + Fout (see Eq.1) was determined together with the corresponding equilibrium lateral and orientational distribution (Supplementary Appendix B) of membrane constituents. The minimization of the membrane free energy F = Fin + Fout was performed numerically. A sequence of axisymmetric shapes of a closed membranous structure with a small endovesicle (simulating the fusion of the vesicle with the membrane) at different values of the relative average mean curvature of the cell membrane 〈h〉 = 1/A ∫ H dA (see , lower panel), i.e., at different fusion pore diameters, was generated by minimization of the membrane isotropic bending energy at constant area of the membrane A = 4 Π R02 and constant enclosed volume V = 4 Π R03/3 [Citation20]. Here we take into account that in the vicinity of the limiting shapes composed of two spheres connected by an infinitesimal neck (i.e., by infinitesimal fusion pore) the membrane shape is predominantly determined by the geometrical constraints so the effect of the particular choice of the energy of the system does not affect the shape at given 〈h〉 but only the equilibrium shape corresponding to minimal membrane energy [Citation28].
Results
Membrane associated vesicles and fusion pore openings in resting lactotrophs
Vesicle membrane fuses with the plasma membrane in response to a physiological stimulus, such as the increase in free intracellular calcium (reviewed in [Citation48]). Vesicles are thought to be delivered to specific docking sites at the plasma membrane, such as the active zones in neurons [Citation49]. Pituitary cells are devoid of such structures, but numerous vesicles appear to be fused with the plasma membrane at distinct sites upon stimulation [Citation50,Citation51]. Hence, vesicles are considered to be not far from the plasma membrane before stimulation. To verify that prolactin-containing vesicles are located at the plasma membrane in resting lactotrophs even prior to stimulation, we immunostained resting lactotrophs with anti-prolactin antibodies. The punctuate distribution of anti-prolactin red fluorescence signals (Alexa Fluor546 red fluorescence antibody) near the plasma membrane of a lactotroph () indicates that a significant number of prolactin vesicles is already located at the plasma membrane at rest, before stimulation, consistent with previous reports [Citation7,Citation8].
Figure 2. Prolactin vesicles residing at the plasma membrane in resting lactotrophs undergo repetitive transient exocytosis with narrow fusion pores. (a) Confocal image of vesicles containing prolactin visualized by anti-prolactin antibody and fluorescent secondary antibody (Alexa546). Note several bright fluorescent spots at cell perimeter, each likely representing immunolabelled prolactin vesicle at the cell plasma membrane of a resting lactotroph. Scale bar = 5 μm. (b) Representative cell-attached patch-clamp recordings of a resting lactotroph. On- and off-steps in Im traces are taken from a burst. (i) Note that the crosstalk between the Im and Re trace occurs with one event only (arrow). (ii) The crosstalk between Im and Re appears in all but one fusion pore event with higher amplitude (arrow). Calibration pulses (asterisks) do not exhibit projections to the Re trace, thus indicating correct phase angle setting. The crosstalk between the Im and Re traces indicates a narrow fusion pore.
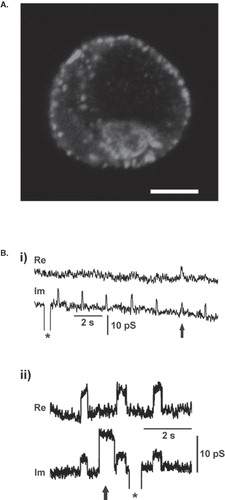
Cell-attached recordings from 33 lactotrophs, with a total duration of 11,750 s (mean duration of 356 s), revealed spontaneous discrete increases in membrane capacitance (CM) in 11 lactotrophs ( and ), as reported [Citation7,Citation8]. Discrete increases in CM represent single vesicle fusion with the plasma membrane [Citation38]. In this study we were interested only in CM step increases followed by step decreases within a few seconds. Since the amplitudes of both steps were similar (data not shown), these events are considered to represent the formation of a transient fusion pore [Citation8,Citation38]. Moreover, we were interested in the events that exhibited a measurable fusion pore conductance (n = 749), which is seen as a projection between the Im (proportional to CM) and the Re part of admittance signals [Citation52]. In (i) it is shown that the majority of fusion events (n =126 in this particular recording) exhibit no projection between the Im the Re part of the admittance signal. Only 21 events exhibited a significant projection, indicating that the fusion pore reopens to a relatively stable fusion pore structure. On the other hand (ii) shows a recording with repetitive transient fusion events (a total of 184 events) to a smaller amplitude with a significant projection to the Re part of the admittance signal and one transient event with a larger amplitude (arrow; total in this patch 9) in the Im trace, which is devoid of the projection to the Re part of the admittance signal. In both cases repetitive transient fusion pore events indicate relatively stable fusion pore structures. The occurrence of events with a significant crosstalk between the Im and the Re part of the admittance signal was ∼ 35% of all transient fusion events, which is consistent with previous observations [Citation8]. In these events vesicle capacitance (Cv) and fusion pore conductance (Gp) were calculated from the Im and Re admittance signals, as reported ([Citation52]; see Materials and Methods; ).
Although, exocytotic fusion pores were hitherto believed as energetically unfavourable in the absence of specific stabilizing factors [Citation53], repetitive fusion pore events in resting lactotrophs (; [Citation7,Citation8]) indicate that the open pore is energetically favourable and likely entrapped in an energy minimum. Therefore we next considered the nature of a stable fusion pore, a highly complex curved structure in which anisotropic membrane constituents may play a stabilizing role (Material and Methods, Supplementary Appendix A, B).
First we calculated a sequence of axysymmetric shapes at different values of the average mean curvature to capture the shapes at which the fusion pore narrows and the free energy of these shapes with the corresponding lateral distribution of membrane constituents. shows that the relative area density of anisotropic membrane constituents of type 2 (m2 = m2,in + m2,out) (see Materials and Methods) is increased in the membrane region of the fusion pore which connects the vesicle with the plasma membrane. Note that m2 is constant in the spherical parts of the vesicle. The same is true also for m2,in and m2,out (not shown in the figure) which is an expected result since in the spherical membrane regions of the vesicle C1 ≈ C2 ≈ const. and therefore D = |C1 − C2|/2 ≈ 0.
Figure 3. Stable configuration of the fusion pore (vesicle fused to the plasma membrane) as a function of the fusion pore diameter and intrinsic anisotropy of the membrane constituents. (A) The sum of the relative area densities of the anisotropic (type 2) membrane constituents (m2 = m2,1 + m2,2) in both membrane monolayers, shown for three different vesicle shapes (see panel below) of 300 nm in diameter fused to the inner membrane surface. Anisotropic membrane constituents have C1m,2 ≈ 0 and C2m,2 = −1/3 nm−1 which corresponds to Hm,2 = −Dm,2 = −1/6 nm−1. (B) Free energy of the two component bilayer membrane (ΔF) as a function of the fusion pore diameter (Δ) calculated for different values of the intrinsic curvature deviator of the anisotropic (type 2) membrane constituents in the membrane bilayer Hm,2 = −Dm,2: −1/5.75 nm−1 (a), −1/6 nm−1 (b), −1/6.2 nm−1 (c), −1/6.5 nm−1 (d). Arrows show the values of Δ(nm) corresponding to the shapes presented in panel A. (C) The calculated equilibrium fusion/pore diameter (Δeq), corresponding to the minimum of ΔF (see panel B) as a function of the anisotropy Dm,2 = |Hm,2| (see Supplementary Appendix A and Materials and Methods). Note that on the left side of the vertical dotted line, the local minimum of ΔF does not exist (see curve (d) in panel B). Values of the model parameters are: Hm,1 = Dm,1 = 0, K1 = 10 kT nm2 [Citation21,Citation28], K2 = 100 kT nm2, ![]()
![Figure 3. Stable configuration of the fusion pore (vesicle fused to the plasma membrane) as a function of the fusion pore diameter and intrinsic anisotropy of the membrane constituents. (A) The sum of the relative area densities of the anisotropic (type 2) membrane constituents (m2 = m2,1 + m2,2) in both membrane monolayers, shown for three different vesicle shapes (see panel below) of 300 nm in diameter fused to the inner membrane surface. Anisotropic membrane constituents have C1m,2 ≈ 0 and C2m,2 = −1/3 nm−1 which corresponds to Hm,2 = −Dm,2 = −1/6 nm−1. (B) Free energy of the two component bilayer membrane (ΔF) as a function of the fusion pore diameter (Δ) calculated for different values of the intrinsic curvature deviator of the anisotropic (type 2) membrane constituents in the membrane bilayer Hm,2 = −Dm,2: −1/5.75 nm−1 (a), −1/6 nm−1 (b), −1/6.2 nm−1 (c), −1/6.5 nm−1 (d). Arrows show the values of Δ(nm) corresponding to the shapes presented in panel A. (C) The calculated equilibrium fusion/pore diameter (Δeq), corresponding to the minimum of ΔF (see panel B) as a function of the anisotropy Dm,2 = |Hm,2| (see Supplementary Appendix A and Materials and Methods). Note that on the left side of the vertical dotted line, the local minimum of ΔF does not exist (see curve (d) in panel B). Values of the model parameters are: Hm,1 = Dm,1 = 0, K1 = 10 kT nm2 [Citation21,Citation28], K2 = 100 kT nm2, Display full size [Citation68], w = −0.25, z2 = 6, Display full size, m0 = 1.67 nm−2 and R0 = 1000 nm. (D) Schematic representation of the fusion pore with anisotropic constituents in both membrane layers and a fusion pore diameter (Δ) of ∼0.6 nm. The thickness of the membrane layer containing glycolipids (∼ 4 nm) is larger than the thickness of the membrane layer without gylcolipids (∼ 2.5 nm).](/cms/asset/1ecf7aa5-93fa-4b30-85fe-89ef9607754a/imbc_a_460219_f0003_b.jpg)
Note also that the relative density of anisotropic membrane constituents in the pore region is increased as the fusion pore diameter is narrowed, since the curvature of the narrow fusion pore is favourable for anisotropic inclusions. Therefore, we next looked at how the free energy relates to the fusion pore diameter.
shows the calculated membrane free energy F = Fout + Fin as a function of the fusion pore diameter Δ, for different choices of anisotropy of the inclusions Dm,2. The free energy is calculated relatively to a reference free energy Fref (ΔF = F – Fref). The reference free energy was chosen for each curve so that ΔF = 0 for large (infinite) Δ. shows that the curves express minima at certain pore diameter (Δeq) in cases of sufficiently high anisotropic membrane constituents (anisotropy, see Dm,2 values adjacent to curves a-c, ). This is consistent with the presented experimental results indicating that fusion pores may exhibit an energetically favourable state. If anisotropy is reduced no minimum in ΔF is observed (curve d, ). Moreover, one can also observe that higher the anisotropy, smaller the stable fusion pore diameter Δeq (, ). Within the model parameters used, high enough anisotropy of the membrane constituents is therefore required to describe a stable fusion pore.
However, the relevant model parameters attain certain ranges of values. We were interested to find out whether there was a set of model parameters that would explain the stable pore for isotropic membrane constituents. Choosing the most favourable situation with large and negative intrinsic mean curvature, a shallow minimum was obtained, however, the width of the fusion pore was for an order of magnitude larger than obtained by experiments and also by considering anisotropic constituents (not shown).
schematically shows that the average orientation (see Supplementary Appendix A) of the anisotropic membrane constituents is not equal in both membrane layers of the fusion pore, the difference being about 90 degrees for sufficiently large values of ![]() (see Eq. A5). Isotropic (axisymmetric) inverted conical constituents (with C1m = C2m < 0 as defined in [Citation54]) only weakly accumulate in the inner and outer membrane layer in the vicinity of the saddle-like fusion pore (not shown) while the anisotropic membrane constituents (with C2m < 0 at C1m ≈ 0) strongly accumulate in both membrane layers of the fusion pore (). While the effects of isotropic inverted conical constituents on the membrane elasticity due to the mismatch of the intrinsic mean curvature and the actual mean curvature of both layers in the two membrane layers partly cancel each other due to opposing signs of the principal curvature in the two membrane layers, the effect of the average orientational ordering of the anisotropic constituents from both layers is summed up (since the average orientation of the anisotropic membrane constituents is different in both membrane layers of the fusion pore) [Citation22,Citation24]. This is one of the main reasons for the difference between the effect of anisotropic and isotropic membrane constituents on fusion pore stability.
(see Eq. A5). Isotropic (axisymmetric) inverted conical constituents (with C1m = C2m < 0 as defined in [Citation54]) only weakly accumulate in the inner and outer membrane layer in the vicinity of the saddle-like fusion pore (not shown) while the anisotropic membrane constituents (with C2m < 0 at C1m ≈ 0) strongly accumulate in both membrane layers of the fusion pore (). While the effects of isotropic inverted conical constituents on the membrane elasticity due to the mismatch of the intrinsic mean curvature and the actual mean curvature of both layers in the two membrane layers partly cancel each other due to opposing signs of the principal curvature in the two membrane layers, the effect of the average orientational ordering of the anisotropic constituents from both layers is summed up (since the average orientation of the anisotropic membrane constituents is different in both membrane layers of the fusion pore) [Citation22,Citation24]. This is one of the main reasons for the difference between the effect of anisotropic and isotropic membrane constituents on fusion pore stability.
In our calculations (), we considered the values of the intrinsic principal curvature C2m,2 around −1/3 nm−1 at C1m,2 ≈ 0 (i.e.; Hm,2 = –Dm,2 ≈ −1/6 nm−1), since they are very close to the measured values of the negative intrinsic (spontaneous) curvatures of lipids which are necessary to trigger the membrane fusion [Citation19]. It can therefore be concluded that the same component with negative intrinsic (spontaneous) curvatures which are essential for membrane fusion can also stabilize the narrow fusion pore after its formation. The diameter of the fusion pore remains stable, as observed in our experiments, since the membrane shape is entrapped within an energy minimum (see ).
Note that, not only the depth of the minimum of ΔF increases with narrowing the fusion pore diameter, but also that the equilibrium fusion pore diameter (Δeq), decreases with higher anisotropy Dm,2 (, ). Therefore, the higher the density of anisotropic membrane constituents in the fusion pore, the narrower and more stable is the fusion pore. From this one can also consider that if the pool of anisotropic membrane constituents within a membrane patch (domain) were high, such as in more curved structures (vesicles with relatively small diameter, for example), then the fusion pores would have smaller diameters with respect to membrane structures with less curved domains (i.e., vesicles with relatively larger diameters).
In our model we assume that the inner membrane layer of the vesicle and also in the neck of the vesicle (i.e., the fusion pore) contain sugar residues. For this reason we depicted the inner part of the membrane to be thicker than the outer part of the membrane (). Both layers of sugar residues in the region of fusion pore exceeds together 2 nm in thickness (see the caption to ) and therefore abolish the short-range attractive van der Waals and the short range attractive or oscillatory hydration forces between the opposing membranes in the fusion pore at low separation distances as pointed out by Israelachvili and Wennerstrom [Citation54].
We further analyzed the properties of transient fusion pore events, to see whether the fusion pore properties reflect the theoretical predictions given in .
The amplitudes of Cv and Gp of transient events are correlated
We decided to ignore full fusion and transient events, without the crosstalk between Im and Re admittance signals because in these events Gp increases to undeterminably large values (∼65 % of all events; see also [Citation8]). shows two traces where spontaneous discrete steps in CM are displayed. Note that they have two distinct amplitudes, likely due to two spontaneously fusing vesicles. On-steps and off-steps of these respective events appear similar in amplitude () and the coefficient of correlation between the on- and the subsequent off-step in CM was close to 1 (data not shown; n = 749, p < 0.05), confirming that these events represent transient vesicle fusions. Consistent with , which predicts that vesicles fused with the plasma membrane exhibit a stable fusion pore, the distribution of fusion pore conductances (Gp) recorded (), appears to exhibit a modal value of around 25 pS. This modal value represents a fusion pore diameter of 0.8 nm, considering the vesicle diameter is 300 nm.
Figure 4. Properties of vesicle capacitance Cv and fusion pore conductance Gp of transient fusion pore openings in resting lactotrophs. (a) Examples of time-dependent changes of Re and Im traces in resting lactotrophs. Time-dependent changes in Cv indicate that we are observing fusion activity of two dissimilar sized vesicles with different Gp. Events in Im without projections to Re were also observed in the patch (not shown). To calculate Cv and Gp in the right trace, we subtracted the calibration pulse seen in Im. (b) Amplitude distribution of on- and off-steps in Cv with top abscissa showing the vesicle diameter (specific membrane capacitance of 8 fF/μm2 was used). Note, that the average Cv of on-steps (6.1 ± 0.2 fF, n = 749) and the ensuing off-steps (5.7 ± 0.2 fF, n = 749) did not differ significantly (p > 0.05). (c) Frequency distribution of Gp. The average Gp was 36.5 ± 0.9 pS (n = 749). (d) Scatter plot diagram of Gp and Cv (n = 749). Note that vesicles with larger Cv have also larger Gp. Correlation coefficient between the two parameters is significantly different from zero (r = 0.38 ± 0.1, p < 0.0001, n = 749). Dashed lines indicate the limits of detection of signals related to the Gp calculation [Citation37].
![Figure 4. Properties of vesicle capacitance Cv and fusion pore conductance Gp of transient fusion pore openings in resting lactotrophs. (a) Examples of time-dependent changes of Re and Im traces in resting lactotrophs. Time-dependent changes in Cv indicate that we are observing fusion activity of two dissimilar sized vesicles with different Gp. Events in Im without projections to Re were also observed in the patch (not shown). To calculate Cv and Gp in the right trace, we subtracted the calibration pulse seen in Im. (b) Amplitude distribution of on- and off-steps in Cv with top abscissa showing the vesicle diameter (specific membrane capacitance of 8 fF/μm2 was used). Note, that the average Cv of on-steps (6.1 ± 0.2 fF, n = 749) and the ensuing off-steps (5.7 ± 0.2 fF, n = 749) did not differ significantly (p > 0.05). (c) Frequency distribution of Gp. The average Gp was 36.5 ± 0.9 pS (n = 749). (d) Scatter plot diagram of Gp and Cv (n = 749). Note that vesicles with larger Cv have also larger Gp. Correlation coefficient between the two parameters is significantly different from zero (r = 0.38 ± 0.1, p < 0.0001, n = 749). Dashed lines indicate the limits of detection of signals related to the Gp calculation [Citation37].](/cms/asset/508a5216-2d5b-49e0-bb95-82f264071977/imbc_a_460219_f0004_b.jpg)
Interestingly the two types of events shown in appear to have distinct Gp, as if transient events with the particular amplitude of Cv (the particular size of the vesicle) is associated with a preferable Gp. Therefore, we determined Gp and Cv for each spontaneous transient event (see Materials and Methods; ,). Gp values varied between 9 and 156 pS (mean = 36.5 ± 0.9 pS, n = 749), in accordance with previous results [Citation8]. Cv was in the range of 1.1–26.7 fF (mean = 5.8 ± 0.2 fF; n = 749), yielding a vesicle diameter (for calculation see Materials and Methods) ranging from 198 nm to 972 nm (mean = 422 ± 6 nm, n = 749; ), similar to vesicle diameters in stimulated lactotrophs [Citation50]. Interestingly, the amplitude of transient events was correlated to the fusion pore conductance as is seen in (r = 3.8 ± 0.1, p < 0.0001, n = 749).
The average fusion pore dwell-time, determined as the time between on- and subsequent off-steps, was 178 ± 7 ms (n = 749), as reported [Citation8] and was uncorrelated to Cv nor to Gp (data not shown).
The results of indicate that under spontaneous conditions larger vesicles exhibit stable fusion pores with relatively wider diameters in comparison to smaller vesicles. In the next section it is shown that this experimental result is consistent with the predictions of our model.
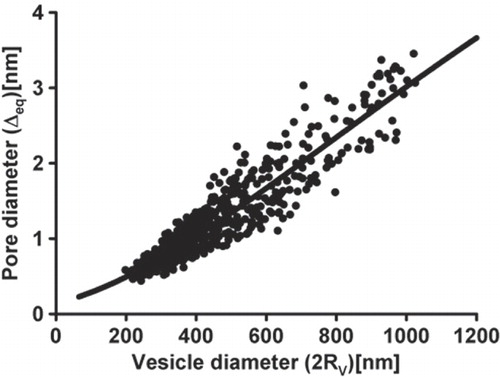
Relationship between vesicle and fusion pore diameters
shows that the fusion pore diameter, estimated from the Gp, increases with the vesicle diameter (2Rv) which is in accordance with the proposed mechanism of stabilization of the narrow fusion pores. Namely, it can be shown that the intrinsic principal curvatures of the anisotropic membrane constituents (in our case C2m,2 < 0 and C1m,2 ≈ 0) may be related to the vesicle size.
Figure 5. Relationship between the vesicle and the fusion pore diameters. The fusion pore diameter, estimated from fusion pore conductance Gp, is plotted as a function of the vesicle diameter (2 Rv). Vesicle diameter was estimated from the vesicle capacitance Cv, by assuming spherical shape of vesicles. Filled symbols denote experimental data; line denotes the curve Δeq = Δ0e−κ/(RV + B) (see Eq. (Citation7)) where we determined parameters Δ0 = 16.6 nm, κ = 2641.5 nm and B = 550.7 nm by using the least squares method to fit the experimental points.
In the two-component membrane (neglecting the influence of configurational entropy), the effective spontaneous curvature (Cef) of the vesicle membrane in its spherical region can be estimated as:
where we took into account that C1m,1 ≈ C2m,1 ≈ 0, C1m,2 ≈ 0 and C2m,2 < 0 (see also ). In the case of m2,in = m2,out, the value of Cef = 0. Assuming that the vesicle radius (Rv) is inversely proportional to the effective spontaneous curvature of the vesicle membrane in its spherical region Cef (see also [Citation33]), it follows from Eq. (Citation6) that for a non-zero (m2,in – m2,out), the vesicle radius Rv is inversely proportional to the intrinsic curvature deviator Dm,2 (anisotropy). Consequently, it is possible that smaller vesicles contain slightly more anisotropic constituents in the membrane and that we can associate the size of the vesicle with the anisotropy of the membrane constituents of type 2 (Dm,2) in a simple relation Dm,2 = A/(B + Rv) + C, where RV is the radius of the vesicle, while A, B and C are model parameters. Combination of the above assumption and the results presented in which predict the exponential relation between the equilibrium diameter of the pore (Δeq) and the anisotropy of the membrane constituents (Dm,2) gives the relation between the equilibrium diameter of the pore (Δeq) and the radius of the vesicle (RV) in the form:
where parameters Δ0, κ and B are determined by using the least squares method to fit the experimental data as shown in . For very small vesicle diameters, where we lack the experimental data, the theoretical curve predicts a reasonable value of 0.2 to 0.4 nm for a stable fusion pore diameter (see also ). Nevertheless, it should be stressed that the arguments considered in the relation between the vesicle diameter (Eq. (Citation7)) and the fusion pore diameter represent one of several possible mechanisms while other mechanisms may also be present.
Discussion
In this study we have shown that orientational and lateral redistribution of membrane constituents explains transient energetically stable narrow fusion pore events, recorded in resting lactotrophs by using cell-attached patch-clamp capacitance technique. Theoretical description provides a simple but relevant model composed of a mother cell with a small endovesicle connected by a fusion pore. Requiring the minimum of the free energy of sufficient depth to overcome the membrane fluctuations and limited width to avoid too large fluctuations of the thickness of the neck connecting the endovesicle with the membrane (the diameter of the fusion pore) it is shown that the proposed mechanism describes the essential features of the system. Moreover, patch clamp experiments show that vesicle size is correlated to the fusion pore conductance, which appears to be associated with anisotropic membrane constituents.
Transient fusion pores in resting lactotrophs are the likely subject of stabilization
Fusion of vesicles with the plasma membrane leads to the formation of fusion pores, which were hitherto believed to be energetically unstable in the absence of specific stabilizing factors [Citation53]. The observed repetitive fusion events likely represent interactions of the same vesicle with the plasma membrane [Citation6–8]. The majority of these repetitive events of the same vesicle with measurable conductance had a similar fusion pore diameter (), suggesting that fusion pores are the subjects of stabilization. Structure and local interactions of the membrane constituents – single molecules or small complexes of molecules [Citation19,Citation22,Citation23,Citation25,Citation28,Citation29,Citation33,Citation44,Citation45], may energetically prefer specific local membrane curvatures (). In support of this it was reported that membrane structure near the fusion site is distinct [Citation55]. Therefore, we assumed that the effective intrinsic shape of anisotropic membrane constituents (Figures A1, A2) in the membrane may govern the optimal fusion pore size [Citation20,Citation28]. The predicted local minimum of the free energy for the narrow fusion pores () anticipates a pore diameter with a value corresponding to the local minimum of the free energy. This cannot be predicted, if membrane constituents are described as isotropic, as no set of model parameters in the relevant range was found that would give a free energy minimum of appropriate depth and appropriate fusion pore diameter consistent with experiments. Considering isotropic inclusions with certain limitations leads to renormalization of the free energy within the acknowledged theory of isotropic membrane elasticity (area difference elasticity model), which considers membrane as a thin layered isotropic elastic continuum ([Citation56] and references therein). Stability of the narrow neck in phospholipid vesicles has previously been addressed by the area difference elasticity model [Citation57]. A minimum of the free energy corresponding to a narrow neck was obtained, however, the values of the model constants had to be taken out of range estimated by experiments (see discussions in [Citation25,Citation58,Citation59]).
Once the vesicle is fused with the membrane, very thin initial fusion pore, i.e., the neck connecting the vesicle and the target cell, is formed. It was shown recently that in the triggering of the vesicle fusion (i.e., neck formation), specific lipids with high negative intrinsic (spontaneous) curvatures play very important role [Citation19]. These and others specific lipids possess also high intrinsic anisotropy (see Figure A1) and can therefore stabilize a narrow diameter of the opened fusion pore, as predicted in .
Comparison of experimental results of fusion pores ( and ) and theoretical predictions () enabled us to estimate, that for the anisotropic membrane components, the intrinsic curvature deviator Dm,2 ≈ 0.2 nm-1 is needed to stabilize the pore. The corresponding values of intrinsic principal curvatures C1m,2 and C2m,2 are very similar to the values of spontaneous curvatures of some lipid molecules determined previously by other authors ([Citation19,Citation46,Citation60–62] and references therein), although a role for proteins in the fusion pore structure may not be ruled out completely (reviewed in [Citation17,Citation63]). As already mentioned in the presented theoretical analysis of stability of a fusion pore (), the anisotropic membrane constituents could be single molecules (lipid or protein) or small membrane nanodomains composed of lipids or lipids and proteins (Figure A2). It should be stressed at this point that besides the stable anisotropic geometry of the fusion pore, the stability of other strongly anisotropic lipid structures may also be better understood by taking into account the anisotropic shape of lipid molecules, such as inverted hexagonal lipid phases [Citation21,Citation27] or thin tubular protrusions of giant lipid vesicles [Citation24].
In resting lactotrophs numerous prolactin-containing vesicles are located at the plasma membrane already prior to stimulation (). Interestingly, transient fusion (kiss-and-run) appears to be the predominant mode of exocytosis in resting lactotrophs [Citation8,Citation64]. Moreover, ∼35% of exocytotic events in lactotrophs were ‘unproductive’, i.e., exhibiting very narrow transient fusion pores with diameters ranging from 0.4–1.7 nm, which are too narrow for the peptide hormone prolactin stored in these vesicles to be released into the extracellular space ( and ). The majority of transient narrow fusion pore events recorded occurred repeatedly as flicker-bursts, some of them longer than 100 s, likely representing open fusion pore reopening of the same vesicle ( (i) and ; [Citation7,Citation8]).
Let us stress that the quantitative values of the depth and the position of the minimum in ΔF () and consequently the calculated size of the stable fusion pores (i.e., inner equilibrium diameter Δeq) () depend on the values of model parameters. Some of these parameters have not been explicitly measured but estimated from the known values of other measured constants (see [Citation21,Citation28]). However, the main conclusions based on the predictions of our theoretical model remain the same. If Dm,2 (anisotropy) is large enough, there is a narrow fusion pore diameter with a narrow minimum in ΔF (), which corresponds to an increased stability of a relatively narrow fusion pore (with fusion pore diameter of ∼0.5 nm, ).
High energy barriers involved in membrane merger cast doubt that the repetitive transient fusion events ( [Citation7,Citation8]) represent repetitive merger/fission cycles between the vesicle and the plasma membrane. More likely they reflect fluctuations of the fusion pore between several distinct states. During the apparent fusion pore closure in , the fusion pore diameter may be reduced to such an extent that Im and Re admittance signals associated with such a state would be embedded in the noise. Such a stable fusion pore is predicted from the diagram in , where higher stability is associated with a narrower fusion pore diameter. Interestingly, the minima of the three curves () indicate that fusion pores may attain stable fusion pores even with much larger diameters. This may appear inconsistent with the view that initially fusion pores appear stable and that stimulation initiates mechanisms by which the fusion pore diameter enlarges, which is associated with an increased flux of vesicle cargo loss into the extracellular medium. However, even when the fusion pore is dilated during stimulation, distinct fusion pore states have been recorded, which are modulated by synaptobrevin 2 [Citation65].
Vesicle size and the diameter of fusion pores
Experiments on resting lactotrophs revealed that vesicles undergoing exocytosis differ both in the vesicle size (; [Citation8,Citation50]; calculated from Cv as described in Materials and Methods), and in the fusion pore diameter (; calculated from Gp as described in Materials and Methods). To see, whether vesicle sizes are independent of fusion pore conductance, we plotted Cv as a function of Gp. Results show that transient fusion events with larger Cv (vesicle diameter) exhibit larger Gp (fusion pore diameter), compared to events with smaller Cv (). It is unlikely that the correlation between Cv and Gp is an artefact due to the detectability of Gp, which depends on the vesicle size and on the sine wave frequency used, since the estimated lower and upper fusion pore conductance limits [Citation37] are for our settings 5 pS and 500 pS, respectively, by assuming a capacitance noise of 128 aF (rms [Citation36]) and the vesicle size of 8000 aF. If the vesicle size is taken 1000 aF, the upper detectable fusion pore conductance limit is 195 pS, well above the values measured in our experiments (see also the detection limits indicated by the dashed lines, ).The correlation of Cv and Gp obtained experimentally is strengthened with the theoretical calculations, which predict that smaller vesicles undergo exocytosis with smaller fusion pores in comparison to larger vesicles due to specific intrinsic shape of anisotropic constituents (increased anisotropy Dm,2) in their membrane. Moreover, our results are consistent with the previously published relationship between vesicle volume and the frequency of detection of the pre-spike ‘foot’ amperometric signals [Citation18]. The ‘foot’ signal represents a stable fusion pore where vesicle cargo molecules exit the vesicle [Citation11,Citation66] but at a much slower rate in comparison to the state when the fusion pore diameter enlarges during the spike-like current. Sombers et al. [Citation18] report that with smaller vesicles the observations of ‘foot’ signals increase, which is consistent with our results where smaller vesicles have a tendency to exhibit stable pores with a narrower diameter (–).
It has been shown recently that critical negative intrinsic curvatures of lipids are necessary to trigger the membrane fusion [Citation19]. The same lipids with negative intrinsic curvatures which are essential for membrane fusion can then, according to our theoretical predictions given in , stabilize also the open fusion pore when formed. While the exact composition of the vesicle membrane and the membrane enveloping the fusion pore (the neck) is not known, it is likely that the molecular make-up of membrane near the vesicles in lactotrophs is distinct from membranes devoid of prolactin vesicles [Citation55]. Moreover, it is reasonable to consider that the anisotropic membrane constituents are not present only in the membrane forming the fusion pore, but also in the vesicle itself. We assume that the formation of smaller vesicles may partly be the result of a higher intrinsic curvature deviator Dm,2 which also leads to the formation of narrower fusion pores. Therefore, a relatively high proportion of anisotropic constituents favours the formation of narrow fusion pores and may also contribute to the formation of smaller vesicles. By assuming this, we can write Relation 7, which allows us to fit the experimental data (). The theoretically predicted increased stability, i.e., the increased depth of membrane free energy minimum with decreased vesicle size, is in accordance with the observed increased frequency of pores with smaller diameter (), also in accordance with previously published observations of the incidence of ‘foot’ amperometric spikes [Citation18].
In the microscopic approach considering different species of membrane constituents it is not possible to explain stability of thin tubular membrane protrusions and the consistently related sorting of phospholipids between tubular protrusion and mother membrane, if the molecules are considered isotropic, [Citation29,Citation59] and further, if direct interactions between the molecules are neglected [Citation29,Citation59,Citation67] since the entropic contribution to the free energy would in such case (when independent molecules would redistribute according to the curvature field only) rise more than the energy of the molecules would fall. Therefore, in order to explain stable nanotubular protrusions on membranes, direct interactions between lipid molecules were taken into account which in effect renormalized model constants in a pure phospholipid system [Citation24] as well as in more complex membrane systems where formation of (in general anisotropic) nanodomains (clusters or inclusions) due to direct lipid-lipid and lipid-protein interactions was assumed. Also, the direct interactions significantly contribute to the consistently related constituent sorting between the protrusion and the mother membrane [Citation29,Citation58,Citation59,Citation67]. In the model, clustering of the molecules can be described by an appropriate value of the constant of direct interaction between anisotropic membrane constituents K2 which is estimated from the properties of the molecules [Citation68]. It can be deduced from the values of K2 used in this work that possible candidates for anisotropic membrane constituents considered in (of type 2) which accumulate in the fusion pore are small complexes (i.e., anisotropic nanodomains) of lipids, anisotropic proteins or small anisotropic lipid-protein nanodomains [Citation29].
In areas with small curvature deviator Dj = |C1,j − C2,j|/2, j = out, in, all rotational states are nearly equivalent so that the intrinsic anisotropy is energetically irrelevant (see Supplementary Appendix A). However, in the membrane regions of high curvature deviator (like in our case in the region of fusion pore connecting the vesicle and the target plasma membrane) the effect of the principal curvature difference is sufficiently strong to yield accumulation and average orientation of the anisotropic membrane constituents [Citation20–29,Citation45,]. In such membrane regions of highly anisotropic curvature the intrinsic anisotropy of the membrane constituents (described by intrinsic curvature deviator Dm = |C1m − C2m|/2, see Supplementary Appendix A) becomes important.
Indeed, the phospholipid tails are subject to van der Waals interactions, which affect their packing into the layer. As this additionally lowers the local membrane free energy [Citation28], formation of transient complexes of membrane constituents such as fusion pores is favoured. The curvature-dependent average orientation of anisotropic lipids is important for its energy (see Supplementary Appendix A). However, taking into account the average orientational ordering of anisotropic lipid molecules does not assume their lattice-like packing with fixed molecular orientation at fixed position but just the possibility of decrease of the membrane free energy due to average orientation and position of rotating and laterally mobile in generally anisotropic lipid molecules.
Physiological implications
The results of this work are physiologically significant since changes in synapse activity were reported to affect vesicle size and synaptic plasticity [Citation18, Citation69–72] and provided some clues into the consequences of vesicle volume modification. Our work extended these studies by providing a model of fusion pore stability. Considering the relationship between vesicle size and preferred fusion pore diameter reveals interesting physiological consequences. A synaptic-like vesicle of 50 nm in diameter would exhibit a stable fusion pore of around 0.20 to 0.25 nm in diameter. The diameter of such a narrow pore is not wide enough to permeate even small molecules such as acetylcholine (MW = 146.20 g/mol) and L-glutamate (MW = 147.12 g/mol), which have x,y,z dimensions: Acetylcholine: 0.4 × 0.9 × 0.4 nm and L-glutamate: 0.5 × 0.8 × 0.3 nm. The x,y,z dimensions of molecules acetylcholine (PubChem Compound Identification Number (PubChem CID): 187; Chemical Abstracts Service Registry Number (CAS No.) 51-84-3) and L-glutamate (Pubchem CID: 641; CAS No. 56-86-0) were measured with a Pymol Molecular Graphics System. On the other hand, Equation 7 can be used to determine the largest equilibrium diameter of the pore (Δeq) which is ≈ Δ0. By using the least squares method to fit the experimental data for lactotrophs we determined Δ0 = 16.6 nm (). However, for vesicles smaller than 1850 nm in diameter, which is much larger than the biggest vesicles we have observed in our experiments (1025 nm), Δeq is smaller than 5.5 nm. Therefore, the Δeq of our vesicles is too narrow for the exit of peptide hormones [Citation7,Citation8].
Thus, as in peptidergic vesicles, which at rest exhibit unproductive exocytosis [Citation7,Citation8], also resting synaptic vesicles may already be fused to the plasma membrane prior to the stimulation of release of their cargo, exhibiting a very narrow fusion pore that cannot be easily detected by electrophysiological membrane capacitance measurements. Interestingly, it was suggested at the time of Katz [Citation73] that calcium increase at the fusion site causes a transient fusion of vesicle and plasma membranes. Although current views seem to favour the full fusion exocytosis as the mode of regulated exocytosis in neurons, it is possible that transient fusion, as predicted in our model, may also operate as an intermediate state in neurons.
The free energy changes associated with transitions between stable fusion pores with increased diameters () are within the range of energy stored by a single ternary SNARE complex [Citation74].
In summary, our experimental results, along with the theoretical model, provide a new interpretation for repetitive, transient fusion pore events with energetically stable narrow pore diameters. This represents a new intermediate state in the sequence of reactions between the vesicle and the plasma membrane that take place after the hemi-fusion stalk establishment and the formation of a fusion pore (). Moreover, experimental results revealed a correlation between vesicle and fusion pore diameters. We attribute this correlation to energy decrease due to accumulation of anisotropic constituents of the membrane in the neck connecting the vesicle with the plasma membrane (fusion pore), which governs the size of vesicles and fusion pores. The nature of these anisotropic constituents is not restricted to lipids, but may also include proteins. As the fusion pore stabilization mechanism is unspecific and as there is no a-priori reason that the membrane constituents are in general isotropic, it could be expected to take place in any cell type. Regulation of vesicle cargo discharge may therefore be attained by affecting the relationship between the vesicle size and the stable fusion pore diameter.
Figure 6. Stages vesicles undergo to accomplish the regulated release of chemical messengers. Fusion of vesicle and the plasma membrane represents the key event in regulated release of neurotransmitters and hormones. This process is thought to begin with the formation of a hemi-fusion stalk (transition A), an intermediate structure connecting the outer leaflets of fusing membranes (reviewed in [Citation3]). The hemi-fusion stalk then proceeds into a fusion pore (transition B), an aqueous channel connecting a spherical vesicle and the nearly ‘flat’ plasma membrane, through which cargo molecules diffuse from the vesicle lumen into the cell exterior. Fusion pore can reversibly vary its diameter (transitions C). The results of this paper show that fusion pores exhibit stability, which is depicted in the reaction diagram (bottom right). During the intermediate state (C), which is energetically stable, the fusion pore diameter may be too narrow to permeate luminal cargo molecules and therefore this state could be considered release incompetent [Citation7,Citation8]. Following the delivery of a stimulus, vesicles in state C may transit into a state with a wider fusion pore diameter, leading into a state of full fusion.
![Figure 6. Stages vesicles undergo to accomplish the regulated release of chemical messengers. Fusion of vesicle and the plasma membrane represents the key event in regulated release of neurotransmitters and hormones. This process is thought to begin with the formation of a hemi-fusion stalk (transition A), an intermediate structure connecting the outer leaflets of fusing membranes (reviewed in [Citation3]). The hemi-fusion stalk then proceeds into a fusion pore (transition B), an aqueous channel connecting a spherical vesicle and the nearly ‘flat’ plasma membrane, through which cargo molecules diffuse from the vesicle lumen into the cell exterior. Fusion pore can reversibly vary its diameter (transitions C). The results of this paper show that fusion pores exhibit stability, which is depicted in the reaction diagram (bottom right). During the intermediate state (C), which is energetically stable, the fusion pore diameter may be too narrow to permeate luminal cargo molecules and therefore this state could be considered release incompetent [Citation7,Citation8]. Following the delivery of a stimulus, vesicles in state C may transit into a state with a wider fusion pore diameter, leading into a state of full fusion.](/cms/asset/7d1accb2-b2f7-425c-b3d1-767b5915812d/imbc_a_460219_f0006_b.jpg)
Supplementary Material
Download PDF (387.9 KB)Declaration of interest: This work was supported by grants P3 521 0381, P3 0310 0381, Z3-3510-1683, J3-9219-0381-06, and P2-0232-1578 from the Ministry of Higher Education, Science and Technology of the Republic of Slovenia. The authors report no conflicts of interest. The authors alone are responsible for the content and writing of the paper.
References
- White J. 1992. Membrane fusion. Science 258:917–924.
- Jahn R, Lang T, Südhof T. 2003. Membrane fusion. Cell 112:519–533.
- Chernomordik LV, Kozlov MM. 2008. Mechanics of membrane fusion. Nature Struct Mol Biol 15:675–683.
- Ceccarelli B, Hurlbut W, Mauro A. 1973. Turnover of transmitter and synaptic vesicles at the frog neuromuscular junction. J Cell Biol 57:499–524.
- Heuser J, Reese T. 1973. Evidence for recycling of synaptic vesicle membrane during transmitter release at the frog neuromuscular junction. J Cell Biol 57:315–344.
- Fernandez J, Neher E, Gomperts B. 1984. Capacitance measurements reveal stepwise fusion events in degranulating mast cells. Nature 312:453–455.
- Stenovec M, Kreft M, Poberaj I, Betz W, Zorec R. 2004. Slow spontaneous secretion from single large dense-core vesicles monitored in neuroendocrine cells. FASEB J 18:1270–1272.
- Vardjan N, Stenovec M, Jorgačevski J, Kreft M, Zorec R. 2007. Subnanometer fusion pores in spontaneous exocytosis of peptidergic vesicles. J Neurosci 27:4737–4746.
- Spruce A, Breckenridge L, Lee A, Almers W. 1990. Properties of the fusion pore that forms during exocytosis of a mast cell secretory vesicle. Neuron 4:643–654.
- Lollike K, Borregaard N, Lindau M. 1995. The exocytotic fusion pore of small granules has a conductance similar to an ion channel. J Cell Biol 129:99–104.
- Alvarez de Toledo G, Fernández-Chacón R, Fernández J. 1993. Release of secretory products during transient vesicle fusion. Nature 363:554–558.
- Vardjan N, Stenovec M, Jorgačevski J, Kreft M, Zorec R. 2007. Elementary properties of spontaneous fusion of peptidergic vesicles: fusion pore gating. J Physiol 585:655–664.
- Kozlov M, Markin V. 1983. Possible mechanism of membrane fusion. Biofizika 28:242–247.
- Jahn R, Scheller R. 2006. SNAREs – engines for membrane fusion. Nat Rev Mol Cell Biol 7:631–643.
- Duman J, Forte J. 2003. What is the role of SNARE proteins in membrane fusion? Am J Physiol Cell Physiol 285:C237–249.
- Martens S, Kozlov M, McMahon H. 2007. How synaptotagmin promotes membrane fusion. Science 316:1205–1208.
- Jackson M, Chapman E. 2008. The fusion pores of Ca(2+)-triggered exocytosis. Nat Struct Mol Biol 15:684–689.
- Sombers L, Hanchar H, Colliver T, Wittenberg N, Cans A, Arbault S, Amatore C, Ewing A. 2004. The effects of vesicular volume on secretion through the fusion pore in exocytotic release from PC12 cells. J Neurosci 24:303–309.
- Churchward M, Rogasevskaia T, Brandman D, Khosravani H, Nava P, Atkinson J, Coorssen J. 2008. Specific lipids supply critical negative spontaneous curvature – an essential component of native Ca2+-triggered membrane fusion. Biophys J 94:3976–3986.
- Kralj-Iglič V, Heinrich V, Svetina S, Žekš B. 1999. Free energy of closed membrane with anisotropic inclusions. Eur Phys J B 10:5–8.
- Mareš T, Daniel M, Perutkova Š, Perne A, Dolinar G, Iglič A, Rappolt M, Kralj-Iglič V. 2008. Role of phospholipid asymmetry in the stability of inverted hexagonal mesoscopic phases. J Phys Chem B 112:16575–16584.
- Fournier JB, Galatola P. 1998. Bilayer membranes with 2-D nematic order of the surfactant polar heads. Braz J Phys 28:329–338.
- Kralj-Iglič V, Iglič A, Hägerstrand H, Peterlin P. 2000. Stable tubular microexovesicles of the erythrocyte membrane induced by dimeric amphiphiles. Phys Rev E 64:4230–4234.
- Kralj-Iglič V, Iglič A, Gomišček G, Arrigler V, Hägerstrand H. 2002. Microtubes and nanotubes of phospholipids bilayer vesicles. J Phys A: Math Gen 35:1533–1549.
- Fošnarič M, Kralj-Iglič V, Bohinc K, Iglič A, May S. 2003. Stabilization of pores in lipid bilayers by anisotropic inclusions. J Phys Chem B 107:12519–12526.
- Urbanija J, Babnik B, Frank M, Tomsic N, Rozman B, Kralj-Iglic V, Iglic A. 2008. Attachment of beta 2-glycoprotein I to negatively charged liposomes may prevent the release of daughter vesicles from the parent membrane. Eur Biophys J 37:1085–1095.
- Rappolt M, Hodzic A, Sartori B, Ollivon M, Laggner P. 2008. Conformational and hydrational properties during the L(beta)- to L(alpha)- and L(alpha)- to H(II)-phase transition in phosphatidylethanolamine. Chem Phys Lipids 154:46–55.
- Kralj-Iglič V, Babnik B, Gauger RD, May S, Iglič A. 2006. Quadrupolar ordering of phospholipid molecules in narrow necks of phospholipid vesicles. J Stat Phys 125:727–752.
- Iglič A, Lokar M, Babnik B, Slivnik T, Veranič P, Hägerstrand H, Kralj-Iglič V. 2007. Possible role of flexible red blood cell membrane nanodomains in the growth and stability of membrane nanotubes. Blood Cells Mol Dis 39:14–23.
- Markin V. 1981. Lateral organization of membranes and cell shapes. Biophys J 36:1–19.
- Laradji M, Sunil Kumar P. 2004. Dynamics of domain growth in self-assembled fluid vesicles. Phys Rev Lett 93:198105.
- Staneva G, Seigneuret M, Koumanov K, Trugnan G, Angelova M. 2005. Detergents induce raft-like domains budding and fission from giant unilamellar heterogeneous vesicles: a direct microscopy observation. Chem Phys Lipids 136:55–66.
- Hägerstrand H, Mrówczyńska L, Salzer U, Prohaska R, Michelsen K, Kralj-Iglič V, Iglič A. 2006. Curvature-dependent lateral distribution of raft markers in the human erythrocyte membrane. Mol Membr Biol 23:277–288.
- Ben-Tabou S, Keller E, Nussinovitch I. 1994. Mechanosensitivity of voltage-gated calcium currents in rat anterior pituitary cells. J Physiol 476:29–39.
- Zorec R, Henigman F, Mason WT, Kordaš M. 1991. Electrophysiological study of hormone secretion by single adenohypophyseal cells. Meth Neurosci 4:194–210.
- Kreft M, Zorec R. 1997. Cell-attached measurements of attofarad capacitance steps in rat melanotrophs. Pflugers Arch 434:212–214.
- Debus K, Lindau M. 2000. Resolution of patch capacitance recordings and of fusion pore conductances in small vesicles. Biophys J 78:2983–2997.
- Neher E, Marty A. 1982. Discrete changes of cell membrane capacitance observed under conditions of enhanced secretion in bovine adrenal chromaffin cells. Proc Natl Acad Sci USA 79:6712–6716.
- Henkel AW, Meiri H, Horstmann H, Lindau M, Almers W. 2000. Rhythmic opening and closing of vesicles during constitutive exo- and endocytosis in chromaffin cells. EMBO J 19:84–93.
- Sens P, Gov N. 2007. Force balance and membrane shedding at the red-blood-cell surface. Phys Rev Lett 98:018102.
- Israelachvili J, Wennerström H. 1996. Role of hydration and water structure in biological and colloidal interactions. Nature 379:219–225.
- Dan N, Safran S. 1998. Effect of lipid characteristics on the structure of transmembrane proteins. Biophys J 75:1410–1414.
- Dommersnes PG, Fournier JB. 1999. N-Body study of anisotropic membrane inclusions: membrane-mediated interactions and ordered aggregation. Eur Phys J B 12:9–12.
- Salzer U, Prohaska R. 2003. Segregation of lipid raft proteins during calcium-inducevesiculation of erythrocytes. Blood 101:3751–3753.
- Oda R, Huc I, Candau SJ. 1997. Gemini surfactants, the effect of hydrophobic chain length and dissymmetry. Chem Commun 2105–2106.
- Wang W, Yang L, Huang H. 2007. Evidence of cholesterol accumulated in high curvature regions: implication to the curvature elastic energy for lipid mixtures. Biophys J 92:2819–2830.
- Hill TL. 1986. An introduction to statistical thermodynamics. New York: Dover Publications. pp. 246–247.
- Michael D, Cai H, Xiong W, Ouyang J, Chow R. 2006. Mechanisms of peptide hormone secretion. Trends Endocrinol Metab 17:408–415.
- Rosenmund C, Rettig J, Brose N. 2003. Molecular mechanisms of active zone function. Curr Opin Neurobiol 13:509–519.
- Angleson J, Cochilla A, Kilic G, Nussinovitch I, Betz W. 1999. Regulation of dense core release from neuroendocrine cells revealed by imaging single exocytic events. Nat Neurosci 2:440–446.
- Kreft M, Blaganje M, Grilc S, Rupnik M, Zorec R. 2006. Glutamate stimulation increases hormone release in rat melanotrophs. Neurosci Lett 404:299–302.
- Lollike K, Lindau M. 1999. Membrane capacitance techniques to monitor granule exocytosis in neutrophils. J Immunol Meth 232:111–120.
- Israelachvili J. 1992. Intermolecular and surface forces. London: Academic Press. pp. 366–394.
- Israelachvili JN, Wennerström H. 1996. Role of hydration and water structure in biological and colloidal interactions. Nature 379:219–225.
- Gonçalves P, Stenovec M, Chowdhury H, Grilc S, Kreft M, Zorec R. 2008. Prolactin secretion sites contain syntaxin-1 and differ from ganglioside monosialic acid rafts in rat lactotrophs. Endocrinology 149:4948–4957.
- Seifert U. 1997. Configurations of fluid membranes and vesicles. Adv Phys 46:13–137.
- Miao L, Seifert U, Wortis M, Döbereiner H. 1994. Budding transitions of fluid-bilayer vesicles: The effect of area-difference elasticity. Phys Rev E Stat Phys Plasmas Fluids Relat Interdiscip Topics 49:5389–5407.
- Kralj-Iglič V, Hägerstrand H, Veranič P, Jezernik K, Iglič A. 2005. Amphiphile-induced tubular budding of the bilayer membrane. Eur Biophys J 34:1066–1070.
- Iglic A, Kralj-Iglic V. 2006. Budding of liposomes – role of intrinsic shape of membrane constituents. Advances in planar lipid bilayers and liposomes. Amsterdam: Elsevier. pp. 253–279.
- Zimmerberg J, Kozlov M. 2006. How proteins produce cellular membrane curvature. Nat Rev Mol Cell Biol 7:9–19.
- Chen Z, Rand R. 1997. The influence of cholesterol on phospholipid membrane curvature and bending elasticity. Biophys J 73:267–276.
- Kooijman E, Chupin V, Fuller N, Kozlov M, de Kruijff B, Burger K, Rand P. 2005. Spontaneous curvature of phosphatidic acid and lysophosphatidic acid. Biochemistry 44:2097–2102.
- Fang Q, Berberian K, Gong L, Hafez I, Sørensen J, Lindau M. 2008. The role of the C terminus of the SNARE protein SNAP-25 in fusion pore opening and a model for fusion pore mechanics. Proc Natl Acad Sci USA 105:15388–15392.
- Jorgačevski J, Stenovec M, Kreft M, Bajić A, Rituper B, Vardjan N, Stojilkovic S, Zorec R. 2008. Hypotonicity and peptide discharge from a single vesicle. Am J Physiol Cell Physiol 295:C624–631.
- Bretou M, Anne C, Darchen F. 2008. A fast mode of membrane fusion dependent on tight SNARE zippering. J Neurosci 28:8470–8476.
- Chow RH, von Rüden L, Neher E. 1992. Delay in vesicle fusion revealed by electrochemical monitoring of single secretory events in adrenal chromaffin cells. Nature 356:60–63.
- Tian A, Baumgart T. 2009. Sorting of lipids and proteins in membrane curvature gradients. Biophys J 96:2676–2688.
- Fošnarič M, Iglič A, Slivnik T, Kralj-Iglič V. 2008. Flexible membrane inclusions and membrane inclusions induced by rigid globular proteins. In: Advances in planar lipid bilayers and liposomes. Amsterdam: Elsevier. pp. 143–168.
- Zimmermann H, Whittaker V. 1974. Effect of electrical stimulation on the yield and composition of synaptic vesicles from the cholinergic synapses of the electric organ of Torpedo: a combined biochemical, electrophysiological and morphological study. J Neurochem 22:435–450.
- Wickelgren W, Leonard J, Grimes M, Clark R. 1985. Ultrastructural correlates of transmitter release in presynaptic areas of lamprey reticulospinal axons. J Neurosci 5:1188–1201.
- Choi S, Klingauf J, Tsien R. 2000. Postfusional regulation of cleft glutamate concentration during LTP at ‘silent synapses’. Nat Neurosci 3:330–336.
- Karunanithi S, Marin L, Wong K, Atwood H. 2002. Quantal size and variation determined by vesicle size in normal and mutant Drosophila glutamatergic synapses. J Neurosci 22:10267–10276.
- Katz B. 1969. The release of neural transmitter substances. Liverpool, UK: Liverpool University Press.
- Liu W, Parpura V. 2009. Energetics of (dis)assembly of the ternary SNARE complex. Front Neuroenerget 1:1–2.