Abstract
By using Aspergillus nidulans strains expressing functional GFP-tagged transporters under hypertonic conditions, we noticed the rapid appearance of cortical, relatively static, fluorescent patches (0.5–2.3 μm). These patches do not correspond to transporter microdomains as they co-localize with other plasma membrane-associated molecules, such as the pleckstrin homology (PH) domain and the SsoA t-Snare, or the lipophilic markers FM4-64 and filipin. In addition, they do not show characteristics of lipid rafts, MCCs or other membrane microdomains. Deconvoluted microscopic images showed that fluorescent patches correspond to plasma membrane invaginations. Transporters remain fully active during this phenomenon of localized plasmolysis. Plasmolysis was however associated with reduced growth rate and a dramatic blockage in transporter and FM4-64 endocytosis. These phenomena are transient and rapidly reversible upon wash-out of hypertonic media. Based on the observation that block in endocytosis by hypertonic treatment altered dramatically the cellular localization of tropomyosin (GFP-TpmA), although it did not affect the cortical appearance of upstream (SlaB-GFP) or downstream (AbpA-mRFP) endocytic components, we conclude that hypertonicity modifies actin dynamics and thus acts indirectly on endocytosis. This was further supported by the effect of latrunculin B, an actin depolymerization agent, on endocytosis. We show that the phenomena observed in A. nidulans also occur in Saccharomyces cerevisiae, suggesting that they constitute basic homeostatic responses of ascomycetes to hypertonic shock. Finally, our work shows that hypertonic treatments can be used as physiological tools to study the endocytic down-regulation of transporters in A. nidulans, as non-conditional genetic blocks affecting endocytic internalization are lethal or severely debilitating.
Introduction
Eukaryotic transporters respond to environmental and developmental signals at both the transcriptional and post-translational levels. Their tight control includes mostly rapid de novo synthesis and even more rapid down-regulation through endocytosis and vacuolar degradation (André and Haguenauer-Tsapis Citation2004, Dupré et al. Citation2004). The molecular mechanisms underlying endocytosis and vacuolar degradation are best understood in Saccharomyces cerevisiae. It has been shown that the principal signal for transporter endocytosis and entry into multivesicular bodies (MVBs), which eventually fuse with the vacuole/lysosome and thus deliver the vesicles to degradative enzymes, is their ubiquitination (André and Haguenauer-Tsapis Citation2004, Dupré et al. Citation2004, Belgareh-Touze et al. Citation2008). Ubiquitination serves as a signal not only for transporter internalization from the plasma membrane, but also to redirect newly synthesized transporter molecules from the Golgi to endosomes (Soetens et al. Citation2001, Umebayashi and Nakano Citation2003) and for MVB sorting (Helliwell et al. Citation2001, Soetens et al. Citation2001, Reggiori and Pelham Citation2002, André and Haguenauer-Tsapis Citation2004, Blondel et al. Citation2004, Erpapazoglou et al. Citation2008).
The trafficking, function and turnover of S. cerevisiae transporters is also known to depend on their partitioning in lipid-rafts or plasma membrane compartments (MCs) with distinct lipid composition. Two such non-overlapping membrane compartments (MCs) have been distinguished, using GFP-tagged transporters as markers, as evenly distributed ∼300 nm isolated patches (Grossmann et al. Citation2007). The first, MCC, contains permeases specific for arginine (Can1p), tryptophan (Tat2p) and uracil (Fur4p), whereas the second, MCP, contains the proton ATPase Pma1p (Malinska et al. Citation2004, Grossmann et al. Citation2006, 2007). MCCs contain a distinct lipid composition enriched in ergosterol, as visualized by staining with filipin, a fluorescent marker binding this lipid (Malinska et al. Citation2003, Grossmann et al. Citation2007), but also as supported by biochemical assays relating transporter extractability from membranes using Triton-X 100 (Grossmann et al. Citation2007). The compartmentation of the plasma membrane into MCC and MCP is highly stable (Malinska et al. Citation2004), but transporters dock within MCC patches in a reversible, membrane potential-dependent manner (Grossmann et al. Citation2007). Based on a number of observations relating to the rate of transporter endocytosis with localization in MCCs, it has been proposed that the biological function of MCCs is to protect therein embedded transporters and other proteins from internalization and turnover (Grossmann et al. Citation2008). This view is somehow contradicted by other studies showing that MCC organization is, at least in part, mediated by large protein complexes, termed eisosomes, which were proposed to mark static sites of endocytosis (Walther et al. Citation2006). One possible function of MCCs and eisosomes is to regulate protein and lipid abundance by sorting them into distinct, spatially separated pools where they are stabilized or from which they can be either endocytosed, or protected from internalization, selectively. Electron microscopy analysis suggested that MCC patches correspond to furrow-like invaginations in the plasma membrane of yeast (Strádalová et al. Citation2009).
Several transporters of the filamentous ascomycete Aspergillus nidulans have been studied (for reviews see Pantazopoulou and Diallinas Citation2007, Diallinas Citation2008). In most cases, transporters tagged with GFP remain fully functional, although in some cases the GFP tag led to increased instability and vacuolar turnover (Tavoularis et al. Citation2001, Pantazopoulou et al. Citation2007, Vlanti and Diallinas Citation2008). After transcriptional activation of the corresponding genes during conidiospore germination (Amillis et al. Citation2004), transporter proteins show a uniform distribution along the plasma membrane of germlings and developing mycelia. Often, GFP-tagged transporters also label the vacuoles, which is the site of their constitutive turnover (see ).
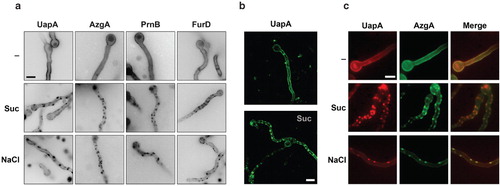
Figure 1. (a) Hypertonic media elicit a cortical patchy appearance of A. nidulans GFP-tagged transporters observed by epifluorescence microscopy. Upper panel: Control samples (–) were grown for 13 h in MM (urea 5 mM, glucose 1%) at 25°C, which permit the induction of transporters during conidiospore germination (Pantazopoulou and Diallinas Citation2007). Lower panels: Samples grown similarly as control samples, but then transferred to the same media containing 0.8 M Sucrose (Suc) or 0.5 M NaCl. Here and in several subsequent Figures, images were converted to 8-bit inverted grayscale. (b) Confocal laser scanning microscopy of UapA-GFP cellular expression in control media (–) or after 1 min exposure to 0.8 M Sucrose (Suc). (c) Epifluorescence microscopy of a strain expressing simultaneously UapA-mRFP and AzgA-GFP in control (–) or hypertonic (Suc, NaCl) media. Notice the overlap of red and green fluorescence (merge). Scale bars shown here and in subsequent figures correspond to 5 μm unless otherwise stated.
Transporter turnover is dramatically enhanced upon various physiological signals or stress conditions. For example, several transporters of purines (UapA, UapC), pyrimidines (FcyB, FurD) and amino acids (PrnB, AgtA) are rapidly turned-over in the presence of ammonium ions (Tavoularis et al. Citation2001, Valdez-Taubas et al. Citation2004, Pantazopoulou et al. Citation2007, Vlanti and Diallinas Citation2008, Apostolaki et al. Citation2009, Borbolis and Diallinas, unpublished). This is a typical example of down-regulation of transporters specific for nitrogenous compounds when a primary nitrogen source such as ammonium or glutamine is added in the media, a phenomenon very well studied in S. cerevisiae. Several A. nidulans transporters are also down-regulated by endocytosis and vacuolar degradation in the presence of their substrates (Vlanti and Diallinas Citation2008, Gournas et al. Citation2010, Borbolis, Pavlides and Diallinas, unpublished). An interesting aspect concerning the turnover of the UapA permease by its substrates is that endocytosis of inactive UapA molecules has been shown to occur in trans when co-expressed with active UapA versions, even if the latter cannot be endocytosed (Gournas et al. Citation2010). This last observation strongly suggested that UapA molecules might be organized in specific plasma membrane microdomains, either constitutively or prior to endocytosis.
In the course of previous work, we noticed that some A. nidulans transporters tagged with GFP form fluorescent cortical patches, when the samples were washed in buffers containing relatively high salt concentrations (Pavlides and Diallinas, unpublished). In the present work, we investigated the conditions eliciting the appearance of transporters as cortical patches, whether this phenomenon is specific to transporters and their turnover, and whether patches correspond to transporter-specific microdomains or membrane compartments similar to MCCs. We show that patches originally observed with transporters correspond to membrane invaginations rather than specific membrane microdomains, transiently elicited by hypertonic conditions. We further show that this phenomenon is associated with transient growth arrest and a total block of endocytic mechanisms in A. nidulans. Similar conclusions were reached in S. cerevisiae. We finally investigate aspects concerning the mechanism blocking endocytosis and discuss how conditions established herein can be used as physiological tools to study transporter trafficking and sorting in the MVB pathway in A. nidulans, where genetic blocks in relevant genes are usually lethal or debilitating (Araujo-Bazán et al. Citation2008, Rodríguez-Galán et al. Citation2009, Abenza et al. Citation2010).
Methods
Strains, genetics, media and growth conditions
A. nidulans and S. cerevisiae strains used are listed in . Newly-made A. nidulans strains were constructed with standard genetic crossing using auxotrophic markers for heterokaryon establishment. Standard complete (CM) and minimal media (MM) for A. nidulans were used (www.fgsc.net). Nitrogen sources were used at the following concentrations: urea 5 mM, NaNO3 10 mM, NH4Cl 10 mM, uric acid 0.1 mg/ml. Induction of UapA expression from the alcA promoter was achieved after 14 h of growth in MM supplemented with urea (5 mM) and fructose (0.1%). Repression of UapA expressed from the alcA promoter (alcAp ) was achieved in MM supplemented with urea (5 mM) and glucose (1%). Growth tests were carried out at 25°C, at pH 6.8. Supplements were added when appropriate. In yeast, Jen1p-GFP expression was induced by 4 h growth in MM supplemented with 0.5% lactate (Paiva et al. Citation2009) and Fur4p-GFP by 16 h growth in MM with 2% galactose (Leung et al. Citation2010).
Table I. Strains used in this study.
Epifluorescence and confocal microscopy
Samples for fluorescence microscopy were prepared as in Valdez-Taubas et al. (Citation2004). In particular, the samples were incubated in 3 cm Petri dishes on cover slips, protected from light, in liquid MM supplemented with urea as nitrogen source and appropriate auxotrophies, at 25°C for 12–17 h and then shifted to various conditions for 2–4 h. Staining with FM4-64 (Molecular Probes, Inc, USA) was according to Penalva (Citation2005). In particular, cover slips with germinated conidia were placed on top of plastic covers, covered with 0.1 ml of 10 μM FM4-64 in MM, incubated on ice for 15 min, washed in 5 ml MM, and transferred to fresh 3 ml medium for 0–30 min chase time. Staining with filipin (Sigma) was performed by addition of 0.1 ml MM supplemented with 25 μg/ml filipin on cover slips with germinated conidia, on top of plastic covers, 15 min prior to observation. Calcofluor white (Sigma) staining, used for detecting the presence and deposition of polysaccharides (chitin and b-1,3-glucan) in the cell walls of yeast and mycelial fungi, was performed according to Slaninová et al. (Citation2000). Cells were stained for 5 min on coverslips with a solution of Calcofluor (0.001%w/v in relevant growth medium), washed and immediately observed in the fluorescence microscope. Lat-B was used as described (Taheri-Talesh et al. Citation2008), at a final concentration of 20–40 μg/ml (50–100 μM). The drug was added from a 10 mM stock in DMSO. For endocytosis, uric acid (0.1 mg/ml) or NH4Cl (10–50 mM) was added for 1 h before observation. For hypertonic treatment, sucrose, NaCl or other agents were added as indicated in the relevant Figures. Samples were observed on an Axioplan Zeiss phase-contrast epifluorescent microscope with appropriate filters and the resulting images were acquired with a Zeiss-MRC5 digital camera using the AxioVs40 V4.40.0 software. Image processing, contrast adjustment and color combining were made using Adobe Photoshop CS2 V9.0.2. Images were converted to 8-bit greyscale or RGB and annotated using Photoshop CS2 before being saved to TIFF. At CIB-CSIC (Madrid), an inverted Leica DMI6000B microscope with motorized z-focus and a Leica EL6000 external light source was used for epifluorescence excitation. The microscope was driven by Metamorph (Invitrogen, Carlsbad, CA, USA) software using a DMI6000-specific driver. Images were acquired using HCX ×63 1.4 numerical aperture (NA) or ×100 1.4 NA objectives and a Hamamatsu ORCA ER-II cooled-charge coupled device camera (Hamamatsu Photonics, Massy, France). The microscope was equipped with Semrock Brightline GFP-3035B and TXRED-4040B filter sets (Semrock, Rochester, NY, USA). Maximal intensity projections were obtained from z-stacks using the Metamorph 3D plugin. Images were converted to 8-bit greyscale or RGB and annotated using Photoshop CS2 before being saved to TIFF. When indicated (), images were deconvoluted using the blind deconvolution algorithms of ImageJ 1.37 http://rsb.info.nih.gov/ij. For Laser Confocal Microscopy at the Medical School of Universidade do Minho, we used an inverted FLUOVIEW confocal laser scanning microscope, version FV1000 Viewer (Ver.2.0b) as described by the manufacturer (http://www.olympusfluoview.com/).
Transport assays
Radiolabelled xanthine (33.4 Ci/mmol) was from Moravek Biochemicals (Brea, CA, USA). [3H]-xanthine uptake was assayed in conidiospores at 37°C as described previously (Koukaki et al. Citation2005, Papageorgiou et al. Citation2008). All experiments were carried out in triplicate. Initial velocities were corrected by subtracting background uptake values, measured in the uapA-uapC- mutant (Koukaki et al. Citation2005). The K m (concentration for obtaining V m/2) of UapA for xanthine was determined from full dose-response curves with a minimum of eight points spread over the relevant range. In all cases, the Hill coefficients were close to −1, consistent with competitive inhibition.
Western blot analysis
Protein extracts were prepared as in Pantazopoulou et al. (Citation2007). In particular, liquid cultures were incubated for 12 h at 25°C before the addition of substrates or ammonium, or induction for the alcA p-driven UapA expression. Protein concentrations were determined by the method of Bradford. In each case, 50 μg of protein were loaded for SDS PAGE. Samples were fractionated on a 10% SDS-page gel and electroblotted (Mini PROTEANTM Tetra Cell, BIO-RAD) onto a PVDF membrane (Macherey-Nagel) for immunodetection. The membrane was treated with 2% non-fat dry milk or according to the manufacturer instructions and immunodetection was performed using a primary mouse anti-GFP monoclonal antibody (Roche) and a secondary goat anti-mouse IgG HRP-linked antibody (Cell Signaling). Blots were developed by the chemiluminescent method using the West Pico SuperSignal reagent (Pierce).
Determination of detergent resistance
This is basically as described in Grossmann et al. (Citation2007). In brief, aliquots corresponding to 50 μg of membrane protein in 100 μl 50 mM Tris-HCl, pH 7.5, 150 mM NaCl, 5 mM EDTA, were treated with increasing concentrations of Triton X-100 (0–0.8%) at room temperature for 30 min. Non-solubilized material was pelleted by centrifugation (14,000 rpm at 4°C for 30 min) and washed by 100 μl of the corresponding buffers under the same conditions. The pellets were resuspended in 30 μl of sample buffer, dissociated at 37°C for 15 min and then resolved by SDS-PAGE, and UapA-GFP was detected by a specific anti-GFP antibody on a Western blot.
Results
Hypertonic media elicit a cortical patchy appearance of A. nidulans transporters
Using functional GFP-tagged versions of seven permeases belonging to four evolutionary distinct protein families (NAT/NCS2, NCS1, AzgA-like, APC; http://www.membranetransport.org/), we have found that after transcriptional activation of the corresponding genes during conidiospore germination, transporter polypeptides show a rather uniform distribution along the plasma membrane of germlings and developing mycelia. A similar picture of uniform plasma membrane partitioning was also observed in other Aspergillus transporters studied using GFP (Forment et al. Citation2006, Apostolaki et al. Citation2009, Ramon and Scazzocchio, personal communication). This contrasts the case of several S. cerevisiae transporters that appear to form discrete cortical foci, corresponding to MCCs or MCPs (see Introduction). A representative picture of transporter cellular expression in A. nidulans is shown in the upper panel of . In this Figure, UapA is a carrier specific for uric acid-xanthine (Gorfinkiel et al. Citation1993) (NAT family), AzgA (Cecchetto et al. Citation2004) is a carrier specific for adenine-guanine-hypoxanthine (AzgA-like family), PrnB (Tazebay et al. Citation1997) is a proline permease (APC family) and FurD (Amillis et al. Citation2007) is a uracil permease (NCS1 family).
The cellular expression of the A. nidulans GFP-tagged transporters was also examined in samples treated for 1–5 min with NaCl or sucrose. Under these conditions, we observed the rapid appearance of cortical fluorescent patches, as those shown in the lower panels of and . By using a strain simultaneously expressing two of these transporters, UapA and AzgA, tagged with mRFP and GFP respectively, we showed that at least these permeases co-localize in the same patches ().
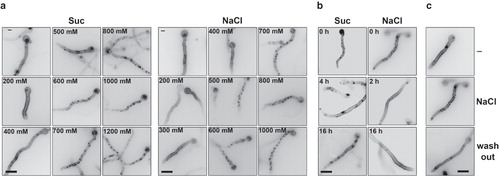
The kinetics of appearance of patches and most subsequent work were performed using a fully functional UapA-GFP transporter expressed from a strong controllable promoter (alcAp ) (Gournas et al. Citation2010). Patch appearance depended on the concentration of NaCl or sucrose (). The minimum concentrations of sucrose or NaCl eliciting the appearance of patches were determined to be >400 mM and > 200 mM, respectively, in agreement with the relative hypertonic strength of these two solutes. Patches formed by the two solutes looked identical and their number and size depended on tonicity strength. The hypertonic effect imposed on mycelia was more evident at higher concentrations where hyphae became thinner, apparently due to water loss. The size of patches ranged from 0.5 through 2.3 μm. Patches were shown to appear transiently, as they disappeared in overnight cultures in hypertonic media (see ). We estimated this recovery from the patchy appearance to take place after 4–8 h in sucrose (800 mM) or 2–4 h in NaCl (500 mM) ( and not shown). Finally, patches disappeared rapidly (15 min) when sucrose or NaCl was washed-out ().
Figure 2. (a) Kinetics of appearance of cortical patches in a strain expressing UapA-GFP from the alcA promoter (alcAp -UapA-GFP) in hypertonic media (1 min) in response to tonicity strength. Samples were grown for 14–15 h in mM (urea 5 mM, fructose 0.1%), at 25°C, which permits the induction of UapA-GFP from alcAp (Gournas et al. Citation2010). (b) Disassembly of alcAp -UapA-GFP fluorescent patches after prolonged growth (2, 4 or 16 h) in hypertonic media (Suc or NaCl). (c) Wash-out of alcAp-UapA-GFP fluorescent patches (NaCl) after 10 min transfer to control (–) media. The figure shows epifluorescence microscopy images. Scale bars shown are 10 μM.
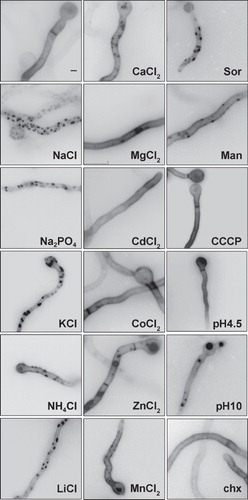
Several other hypertonic media (LiCl, KCl, Na2PO4, NH4Cl, sorbitol or mannitol) led to patchy distribution of UapA, whereas other stress conditions such as the presence of most divalent ions or heavy metals, protein synthesis blockage (cycloheximide), proton gradient uncouplers or extreme pH, had no effect ().
Figure 3. Examination by epifluorescence microscopy of UapA-specific fluorescent cortical patches after treatment with various salts (0.5 M), sugars (0.8 M), cycloheximide (chx, 20 μg/ml, 15 min prior to examination), different pH or the proton gradient uncoupler CCCP (30 μM, 15 min prior to examination). UapA-GFP is expressed from the the alcA promoter (alcAp -UapA-GFP) as described in . Sor and Man stand for Sorbitol and Mannitol, respectively. Notice that only monovalent ions and sugars (mostly Sor), which are known to produce hypertonic stress, lead to fluorescent patches.
Patches correspond to plasma membrane invaginations rather than lipid raft-like microdomains specific for transporters
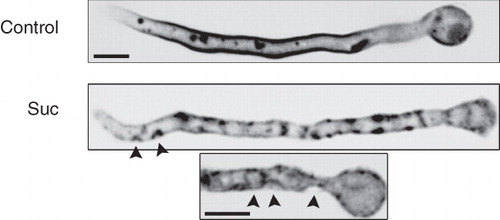
Some patches, especially those produced under stronger tonicity, although clearly plasma membrane-associated, seem to extend beyond the membrane towards the cytoplasm. This was more clearly seen in deconvoluted Z-stack images, which strongly supported that patches correspond to membrane invaginations (). This observation is in full agreement with two reports in S. cerevisiae (Slaninová et al. Citation2000) and Aspergillus repens (Kelavkar et al. Citation1993) directly showing, using TEM, that hypertonic media lead to plasma membrane invaginations, that can be extended deeply in the cytoplasm (see also later).
Figure 4. Fluorescent, UapA-GFP specific (alcAp -UapA-GFP), patches correspond to plasma membrane invaginations visible (highlighted with arrow heads) in deconvoluted images obtained with an inverted Leica microscope with motorized z-focus. Maximal intensity projections obtained from z-stacks using the Metamorph 3D are shown (see Experimental section). Two samples treated with sucrose (0.8 M) are shown compared with an untreated control.
We obtained independent evidence that fluorescent patches, initially observed using GFP-tagged transporters, are plasma membrane invaginations rather than specific transporter microdomains. This evidence is based on the following observations. Firstly, similar patches were observed using two other GFP-tagged plasma membrane associated polypeptides (). These are the pleckstrin homology (PH) domain of PLC-δ1, specifically recognizing the plasma membrane PI(4,5)P2 lipids (Pantazopoulou and Penalva Citation2009) and the SsoA t-Snare, a protein that serves as a membrane-specific tag in the docking of transport vesicles to the plasma membrane (Taheri-Talesh et al. Citation2008). Secondly, similar patches were also observed in hypertonic conditions, using the lipophilic markers FM4-64 (Penalva Citation2005) or Filipin (Takeshita et al. Citation2008) (also ). Importantly, FM4-64 patches co-localized with transporter (UapA) patches (see later in ). Thirdly, as known plasma membrane microdomains have a distinct raft-like lipid composition, we tested the extractability of UapA by Triton X-100 from membranes. This biochemical approach is a standard assay used to detect partitioning of transporters in detergent resistant membranes (DRMs), which seems to be the biochemical equivalent of lipid-raft microdomains (Grossmann et al. Citation2007). shows that UapA extractability was identical in standard and hypertonic media. Fourthly, direct transport measurements of radiolabeled 3H-xanthine performed under hypertonic conditions (0.8 M sucrose or 0.5 NaCl) showed that UapA-GFP remains fully functional, showing a K m value (8 μM) and transport capacity nearly identical to the one obtained in standard media (). Finally, using Calcofluor white staining, a marker of cell wall material such as chitin or b-1,3-glucan (see Material and methods), we showed that control samples exhibited a uniform blue fluorescence on their surfaces, whereas cells shifted to hyperosmotic medium (0.8 M sucrose) showed cortical fluorescent patches (, right panel). Several Calcofluor patches overlapped with UapA-GFP patches (highlighted with arrows). These results strongly suggest that invaginated areas of the plasma membrane are rapidly filled with cell wall material, either through de novo synthesis or reorganization of pre-existing periplasmic material. Similar observations were reported in yeast (Slaninová et al. Citation2000) and plants (Komis et al. Citation2002). The simplest explanation of all the above results is that fluorescent patches obtained with different markers represent plasma membrane invaginations, rather than specific microdomains with distinct lipid composition.
Figure 5. (a) Fluorescent patches detected with membrane-associated molecular markers other than transporters in hypertonic conditions. ‘PH domain’ is a GFP-tagged duplication of the PLC-δ1 PH domain which acts as an exclusive marker for the plasma membrane through its high affinity binding of PI(4,5)P2 lipids. SsoA is a GFP-tagged t-Snare exocytic protein that attaches to the inner leaflet of the plasma membrane. Filipin and FM4-64 are fluorescent lipophilic markers labeling the plasma membrane under specific conditions (see Experimental section). Calcofluor white staining (see Materials and methods) showing overlap of UapA-GFP patches with deposition of cell wall material (highlighted with arrows). (b) Extractability of UapA-GFP by Triton X-100 from plasma membranes is identical in standard media and after exposure to hypertonic treatment (0.8 M sucrose, 10 min). (c) UapA-mediated (alcAp -UapA-GFP) 3H-xanthine transport capacity in standard media and after exposure to hypertonic treatment (0.8 M sucrose, 10 min). The K m value of UapA-GFP (alcAp -UapA-GFP) for xanthine, established in hypertonic media, is also shown (8 μM). For details of uptake studies, see Experimental section.
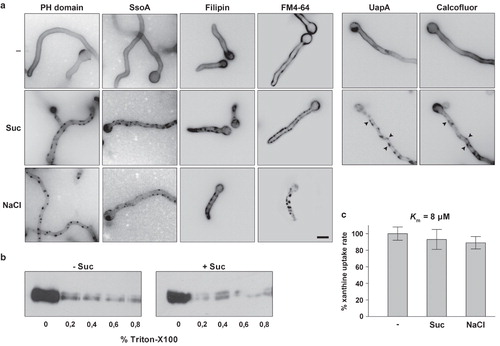
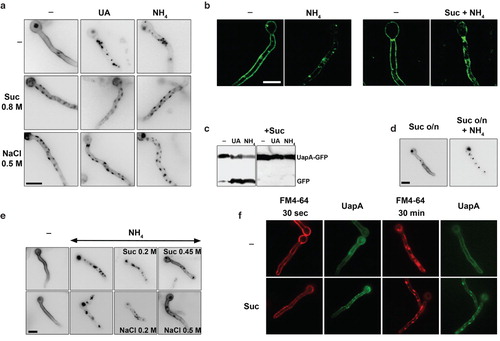
Figure 6. (a) Hypertonic media elicit a blockage of UapA-GFP endocytosis. In control samples UapA-GFP (alcAp -UapA-GFP) endocytosis is elicited upon transfer for 1h to standard media with either 1 mM uric acid (UA) or 20 mM ammonium ions (NH4) (Gournas et al. Citation2010). Under these conditions, UapA-GFP is internalized and degraded in the vacuoles (appearing as prominent fluorescent granules in the cytoplasm) through sorting in the MBV pathway. Here and in all subsequent Figures, unless otherwise stated, hypertonic conditions are imposed by transfer to standard media with 0.8 M sucrose or 0.5 M NaCl. Notice that after hypertonic treatment there are UapA-GFP cortical fluorescent patches but no vacuoles visible in conditions that normally lead to UapA-GFP turnover. (b) UapA-GFP (alcAp -UapA-GFP) endocytosis by ammonium in a control sample and blockage of UapA-GFP endocytosis by ammonium after hypertonic treatment, as seen with inverted confocal laser microscopy in a single hypha. (c) Western blot analysis of membrane protein fractions corresponding to 2 h addition of UA or NH4 and controls (–), probed with anti-GFP. The low mobility band corresponds to intact UapA-GFP (alcAp -UapA-GFP) and the high mobility band to free GFP produced through vacuolar degradation of UapA (see text). (d) Recovery of NH4-elicited endocytosis of UapA-GFP (alcAp -UapA-GFP) after prolonged growth (16 h) in hypertonic media. (e) Minimal concentrations of sucrose or NaCl blocking endocytosis. (f) Effect of hypertonic treatment on FM4-64 internalization. The strain used is alcAp -UapA-GFP. Control and hypertonic samples were treated as previously. Upon 15 min of staining on ice and 30 sec transfer to 25°C, FM4-64 labels only the plasma membrane, which appears uniform in control media but patchy after sucrose treatment. A practically identical labeling was obtained with UapA-GFP (left panels). After 30 min of incubation at 25° in untreated samples, FM4-64 still labeled the plasma membrane but was mostly localized in endosomal compartments. In sharp contrast, in sucrose treated samples, FM4-64 still labeled cortical patches associated with plasma membrane and no sign of internalization was evident. The cortical fluorescent patches labeled with FM4-64 are identical with those labeled with UapA-GFP (right panels).
Hypertonic media elicit transient blockage of endocytosis and growth arrest
Sucrose has been reported to be a specific clathrin-dependent inhibitor of receptor and transporter endocytosis in mammalian cells (Heuser and Anderson Citation1989). We tested whether sucrose or other hypertonic media have an effect on endocytosis of UapA-GFP. We have recently showed the existence of two distinct, but converging endocytic pathways concerning the turnover of UapA in response to the presence of NH4 + ions or substrates (uric acid or xanthine). The process of endocytosis can be easily monitored by epifluorescence or confocal microscopy and Western blot analysis using an anti-GFP antibody.
We observed that the addition of sucrose (0.8 M) or NaCl (0.5 M) prior to ammonium or uric acid abolished the endocytosis and turnover of UapA-GFP (, ). As expected, we also observed that in the presence of sucrose or NaCl, UapA-GFP molecules appeared in plasma membrane patches described earlier. The block in transporter endocytosis and turnover was confirmed by Western blot analysis, which showed the absence of free GFP in samples grown for the last hour in the presence of ammonium ions (NH4) or uric acid (UA) under hypertonic treatment (). The appearance of free GFP is a well-established marker of endocytosis and vacuolar turnover of UapA-GFP and other GFP-tagged transporters (Gournas et al. Citation2010). The blockage in UapA-GFP endocytosis is transient, as its internalization recovers with kinetics practically identical to those of patch disassembly after longer exposures to hypertonic media (). In addition, the minimal concentration of hypertonic solutes blocking UapA-GFP endocytosis was practically identical to that leading to plasmolysis (∼0.45 sucrose, ≥0.2 M NaCl) ().
Interestingly, shows that sucrose also blocked the constitutive internalization of the lipophilic marker FM4-64, strongly suggesting that tonicity has a global negative effect on both clathrin-mediated and fluid-phase endocytosis (discussed later).
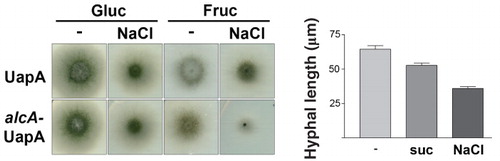
In the course of the experiments described above, we noticed a significant delay in growth rate in samples exposed to hypertonicity. shows that this delay is maximal in media containing a non-catabolic carbon source such as fructose (0.1%) (40% reduction in colony radius), while it is more moderate in carbon catabolite repressing (1% glucose) media (20% reduction). shows a quantification of this growth arrest expressed as reduction in average hyphal length after hypertonic treatment (20–40% reduction in germ tube length). The delay in growth recovered after longer exposures to hypertonic media, as did the appearance of fluorescent patches and the block in endocytosis (not shown).
Figure 7. Hypertonic media elicit growth arrest of A. nidulans. (a) Growth tests of two isogenic strains expressing UapA-GFP from either its native promoter (used for Figure 1) or from the alcA promoter (used for all other Figures). 0.5 NaCl was used for hypertonic treatment and tests were carried out in MM with fructose (0.1%) or glucose (1%), as carbon sources. NaCl led to a reduction of both the diameter of colonies and conidiospore production. The reduction of growth was stronger in fructose media. (b) Reduction of hyphal length upon addition of either 0.8 M sucrose or 0.5 M NaCl for 4 h in the strain expressing alcAp-UapA-GFP grown in fructose media.
Hypertonicity affects actin dynamics and thus blocks endocytosis
A block in endocytosis can occur at several steps concerning the formation and internalization of the endocytic vesicle. To address this question we examined how basic elements of this process are affected by tonicity. In particular, we examined the cellular organization of well-characterized upstream (SlaB) and downstream (AbpA) endocytic factors, as well as that of tropomyosin (TpmA), tagged with either GFP or mRFP, under standard or hypertonic growth conditions. SlaB (Araujo-Bazán et al. Citation2008) is a Sla2p S. cerevisiae orthologue (Wesp et al. Citation1997), which acts as a well-characterized endocytosis regulator involved in the formation of early actin patch components (Newpher et al. Citation2005). In particular, Sla2p regulates the association of the clathrin endocytic machinery with actin polymerization (Newpher and Lemmon Citation2006). AbpA (Araujo-Bazán et al. Citation2008) is true homologue of Abp1p in S. cerevisiae, which is a late endocytic vesicle formation component. It appears near the end of Sla2p lifetime, is localized exclusively at cortical endocytic actin filaments/patches (Huckaba et al. Citation2004, Quintero-Monzon et al. Citation2005) and does not associate with actin cables (Huckaba et al. Citation2004). In A. nidulans, AbpA and SlaB are strongly polarized in hyphae, forming a ring that embraces the hyphal tip, leaving an area of exclusion at the apex (Araujo-Bazán et al. Citation2008). AbpA localizes at highly motile and transient peripheral foci overlapping with actin patches, which predominate in the tip (Taheri-Talesh et al. Citation2008). SlaB also localizes at peripheral foci, but these are markedly more abundant and cortical than those of AbpA (Araujo-Bazán et al. Citation2008). Based on SlaB and AbpA cellular dynamics, it has been proposed that spatial association of exocytosis with endocytosis at the fungal tip underlies hyphal growth. Interestingly and unlike the case in S. cerevisiae, SlaB is an essential gene revealing a major role of endocytosis in filamentous fungal growth. Tropomyosin (TpmA) is a major actin-binding protein that regulates actin mechanics (Stewart Citation2001). A GFP-TpmA fusion has been used to image actin cables, which was not feasible with GFP-actin fusions, in A. nidulans (Pearson et al. Citation2004, Taheri-Talesh et al. Citation2008). GFP-TpmA is concentrated near the apex and at forming septa (Pearson et al. Citation2004, Taheri-Talesh et al. Citation2008), labels actin cables along the hyphae, but does not seem to co-localize with endocytic actin patches.
(upper panels) shows that, as expected, SlaB and AbpA form cortical foci which are mostly concentrated at the tip of hyphae, whereas TpmA has a rather diffuse localization in the cytosol, but also clearly labels actin cables along the hyphal axis and the tip region. The lower panels in show that neither sucrose nor NaCl affected the cortical and polar appearance of SlaB-GFP or AbpA-mRFP foci, whereas hypertonic media dramatically modified the cellular localization of GFP-TpmA. More specifically, fluorescence is not any longer associated with actin cables and the tips of hyphae, but is now apparent as diffuse cytosolic fluorescence and in scattered cortical foci along the axis of hyphae. This picture constitutes strong evidence that hypertonic media modify actin dynamics, rather than the formation of cortical endocytic complexes per se, probably through immediate actin depolymerization followed by rapid localized re-polymerization. A similar conclusion has been proposed for the effect of tonicity in plants (Komis et al. Citation2002).
Figure 8. Hypertonicity and Lat-B effects on actin dynamics and the endocytic machinery. (a) Cellular localization of SlaB, AbpA and of TpmA, tagged with either GFP or mRFP, under standard or hypertonic growth conditions. Samples were treated as previously described. SlaB-GFP and AbpA-mRFP form cortical foci which predominate at the tip of hyphae under all conditions. GFP-TpmA in standard conditions (–) labels diffusely the cytocol and more strongly actin-like cables along the hyphal length and the tip. In hypertonic conditions (Suc) labeling of the actin cables and the tip disappears and scattered cortical patches appear along the hyphal length. (b) Effect of Lat-B (50 μM) on the cellular localization of UapA (-GFP or -mRFP tagged) in standard (–), endocytic (NH4) or hypertonic (Suc) conditions. The effect of Lat-B on AbpA-GFP and SlaB-GFP was also examined as a control. Lat-B leads to the disassembly of all AbpA patches as expected (Araujo-Bazán et al. Citation2008), but has a minor effect on SlaB, as only the patches at the tip seem to disassemble. Lat-B has no effect on either the normal uniform localization of UapA in the plasma membrane in standard media (–) or on the appearance of UapA-specific fluorescent patches (plasmolysis) in hypertonic media (Lat-B + Suc and Lat-B + NaCl). In contrast, Lat-B blocked the internalization of UapA by NH4. Note that in the latter case, UapA cortical foci are also visible (highlighted with arrows).
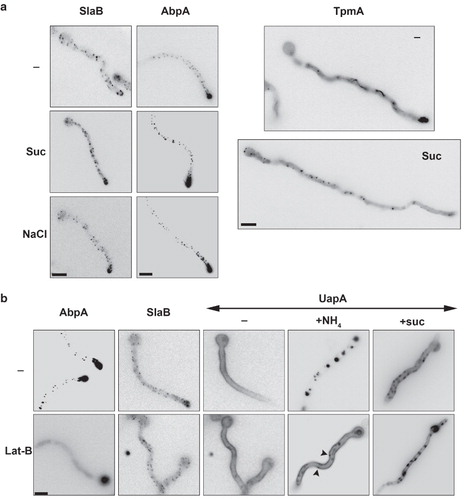
We also tested how actin depolymerization triggered by Latrunculin B (Lat-B) (Taheri-Talesh et al. Citation2008) affects plasmolysis and transporter endocytosis. As a control of Lat-B action, we followed its effect on AbpA, but also on SlaB. shows that Lat-B led to complete disassembly of AbpA patches, as expected (Pantazopoulou and Penalva Citation2009), but had a moderate apparent effect on SlaB patches, more evident at the tip. This might be due to the fact that, unlike AbpA, SlaB regulates F-actin polymerization but contains a PI(4,5)P2 binding domain that contributes to its plasma membrane localization. Lat-B had no effect on either the localization of UapA-GFP in the plasma membrane, or on the appearance of UapA-GFP cortical patches (plasmolysis), but blocked UapA-GFP endocytosis by ammonium (). Therefore, both hypertonicity and Lat-B blocked endocytosis, suggesting that hypertonicity, similarly to Lat-B, might act through an effect on actin dynamics.
Hypertonic conditions elicit similar phenomena in S. cerevisiae as in A. nidulans
We tried the effect of similar conditions and studied the response of S. cerevisiae to hypertonicity. In these studies, we used a strain expressing a functional GFP-tagged version of the lactate (Jen1p) permease, a transporter that in standard media labels uniformly the plasma membrane. Jen1p is endocytosed and degraded through the MVB pathway in response to the presence of a preferred carbon source such as glucose.
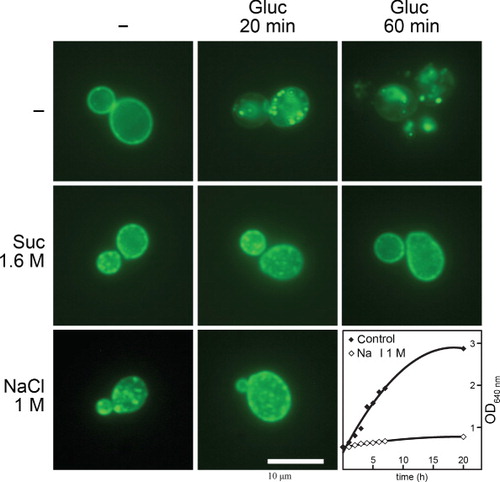
shows that both sucrose and NaCl lead to the appearance of prominent Jen1p-specific fluorescent patches. These patches are clearly distinguishable from the Fur4p-specific MCC foci observed in the standard media (see Introduction), the former being larger and extended towards the cytoplasm as expected for plasma membrane invaginations. In addition, also shows that under hypertonic conditions, the endocytosis of Jen1p by glucose is totally blocked. As in A. nidulans, patch appearance and blockage of endocytosis show similar kinetics and both phenomena recover after 10–14 h in hypertonic media (not shown). Finally, similarly to A. nidulans, hypertonic media elicited a growth arrest, which has also been observed by others (Slaninová et al. Citation2000, Hohmann et al. Citation2007). A notable difference between the response of the two fungi to hypertonicity was that S. cerevisiae proved more resistant than A. nidulans to tonicity, that is, two-fold higher concentrations of sucrose (1.6 M) or NaCl (1 M) were needed to elicit plasmolysis, blockage of endocytosis and growth arrest. Similar results were also obtained with a second S. cerevisiae transporter (Fur4p) (results not shown).
Figure 9. Hypertonic conditions elicit similar phenomena in S. cerevisiae as in A. nidulans. Epifluorescence microscopy images of a S. cerevisiae strain expressing a functional Jen1p-GFP chimeric transporter are shown. Jen1p-GFP is expressed uniformly in the plasma membrane under standard conditions of induction (–) but is rapidly internalized (20 min) and eventually degraded in the vacuole (60 min) upon addition of 1% glucose (Paiva et al. Citation2009). Hypertonic treatment (1.6 M sucrose or 1 M NaCl) for 1 min leads to the appearance of mostly cortical fluorescent patches and shows no evidence of internalization or degradation of Jen1p-GFP by glucose. The last panel shows the growth arrest elicited by addition of 1 M NaCl in the Jen1p-GFP strain at an OD640 nm of 0.5. For more technical details, see the Experimental section.
Discussion
Using several transporters and other membrane-associated markers tagged with GFP or mRFP, but also fluorescent lipophilic probes, we directly showed that various moderate (within the osmoregulatory range) hypertonic media lead to rapid localized plasmolysis, growth arrest and blockage of endocytosis in A. nidulans and S. cerevisiae. These phenomena are reversed within minutes when the hypertonic media are washed-out. If the hypertonic media persist, deplasmolysis and recovery of endocytosis initiate after 2–8 h, depending on tonicity strength, although full reversal might take up to 14 h. Recovery to normal growth rate is slower, but this depends on the fungus and the agent used to elicit hypertonicity (not shown).
The effects of hypertonic treatment on fungi have been extensively studied before. Yeast cells respond to increased tonicity by water loss, cell shrinkage, cessation of growth associated with diminished translational capacity, rapid closure of the glycerol export channel Fps1, remodeling of the actin cytoskeleton and a loss of cell polarity (for review, see Hohmann et al. Citation2007). The phenomena are transient and recover through gradual accumulation of solutes, mostly glycerol, as a consequence of the activation of genes of the so-called high-osmolarity glycerol (HOG) pathway. Similar responses have been observed in filamentous fungi, mostly Neurosporra crassa (Lew and Nasserifar Citation2009), but also in plants (Komis et al. Citation2002). A recent publication has shown that under extreme and persisting osmotic conditions (out of the osmoregulatory range) the plasma membrane of S. cerevisiae is functionally and structurally reorganized irreversibly, which in turn leads to cell death (Dupont et al. Citation2010). This work and two other publications in fungi (Kelavkar et al. Citation1993, Slaninová et al. Citation2000) have shown that responses to different degrees of hypertonic treatment include the rapid formation of deep plasma membrane invaginations or localized plasmolysis.
Our work strongly supports, by in vivo direct approaches, the previous findings concerning two major responses of fungi to moderate hypertonic media: first, the partial or localized plasmolysis and shrinkage of cells due to water loss, and second, growth arrest. It further investigates the specificity and kinetics of these effects, showing that plasmolysis is practically immediate (<1 min), tonicity-dependent rather than solute-dependent, never complete, reversible and transient, whereas growth arrest is also transient, but slower to recover than plasmolysis. Furthermore, we show for the first time, that the invaginated part of the membrane does not seem to have a distinct lipid composition, and that transporters embedded in it are fully functional. The first conclusion arises from in vivo microscopic evidence using specific lipophilic markers (Filipin, FM4-64 and the PI(4,5)P2-binding marker (a duplication of the PH domain of PLC-δ1) and biochemical evidence showing that transporter membrane-extractability is not affected by hypertonic treatment. The second conclusion came from direct transport kinetics measurements using radiolabelled substrates. Furthermore, transporter-mediated uptake assays showed that there is no diffusion of radiolabelled substrates within the cells, a strong indication that the A. nidulans plasma membrane and lipid composition remain intact under the hypertonic treatment used. Thus, although the originally observed patches using GFP-tagged transporters resembled specific plasma membrane microdomains, such as the yeast MCC or MCP compartments, which all host transporters, they proved not to be so. The simplest explanation of the apparent fluorescence accumulation detected by using FM4-64, filipin, SsoA or the PH domain markers is an increase in plasma membrane surface due to infoldings.
We also directly showed that hypertonicity totally but transiently blocks the endocytosis of transporters. Several lines of evidence strongly support that this is due to a rapid effect of hypertonicity on actin dynamics, rather than due to the direct abolishment of clustering of cargoes in coated pits or the initial formation of membrane-associated endocytic complexes. Firstly, hypertonicity altered dramatically and rapidly the cellular localization of tropomyosin (GFP-TpmA), but not that of the endocytic cortical markers SlaB and AbpA, which act upstream from the pinching-off of endocytic vesicles. Using the GFP-TpmA marker, we detect the rapid disassembly of actin cables, which constitute the major machinery for the internalization of endocytic vesicles. Secondly, hypertonicity blocked the endocytosis of FM4-64, a marker of bulk fluid-phase endocytosis which, to our knowledge, operates by an actin-dependent but also a coated pit-independent mechanism (Vida and Emr Citation1995). In line with this observation, Dupont et al. (Citation2010) have shown a similar block of FM4-64 endocytosis in yeast cells exposed to moderate hypertonic media. Thirdly, the abolishment of ammonium-elicited UapA-GFP endocytosis by Lat-B is also in line with an effect on actin dynamics. Despite the fact that this drug has a global effect on actin filament polymerization and thus the endocytic machinery, we noticed that in Lat-B treated cells exposed to ammonium ions, UapA-GFP, in addition to a uniform labeling of the plasma membrane, also appears in cortical foci. This observation suggests that UapA-GFP might well be clustered in upstream endocytic complexes/pre-vesicles, but these cannot be internalized. Thus, the simplest interpretation of our results is that hypertonicity elicits the modification of actin mechanics, rather than interfering with cargo clustering in cortical endocytic complexes. The observation that upon hypertonic treatment cables disappear and the actin patches redistribute over the cortex of hyphae has also been observed in S. cerevisiae (Slaninová et al. Citation2000) and plants (Komis et al. Citation2002). Evidently, the blockage of Jen1p endocytosis by hypertonic treatment in yeast, shown in , should also take place through modification of actin dynamics.
Previous reports in vertebrate cells have shown that hypertonic media inhibit receptor-mediated endocytosis (Daukas et al. Citation1983, Larkin et al. Citation1986, Heuser and Anderson Citation1989). In polymorphonuclear leukocytes, hypertonic media inhibited receptor-mediated uptake of the chemotactic peptide N-formylnorleucylleucylphenylalanine. Furthermore, it was shown that hypertonic medium prevented the clustering of surface molecules as indicated by the inhibition of capping of fluorescent concanavalin A (Daukas et al. Citation1983). In human and chicken fibroblasts, TEM analysis has shown that hypertonic cells display empty clathrin ‘microcages’ rather than normal coated pit lattices, with concomitant loss of normally clustered low density lipoprotein (LDL) receptors observed in untreated cells. Upon return to normal medium, these changes reverse. The authors propose that hypertonic treatment causes coated pits to disintegrate, while clathrin becomes unavailable and endocytosis is blocked (Heuser and Anderson Citation1989). Clathrin is important for normal actin dynamics and progression of SlaB/Sla2p-containing patches during endocytosis in yeast (Newpher and Lemmon Citation2006). Thus, we cannot formally exclude that hypertonic media also have a negative effect on clathrin function in fungi. However, unlike vertebrate cells where fluid-phase endocytosis and endosome turnover, detected by FM4-64, is not blocked by hypertonicity, in A. nidulans FM4-64 internalization is totally blocked by both sucrose and NaCl, a result incompatible with a sole effect on clathrin. Of course, our results might also reflect differences in the molecular mechanisms employed by fungal (or plant) cells, compared to animal cells, to respond to hypertonicity.
Last but not least, this work establishes that moderate hypertonic treatment (within the osmoregulatory range) constitutes a transient and reversible physiological inhibitor of fungal endocytosis. A similar block in endocytosis seems to occur in vertebrates and we predict that a similar situation might take place in plants. This is of primary importance for research in systems, such as A. nidulans and other filamentous fungi or even more complex cells, where genetic blocks in endocytosis and in cargo trafficking are usually lethal. Blocking endocytosis by sucrose or NaCl will permit us to ask novel questions on transporter trafficking, recycling and turnover through alternative pathways. We are currently using this approach for studying the direct sorting of transporters from the Golgi to the vacuole and how this is affected by lipid composition.
Acknowledgements
We are extremely grateful to Dr Areti Pantazopoulou for critical discussions, her help in microscopy and for performing the deconvolution analysis of images at CSIC/CIB (Madrid), and to Dr Miguel Angel Peňalva (CSIC/CIB) for critical discussions and sharing molecular markers and strains. We thank the students Andreas Pavlides and Fivos Borbolis (Faculty of Biology, University of Athens) for preliminary experiments in initial stages of this work. We thank Prof. Margarida Casal for her generous hospitality at her lab in Universidade do Minho (Braga, Portugal), where part of this work was carried out during a sabbatical of GD and Erasmus visits of MK and VB. We also thank Mrs Goretti for her technical help with the confocal microscope at the Medical School of Universidade do Minho and Dr Berl Oakley (Ohio State University) for the GFP-TpmA strain, Prof. R. Haguenauer-Tsapis (Institut Jacques Monod, Paris VII) and Assoc. Prof. S. Paiva (Universidade do Minho) for the Fur4p-GFP and Jen1p-GFP strains, respectively. We also thank Dr Sotiris Amillis for help in making the Figures and Dr Herlander Azevedo (Universidade do Minho), Prof. Basil Galatis and Ass. Prof. Panagiotis Apostolakos (Faculty of Biology, University of Athens) for helpful discussions. Finally, we thank Prof. Claudio Scazzocchio (Imperial College) for comments on the manuscript and the unknown referee who suggested to us an important recent publication relevant to this work. C.G was supported by I.K.Y.
Declaration of interest: This work was carried out through a minimal support from Athens University and the Erasmus program.
References
- Abenza JF, Galindo A, Pantazopoulou A, Gil C, De Los Ríos V, Peñalva MA. 2010. Aspergillus RabBRab5 integrates acquisition of degradative identity with the long distance movement of early endosomes. Mol Biol Cell 21:2756–2769. PMID: 20534811.
- Amillis S, Cecchetto G, Sophianopoulou V, Koukaki M, Scazzocchio C, Diallinas G. 2004. Transcription of purine transporter genes is activated during the isotropic growth phase of Aspergillus nidulans conidia. Mol Microbiol 52:205–216.
- Amillis S, Hamari Z, Roumelioti K, Scazzocchio C, Diallinas G. 2007. Regulation of expression and kinetic modeling of substrate interactions of a uracil transporter in Aspergillus nidulans. Mol Membr Biol 24:206–214.
- André B, Haguenauer-Tsapis R. 2004. Membrane trafficking of yeast transporters: Mechanisms and physiological control of downregulation. Top Curr Genet 273–323.
- Apostolaki A, Erpapazoglou Z, Harispe L, Billini M, Kafasla P, Kizis D, Penalva MA, Scazzocchio C, Sophianopoulou V. 2009. AgtA, the dicarboxylic amino acid transporter of Aspergillus nidulans, is concertedly down-regulated by exquisite sensitivity to nitrogen metabolite repression and ammonium-elicited endocytosis. Eukaryot Cell 8:339–352.
- Araujo-Bazán L, Penalva MA, Espeso EA. 2008. Preferential localization of the endocytic internalization machinery to hyphal tips underlies polarization of the actin cytoskeleton in Aspergillus nidulans. Mol Microbiol 67:891–905.
- Belgareh-Touze N, Leon S, Erpapazoglou Z, Stawiecka-Mirota M, Urban-Grimal D, Haguenauer-Tsapis R. 2008. Versatile role of the yeast ubiquitin ligase Rsp5p in intracellular trafficking. Biochem Soc Trans 36:791–796.
- Blondel MO, Morvan J, Dupré S, Urban-Grimal D, Haguenauer-Tsapis R, Volland C. 2004. Direct sorting of the yeast uracil permease to the endosomal system is controlled by uracil binding and Rsp5p-dependent ubiquitylation. Mol Biol Cell 15:883–895.
- Cecchetto G, Amillis S, Diallinas G, Scazzocchio C, Drevet C. 2004. The AzgA purine transporter of Aspergillus nidulans. Characterization of a protein belonging to a new phylogenetic cluster. J Biol Chem 279:3132–3141.
- Daukas G, Lauffenburger DA, Zigmond S. 1983. Reversible pinocytosis in polymorphonuclear leukocytes. J Cell Biol 96:1642–1650.
- Diallinas G. 2008. Biochemistry. An almost-complete movie. Science 322:1644–1645.
- Dupont S, Beney L, Ritt JF, Lherminier J, Gervais P. 2010. Lateral reorganization of plasma membrane is involved in the yeast resistance to severe dehydration. Biochim Biophys Acta 1798:975–985.
- Dupré S, Haguenauer-Tsapis R. 2003. Raft partitioning of the yeast uracil permease during trafficking along the endocytic pathway. Traffic 4:83–96.
- Dupré S, Urban-Grimal D, Haguenauer-Tsapis R. 2004. Ubiquitin and endocytic internalization in yeast and animal cells. Biochim Biophys Acta 1695:89–111.
- Erpapazoglou Z, Froissard M, Nondier I, Lesuisse E, Haguenauer-Tsapis R, Belgareh-Touze N. 2008. Substrate- and ubiquitin-dependent trafficking of the yeast siderophore transporter Sit1. Traffic 9:1372–1391.
- Forment JV, Flipphi M, Ramon D, Ventura L, Maccabe AP. 2006. Identification of the mstE gene encoding a glucose-inducible, low affinity glucose transporter in Aspergillus nidulans. J Biol Chem 281:8339–8346.
- Gorfinkiel L, Diallinas G, Scazzocchio C. 1993. Sequence and regulation of the uapA gene encoding a uric acid-xanthine permease in the fungus Aspergillus nidulans. J Biol Chem 268:23376–2381.
- Gournas C, Amillis S, Vlanti A, Diallinas G. 2010. Transport-dependent endocytosis and turnover of a uric acid-xanthine permease. Mol Microbiol 75:246–260.
- Grossmann G, Opekarova M, Malinsky J, Weig-Meckl I, Tanner W. 2007. Membrane potential governs lateral segregation of plasma membrane proteins and lipids in yeast. EMBO J 26:1–8.
- Grossmann G, Malinsky J, Stahlschmidt W, Loibl M, Weig-Meckl I, Frommer WB, Opekarová M, Tanner W. 2008. Plasma membrane microdomains regulate turnover of transport proteins in yeast. J Cell Biol 183:1075–1088.
- Grossmann G, Opekarova M, Novakova L, Stolz J, Tanner W. 2006. Lipid raft-based membrane compartmentation of a plant transport protein expressed in Saccharomyces cerevisiae. Eukaryot Cell 5:945–953.
- Helliwell SB, Losko S, Kaiser CA. 2001. Components of a ubiquitin ligase complex specify polyubiquitination and intracellular trafficking of the general amino acid permease. J Cell Biol 153:649–662.
- Heuser JE, Anderson RG. 1989. Hypertonic media inhibit receptor-mediated endocytosis by blocking clathrin-coated pit formation. J Cell Biol 108:389–400.
- Hohmann S, Krantz M, Nordlander B. 2007. Yeast osmoregulation. Methods Enzymol 428:29–45.
- Huckaba TM, Gay AC, Pantalena LF, Yang HC, Pon LA. 2004. Live cell imaging of the assembly, disassembly, and actin cable-dependent movement of endosomes and actin patches in the budding yeast, Saccharomyces cerevisiae. J Cell Biol 167:519–530.
- Kelavkar U, Rao KS, Ghhatpar HS. 1993. Sodium chloride stress induced morphological and ultrastructural changes in Aspergillus repens. Indian J Exp Biol 31:511–515.
- Komis G, Apostolakos P, Galatis B. 2002. Hyperosmotic stress-induced actin filament reorganization in leaf cells of Chlorophyton comosum. J Exp Bot 53:1699–1710.
- Koukaki M, Vlanti A, Goudela S, Pantazopoulou A, Gioule H, Tournaviti S, Diallinas G. 2005. The nucleobase-ascorbate transporter (NAT) signature motif in UapA defines the function of the purine translocation pathway. J Mol Biol 350:499–513.
- Larkin JM, Donzell WC, Anderson RG. 1986. Potassium-dependent assembly of coated pits: New coated pits form as planar clathrin lattices. J Cell Biol 103:2619–2627.
- Leung J, Karachaliou M, Alves C, Diallinas G, Byrne B. 2010. Expression and purification of a functional uric acid-xanthine transporter (UapA). Protein Expr Purif 72:139–146.
- Lew RR, Nasserifar S. 2009. Transient responses during hyperosmotic shock in the filamentous fungus Neurospora crassa. Microbiology 155:903–911.
- Malinska K, Malinsky J, Opekarova M, Tanner W. 2003. Visualization of protein compartmentation within the plasma membrane of living yeast cells. Mol Biol Cell 14:4427–4436.
- Malinska K, Malinsky J, Opekarova M, Tanner W. 2004. Distribution of Can1p into stable domains reflects lateral protein segregation within the plasma membrane of living S. cerevisiae cells. J Cell Sci 117:6031–6041.
- Newpher TM, Lemmon SK. 2006. Clathrin is important for normal actin dynamics and progression of Sla2p-containing patches during endocytosis in yeast. Traffic 7:574–588.
- Newpher TM, Smith RP, Lemmon V, Lemmon SK. 2005. In vivo dynamics of clathrin and its adaptor-dependent recruitment to the actin-based endocytic machinery in yeast. Dev Cell 9:87–98.
- Paiva S, Vieira N, Nondier I, Haguenauer-Tsapis R, Casal M, Urban-Grimal D. 2009. Glucose-induced ubiquitylation and endocytosis of the yeast Jen1 transporter: Role of lysine 63-linked ubiquitin chains. J Biol Chem 284:19228–19236.
- Pantazopoulou A, Diallinas G. 2007. Fungal nucleobase transporters. FEMS Microbiol Rev 31:657–675.
- Pantazopoulou A, Lemuh ND, Hatzinikolaou DG, Drevet C, Cecchetto G, Scazzocchio C, Diallinas G. 2007. Differential physiological and developmental expression of the UapA and AzgA purine transporters in Aspergillus nidulans. Fungal Genet Biol 44:627–640.
- Pantazopoulou A. Penalva MA. 2009. Organization and dynamics of the Aspergillus nidulans Golgi during apical extension and mitosis. Mol Biol Cell 20:4335–4347.
- Papageorgiou I, Gournas C, Vlanti A, Amillis S, Pantazopoulou A, Diallinas G. 2008. Specific interdomain synergy in the UapA transporter determines its unique specificity for uric acid among NAT carriers. J Mol Biol 382:1121–1135.
- Pearson CL, Xu K, Sharpless KE, Harris SD. 2004. MesA, a novel fungal protein required for the stabilization of polarity axes in Aspergillus nidulans. Mol Biol Cell 15:3658–3672.
- Penalva MA. 2005. Tracing the endocytic pathway of Aspergillus nidulans with FM4-64. Fungal Genet Biol 42:963–975.
- Quintero-Monzon O, Rodal AA, Strokopytov B, Almo SC, Goode BL. 2005. Structural and functional dissection of the Abp1 ADFH actin-binding domain reveals versatile in vivo adapter functions. Mol Biol Cell 16:3128–3139.
- Reggiori F, Pelham HR. 2002. A transmembrane ubiquitin ligase required to sort membrane proteins into multivesicular bodies. Nat Cell Biol 4:117–123.
- Rodríguez-Galán O, Galindo A, Hervás-Aguilar A, Arst HN Jr, Peñalva MA. 2009. Physiological involvement in pH signaling of Vps24-mediated recruitment of Aspergillus PalB cysteine protease to ESCRT-III. J Biol Chem 284:4404–4412.
- Slaninová I, Sestak S, Svoboda A, Farkas V. 2000. Cell wall and cytoskeleton reorganization as the response to hyperosmotic shock in Saccharomyces cerevisiae. Arch Microbiol 173:245–252.
- Soetens O, De Craene JO, Andre B. 2001. Ubiquitin is required for sorting to the vacuole of the yeast general amino acid permease, Gap1. J Biol Chem 276:43949–43957.
- Stewart M. 2001. Structural basis for bending tropomyosin around actin in muscle thin filaments. Proc Natl Acad Sci USA 98:8165–8166.
- Strádalová V, Stahlschmidt W, Grossmann G, Blazikova M, Rachel R, Tanner W, Malinsky J. 2009. Furrow-like invaginations of the yeast plasma membrane correspond to membrane compartment of Can1. J Cell Sci 122:2887–2894.
- Taheri-Talesh N, Horio T, Araujo-Bazán L, Dou X, Espeso EA, Penalva MA, Osmani SA, Oakley BR. 2008. The tip growth apparatus of Aspergillus nidulans. Mol Biol Cell 19:1439–1449.
- Takeshita N, Higashitsuji Y, Konzack S, Fischer R. 2008. Apical sterol-rich membranes are essential for localizing cell end markers that determine growth directionality in the filamentous fungus Aspergillus nidulans. Mol Biol Cell 19:339–351.
- Tavoularis S, Scazzocchio C, Sophianopoulou V. 2001. Functional expression and cellular localization of a green fluorescent protein-tagged proline transporter in Aspergillus nidulans. Fungal Genet Biol 33:115–125.
- Tazebay UH, Sophianopoulou V, Scazzocchio C, Diallinas G. 1997. The gene encoding the major proline transporter of Aspergillus nidulans is upregulated during conidiospore germination and in response to proline induction and amino acid starvation. Mol Microbiol 24:105–117.
- Umebayashi K, Nakano A. 2003. Ergosterol is required for targeting of tryptophan permease to the yeast plasma membrane. J Cell Biol 161:1117–1131.
- Valdez-Taubas J, Harispe L, Scazzocchio C, Gorfinkiel L, Rosa AL. 2004. Ammonium-induced internalisation of UapC, the general purine permease from Aspergillus nidulans. Fungal Genet Biol 41:42–51.
- Vida TA, Emr SD. 1995. A new vital stain for visualizing vacuolar membrane dynamics and endocytosis in yeast. J Cell Biol 128:779–792.
- Vlanti A, Diallinas G. 2008. The Aspergillus nidulans FcyB cytosine-purine scavenger is highly expressed during germination and in reproductive compartments and is downregulated by endocytosis. Mol Microbiol 68:959–977.
- Walther TC, Brickner JH, Aguilar PS, Bernales S, Pantoja C, Walter P. 2006. Eisosomes mark static sites of endocytosis. Nature 439:998–1003.
- Wesp A, Hicke L, Palecek J, Lombardi R, Aust T, Munn AL, Riezman H. 1997. End4p/Sla2p interacts with actin-associated proteins for endocytosis in Saccharomyces cerevisiae. Mol Biol Cell 8:2291–2306.