Abstract
Cingulin (CGN) and paracingulin (CGNL1) are structurally related proteins that regulate Rho family GTPases by recruiting guanine nucleotide exchange factors to epithelial junctions. Although the subcellular localization of cingulin and paracingulin is likely to be essential for their role as adaptor proteins, nothing is known on their in vivo localization, and their dynamics of exchange with the junctional membrane. To address these questions, we generated stable clones of MDCK cells expressing fluorescently tagged cingulin and paracingulin. By FRAP analysis, cingulin and paracingulin show a very similar dynamic behaviour, with recovery curves and mobile fractions that are distinct from ZO-1, and indicate a rapid exchange with a cytosolic pool. Interestingly, only paracingulin, but not cingulin, is peripherally localized in isolated cells, requires the integrity of the microtubule cytoskeleton to be stably anchored to junctions, and associates with E-cadherin. In contrast, both proteins require the integrity of the actin cytoskeleton to maintain their junctional localization. Although cingulin and paracingulin form a complex and can interact in vitro, the junctional recruitment and the dynamics of membrane exchange of paracingulin is independent of cingulin, and vice-versa. In summary, cingulin and paracingulin show a similar dynamic behaviour, but partially distinct localizations and functional interactions with the cytoskeleton, and are recruited independently to junctions.
Introduction
The apicolateral membrane of vertebrate epithelial cells is characterized by a junctional complex that comprises tight junctions (TJs), adherens junctions (AJs) and desmosomes (Farquhar and Palade Citation1963). While AJs play fundamental roles in tissue-specific cell-cell adhesion and recognition (Wheelock and Johnson Citation2003, Halbleib and Nelson Citation2006), TJs serve as barriers to diffusion of molecules across the paracellular pathway, and define the border between apical and basolateral domains of the plasma membrane (Anderson et al. Citation2004, Shin et al. Citation2006). At the molecular level, junctions comprise transmembrane, cytoplasmic plaque and cytoskeletal proteins (Mitic and Anderson Citation1998, Schneeberger and Lynch Citation2004, Furuse and Tsukita Citation2006, Takai et al. Citation2008, Meng and Takeichi Citation2009). In addition to their canonical functions, AJs and TJs serve as signalling centres that control cell architecture and gene expression, through an array of adaptor and signalling molecules, including transcription factors, guanine nucleotide exchange factors, and polarity complex proteins (Perez-Moreno et al. Citation2003, Gumbiner Citation2005, Matter et al. Citation2005, Gonzalez-Mariscal et al. Citation2008, Guillemot et al. Citation2008b).
The actomyosin cytoskeleton plays a critical role in the function of both TJs and AJs (Madara Citation1987, Turner Citation2000, Jamora and Fuchs Citation2002, Nelson et al. Citation2005). With regards to the microtubule cytoskeleton, however, molecular links have so far been described only for adherens-type junctions, and not TJs (Lechler and Fuchs Citation2007, Meng et al. Citation2008). The cytoskeleton stabilizes cell-cell junctions, and, in turn, junctional proteins regulate the architecture of the cytoskeleton, through factors that control its polymerization and contractility, such as Rho GTPases (Jou et al. Citation1998, Etienne-Manneville and Hall Citation2002, Braga and Yap Citation2005, Samarin and Nusrat Citation2009). The interplay of cytoskeleton and junctional protein dynamics ultimately orchestrates cell shape, motility, and epithelial morphogenesis.
The assembly of multiprotein complexes at TJs and AJs must be precisely regulated, to control adhesion, barrier function, and recruitment of signalling proteins. However, little is known on the dynamics of junctional proteins in live cells, and their redistribution during key cellular events, such as mitosis. A powerful tool to investigate the dynamics of proteins is the imaging of proteins fused to fluorescent tags in live cells. For the TJ protein ZO-1, a fusion construct with GFP shows the same distribution pattern and response to experimental treatments as the endogenous protein, indicating that the GFP moiety does not interfere with the physiological role of ZO-1 (Riesen et al. Citation2002, Shen and Turner Citation2005). Similarly, fusions of GFP to the amino terminus of occludin, claudin-1 and cingulin generate proteins that accurately track the location of endogenous proteins (Paschoud and Citi Citation2008, Shen et al. Citation2008). Recent fluorescence recovery after photobleaching (FRAP) and fluorescence loss in photobleaching (FLIP) analyses show that occludin, ZO-1 and claudin-1 each exhibit distinct behaviours, which are dependent on cell confluence, membrane composition, metabolic energy, and contractility of the actomyosin cytoskeleton (Shen et al. Citation2008, Yu et al. Citation2010). It remains to be determined whether cytoplasmic TJ proteins, distinct from ZO-1, have dynamic behaviour that is similar or distinct from ZO-1.
Cingulin and paracingulin (also known as cingulin-like protein, CGNL1, and JACOP) share a similar structural domain organization, comprising globular head, coiled-coil rod, and globular tail domains (Citi et al. Citation1988, Cordenonsi et al. Citation1999, Ohnishi et al. Citation2004, Guillemot and Citi Citation2006b). While cingulin is exclusively localized in the cytoplasmic face of TJs (Citi et al. Citation1988, Citation1989), paracingulin has been detected both at TJs and at AJs, depending on cell type (Ohnishi et al. Citation2004). Cingulin interacts with several TJ proteins (Cordenonsi et al. Citation1999, Bazzoni et al. Citation2000, D'Atri and Citi Citation2001), but it is not known whether cingulin forms a complex with paracingulin in the cytoplasm, or is required for its junctional recruitment. Depletion of either cingulin or paracingulin from MDCK cells indicates that neither protein is involved in the maintenance of TJ organization, but both proteins function as signalling adaptors to regulate RhoA activity in confluent monolayers (Guillemot et al. Citation2004, Aijaz et al. Citation2005, Guillemot and Citi Citation2006a). In addition, paracingulin regulates Rac1 activity during junction assembly (Guillemot et al. Citation2008a). These activities are mediated by the interaction of cingulin with GEF-H1, and paracingulin with GEF-H1 and Tiam1 (Aijaz et al. Citation2005, Guillemot and Citi Citation2006a, Guillemot et al. Citation2008a). Although the subcellular localization and exchange dynamics of cingulin and paracingulin is likely to be of key importance in the spatial and temporal regulation of Rho family GTPases, nothing is known about their dynamic behaviour. Here, we address this question, by investigating the in vivo dynamics of fluorescently tagged cingulin and paracingulin in live MDCK cells. Furthermore, we examine the role of the actin and microtubule cytoskeletons in the maintenance of the junctional localization of cingulin and paracingulin, and we examine the interaction and functional interdependence of cingulin and paracingulin. Our results illustrate similar and distinct behaviours and molecular interactions of cingulin and paracingulin, and demonstrate that cingulin and paracingulin are recruited independently to junctions.
Methods
Cloning of full-length canine paracingulin
The canine paracingulin cDNA was obtained by reverse-transcription PCR of 5 μg of RNA (RNeasy mini kit, Qiagen), using 200U of superscriptII Reverse Transcriptase. To generate cDNAs coding for either the rod + tail or head domains, we used as primers either 5′-GGCCCTGTGACATGTGAC-3′ or 5′-AGCTTCTCATTCTCCTCC-3′, respectively. RNA was digested (2U Ribonuclease H, 20 min at 37°C), and the cDNA was amplified using the Expand High Fidelity PCR Kit (Roche) and the following primers: 5′-AGACAGCGGCCGCATGGAGCTGTATTTCGGC-3′ and 5′-CGCGGATCCATTTCAGCCCCCAGCTG-3′ for the head domain; 5′-AGACAGCGGCCGCCAGACTTTAAAGTCTCGAGC-3′ and 5′-ATCCAGGTGTCGACGATCTGGCTGGTGGCAGCG-3′ for the rod + tail domain. The full length cDNA was reconstituted in pBluescript, with the addition of an AccI site at its 3′ end.
Plasmid constructions
The construct for inducible expression of GFP-CGN-myc protein was described (Paschoud and Citi Citation2008). The construct for expression of YFP-CGNL1-myc was obtained by cloning the full-length canine paracingulin sequence into the NotI-ClaI sites of the GFP-CGN-myc construct in pBluescript (where the CGN sequence was previously excised by digestion), followed by replacing the GFP sequence with the YFP sequence (BamHI-NotI sites). Next, the YFP-CGNL1-myc sequence was subcloned into pTRE2Hyg (BamHI-SalI).
Cell culture, transfection and treatment with drugs
MDCKII (Madin-Darby Canine Kidney) Tet-off epithelial cells (Clontech) were cultured in Dulbecco's modified Eagle's medium (DMEM, Sigma) containing 10% fetal bovine serum (FBS), 1×MEM non-essential amino acids and 1 μg/ml puromycin (Sigma). Mouse kidney epithelial cells (C14 = mpkCCDc14, a gift of E. Feraille, University of Geneva) were cultured in 1:1 DMEM/HAMF12 medium, containing 5 μg/ml insulin, 50 nM dexamethasone, 60 nM selenium, 5 μg/ml transferrin, 1 nM triiodothyronine, 10 ng/ml EGF, 20 mM HEPES, 2 mM glutamine, 10% fetal bovine serum (FBS) and 20 mM D-glucose.
Cells transfected with Lipofectamine 2000 (Invitrogen) were selected with either 350 μg/ml hygromycin (pTRE2-hyg vector) or 600 μg/ml zeocin (pcDNA3.1/Zeo(+) vector). Transgene expression in Tet-off cells (cultured in 40 ng/ml doxycyclin) was induced by growth in doxycyclin-free medium for three days. Clones were isolated using cloning rings. Cells on coverslips were treated either with latrunculin B (Calbiochem 428020, 5 μM) for 30 min, or nocodazole (Sigma M-1404, 100 μM) for 2 h.
Live cell microscopy and time-lapse imaging
For time-lapse microscopy, 100,000 cells were seeded in WillCo-dish glass bottom (WillCo Wells BV, Amsterdam, The Netherlands) (diameter 22 mm), and allowed to attach for 6 h. The dish was placed in a 37°C chamber equilibrated with air containing 5% CO2, for observation using a Leica AS MDW (for GFP) or AF6000 LX (for YFP) microscopes, equipped with a 63 × 1.3 Glyc objective. Images were captured every 10–15 min for 16–24 h. Excitation wavelengths were 489 nm, and 490–510 nm for GFP and YFP, respectively, and images were captured using appropriate filtercubes from Leica. We used the maximal illumination conditions that did not impair cell viability (250 millisec with 40 z-stacks for GFP, and 91 millisec with 8 z-stacks for YFP). Images were deconvoluted with autodeblur software (Media Cybernetics) and z-stacks with the selected appropriate structures were projected onto one plane with the maximal projection algorythm (ImageJ software). Movies were generated with ImageJ.
Immunofluorescence
MDCK cells on coverslips were fixed either with −20°C methanol for 10 min, or with 3% paraformaldehyde, 0.1% Triton (3 min) followed by 3% paraformaldehyde (20 min). For tubulin staining, cells were fixed with 1% paraformaldehyde in Microtubule-Stabilizing-Buffer (MTSB: 0.1 M PIPES, 1mM EGTA, 4% PEG-8000, pH 6.9), followed by permeabilization in 1% paraformaldehyde, 0.1% Triton X-100 in MTSB. After washing with PBS, cells were incubated with primary antibodies (30°C for 45 min): cingulin (Invitrogen rabbit 3644-01 1:500, Invitrogen mouse 37-4300 1:20), paracingulin (in-house affinity purified rabbit 20893 1:5, Invitrogen mouse 39-8900 1:20), ZO-1 (Invitrogen mouse 33-9100, 1:40), E-cadherin (BD mouse 610181, 1:250), phalloidin-TRITC (Sigma P1951, 1:1 000), α-tubulin (Zymed 32-2500, 1:100). After washing in PBS (3 × 5 min) cells were incubated with secondary antibodies (37°C for 30 min): FITC-anti-mouse and CY3-anti-rabbit (Jackson Labs, 1:200). Coverslips were mounted in Vectashield medium containing DAPI (Vector Labs) and images were acquired using a Zeiss510 Meta confocal microscope in multi-tracking mode.
FRAP microscopy and data analysis
FRAP was performed on a DM4000 microscope (Leica Microsystems, Bannockburn, IL, USA) equipped with a MicroPoint Laser System (Photonic Instruments, St Charles, IL, USA), a Roper Coolsnap HQ camera (Princeton Instruments, Trenton, NJ, USA), and a Leica 63X HCX PL APO L U-V-I aqueous immersion objective controlled by MetaMorph 7 (Molecular Devices, Downingtown, PA, USA). Confluent monolayers of stable cell lines expressing fluorescently-tagged proteins were studied three days after confluence after transfer to bicarbonate-free HBSS supplemented with 15 mM Hepes, pH 7.4, and mounted on a custom-designed temperature-controlled stage (Brook Industries, Lake Villa, IL, USA) at 37°C for 30 min prior to study. Where indicated, methyl-β-cyclodextrin was used at 5 mM for 30 min before FRAP. For FRAP analysis of GFP-cingulin and YFP-CGNL1 in CGNL1-kd cells and CGN-kd cells, respectively, we used transiently transfected cells. Data analysis and computer simulations were performed as described previously (Shen et al. Citation2008). In the model, the cellular structures are defined as mutually exclusive compartments within the cells, as well as membranes that separate them. The compartments represent three-dimensional volumetric regions while the membranes represent two-dimensional surfaces separating the compartments. Each compartment contains molecular species and a collection of reactions that describe the biochemical behaviour of those species within that compartment. The diffusion of cingulin and paracingulin are modeled as exchange between the cytoplasmic compartment and membrane. The complete details of the model can be accessed under the public models/dyu/cingulin final, within the «BioModel Database » (Shared Models) panel. To view the model, the vcell program can be downloaded at http://www.nrcam.uchc.edu/vcell_software/login.html, and an account can be created with no charge.
Coimmunoprecipitation and immunoblotting
For immunoprecipitations, cells were washed twice in ice-cold PBS, and lysed in coimmunoprecipitation buffer (150 mM NaCl, 20 mM Tris-HCl pH 7.5, 1% NP-40, 1 mM EDTA and complete protease inhibitor) for 15 min at 4°C. Lysates were clarified by centrifugation for 15 min at 13,000 rpm. Antibodies (rabbit anti-cingulin, rabbit anti-paracingulin, mouse anti-GFP monoclonal (in-house 18-1-4-18), anti-HA (Covance 16B12)) were incubated with 20 μl of pre-washed G-protein Dynabeads (Invitrogen) (1 h at 4°C). Beads were washed with PBS, and incubated with lysates (0.5 ml, 12 h at 4°C). Beads were washed three times in coimmunoprecipitation buffer, prior to analyis by SDS-PAGE and immunoblotting, using the following antibodies: cingulin (rabbit 1:2 500, mouse 1:200), paracingulin (rabbit 1:10 000, mouse 1:500), myc (mouse 9E10, 1:2), E-cadherin (mouse BD610181, 1 :10 000). For analysis of total protein levels, lysates were prepared in RIPA buffer (150 mM NaCl, 40 mM Tris-HCl, pH 7.5, 2 mM EDTA, 10% glycerol, 1% Triton X-100, 0.5 sodium deoxycholate, 0.2% SDS, 5 μg/ml antipain-leupeptin-pepstatin cocktail, 1 mM PMSF).
Results
Cingulin and paracingulin show similar dynamic behaviour and rapid exchange in confluent monolayers
To study cingulin and paracingulin dynamics, we generated stably transfected MDCK cell lines expressing full-length canine cDNAs coding for either cingulin or paracingulin, fused to fluorescent protein tags. GFP-tagged cingulin shows the same distribution pattern as endogenous cingulin, and interacts with ZO-1 (Paschoud and Citi Citation2008). Overexpression of fluorescently tagged cingulin and paracingulin does not affect junction organization, small GTPase activity, and gene expression (Paschoud and Citi Citation2008, Paschoud and Citi, unpublished data). Thus, fluorescently-tagged cingulin and paracingulin do not exert dominant-negative or constitutively active effects, and display the same physiological behaviours as the endogenous proteins.
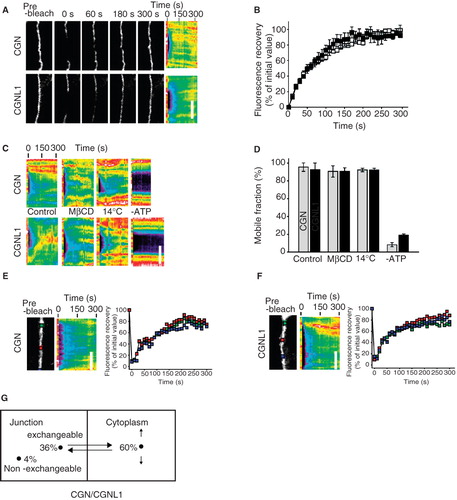
To assess the dynamic behaviours of cingulin and paracingulin in live cells, we performed fluorescence recovery after photobleaching (FRAP) studies in confluent MDCK monolayers. Dynamic behaviours were nearly identical, with mobile fraction of 99 ± 6% and 96 ± 5% and t1/2 of 60 ± 12 and 47 ± 8 sec for cingulin and paracingulin, respectively (, ). Previous studies have shown that TJ proteins may diffuse within the membrane or exchange with a cytosolic pool (Shen et al. Citation2008, Yu et al. Citation2010). To determine the mechanisms of cingulin and paracingulin recovery, FRAP was assessed under conditions designed to interfere primarily with either diffusion or cytosolic exchange. We have previously shown that methyl-β-cyclodextrin, a cholesterol-depleting agent, inhibits occludin diffusion within the TJ (Shen et al. Citation2008). Notably, neither cingulin nor paracingulin exchange were affected by methyl-β-cyclodextrin (, ). Reducing the temperature to 14°C, which reduces diffusion within the membrane, also failed to interfere with cingulin or paracingulin exchange, but, in contrast, ATP depletion markedly inhibited exchange of both proteins (, ). Finally, recovery of cingulin () and paracingulin () was uniform over the length of an elongated bleached region. Thus, junction-associated cingulin and paracingulin exchange with a cytosolic pool via an energy-dependent process that does not require diffusion within the membrane. This is similar to the reported the mechanism of ZO-1 exchange (Shen et al. Citation2008, Yu et al. Citation2010). Quantitative modelling of the data by in silico simulations predicts that for both cingulin and paracingulin, the rate constants for exchange to and from the junction are 1 μm2sec-1 and 0.025 sec-1, respectively, and that the exchangeable pool comprises a large cytoplasmic fraction (60%) and a smaller junction-associated fraction (36%) (). In contrast, reported values for ZO-1 are 0.25 μm2sec-1 and 0.0075 sec-1, respectively (Shen et al. Citation2008). Together with the observation that cingulin and paracingulin mobile fractions are significantly greater than the ∼70% value reported for ZO-1 (Shen et al. Citation2008), these data indicate that cingulin and paracingulin are less strongly anchored at the junction than ZO-1. Moreover, while ZO-1 anchoring at the TJ increases between 1 and 3 days after confluence (Shen et al. Citation2008), cingulin and paracingulin mobile fractions did not change over time (data not shown). Thus, while cingulin and paracingulin exchange with large cytosolic pools in an energy-dependent manner that is similar to ZO-1, their association with the junction is less stable than that of ZO-1.
Figure 1. FRAP behaviour of CGN and CGNL1 in confluent MDCK cells. (A) High magnification images (left panels) and corresponding kymographs (right panels) of junctional segments at the indicated time points after photobleaching. Bar, 5 μm. (B) Fluorescence recovery curves for cingulin (CGN, grey squares) and paracingulin (CGNL1, black squares). (C) Kymographs showing the effect of 5 mM methyl-β-cyclodextrin (MβCD; added 1 hour before analysis), reduced temperature (14°C), or ATP deletion (2 mM 2-D-deoxy-glucose, 1 mM 2,4-dinitrophenol, and 10 mM NaN3 for 1 hour before analysis). Bar, 5 μm. (D) Mobile fractions of cingulin (grey bars) and paracingulin (black bars) from conditions in panel C. (E, F) Single image and kymograph after photobleaching of GFP-CGN (E) and YFP-CGNL1 (F) over an elongated junctional region. Recovery at the center or edges of the bleached region occurred at similar rates. Bar, 5 μm. (G) Model of cingulin and paracingulin behaviour, illustrating how 96% of cingulin and paracingulin is in a mobile fraction, that exchanges between junction-associated (36%) and cytoplasmic (60%) pools.
In isolated cells, paracingulin is localized at the cell periphery, unlike cingulin and ZO-1
Next, to determine the requirement of cell-cell contact for the membrane-associated localization of cingulin and paracingulin, we examined the localization of fluorescently tagged proteins in isolated MDCK cells. Time-lapse video-microscopy showed that paracingulin was accumulated along the peripheral borders of isolated cells (arrows in , and Supplementary Material Movies 1–2, available online). In contrast, the borders of cells expressing fluorescent cingulin were typically devoid of fluorescent signal, even in cells expressing large amounts of exogenous protein (, , and Supplementary Material Movies 3–4, available online). However, cingulin was detected transiently along segments of the cell periphery (arrow in , and Supplementary Material Movies 3–4, available online). Diffuse fluorescent signal for both paracingulin and cingulin was detected in the cytoplasm (c in , , and Supplementary Material Movies 1–4, available online), reinforcing the notion that these proteins are present in both cytoplasmic and junction-associated pools. However, no signal was detected in the nucleus (n in , , ) and in the leading edges of migrating cells (bracket in , , and Supplementary Material Movies 1–4). This latter observation could be due to an exclusion of cingulin and paracingulin from flattened cell borders, or from lower intensity of signal in flattened areas. In cells expressing large amounts of fluorescent cingulin, bright signal was detected in the cytoplasm surrounding the nucleus (asterisks in , , and Supplementary Material Movies 3–4), suggesting an accumulation in the endoplasmic reticulum and Golgi compartments. Both cingulin and paracingulin were also detected in cytoplasmic dots, suggesting a localization at centrosomes (arrowheads in , ).
Figure 2. Cingulin and paracingulin show distinct localizations in isolated MDCK cells. (A–F) : Still images (from time-lapse movies) of cells expressing either YFP-CGNL1 (A–C) (A, B from Movie n. 1 ; C from Movie n. 2, see Supplementary Material, available online), or GFP-CGN (D-F) (D, E from Movie n.3, F from Movie n. 4, see Supplementary Material, online). Arrows indicate localization of proteins at the peripheral borders of isolated cells. Square brackets (B, D, E) indicate leading edges of migrating cells. Arrowheads (C, F) indicate cytoplasmic dots. « n » (A, B, D, E, F) indicates the nucleus. « c » (C, D) indicates diffuse cytoplasmic labelling. Asterisks (D, E) indicate cytoplasmic perinuclear labelling. (G–I): Double immunofluorescent labelling of fixed MDCK cells with rabbit anti-paracingulin antibodies (G, H, I), and either mouse monoclonal anti-cingulin (G'), or mouse monoclonal anti ZO-1 (H'), or mouse monoclonal anti E-cadherin (I'). Arrows (G–H) indicate cell periphery labelled by anti-paracingulin but not by either anti-CGN or anti-ZO-1 antibodies. Arrowhead (H) indicates labelling for ZO-1 in a short segment of the cell periphery). Arrow (I) indicates colocalization between accumulated paracingulin and E-cadherin along the cell periphery. Bar = 10 μm.
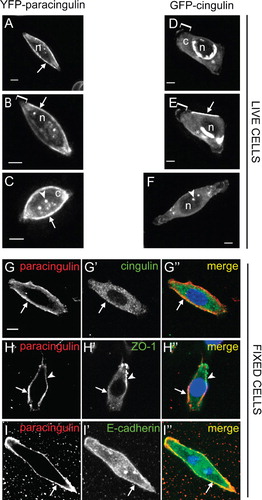
To establish that the distinct localizations of cingulin and paracingulin along the cell periphery in isolated cells are not artefacts due to fluorescent tagging or overexpression of exogenous proteins, wild-type cells were fixed and labelled with antibodies, to detect endogenous proteins. In isolated cells, paracingulin labelling was detected along the whole cell periphery, most of which was devoid of cingulin labelling (arrows in ”). The localization of another TJ marker, ZO-1, in isolated cells was similar to that of cingulin, since most or all of the cell periphery was devoid of ZO-1 labelling, and only occasionally a segment of the cell periphery displayed ZO-1 labelling (arrowhead in ”). However, ZO-1 was not detected in most areas of the cell periphery, that displayed paracingulin labelling (arrow in ”). To examine the colocalization of paracingulin with an AJ marker, we labelled cells with anti-paracingulin and anti-E-cadherin antibodies. E-cadherin labelling was distributed diffusely in the cytoplasm, but was also accumulated at the cell periphery, where it was partially colocalized with paracingulin (arrows in ”). This observation suggested that at the cell periphery of isolated cells paracingulin may associate with proteins of the AJ.
Cingulin and paracingulin accumulate asymmetrically into new sites of cell-cell contact following cell division
Next, we examined the dynamics of cingulin and paracingulin localization during the formation of new junctions. At mitosis, isolated cells rounded up, and cingulin showed a diffuse cytoplasmic distribution, without any peripheral membrane localization (arrow in , and Supplementary Material Movies 3–4, available online). In contrast, paracingulin was still detectable along the cell periphery (arrows in , , , , and Supplementary Material Movies 1–2). At the end of mitosis, the first site where cingulin and paracingulin were detected was the region of contact between daughter cells (arrowheads in , , and Supplementary Material Movies 1–4). As this region expanded, cingulin and paracingulin labelling accumulated in the widening junctional areas (arrowheads in , , and Supplementary Material Movies 1–4). Interestingly, the strongest fluorescence signal was detected at the distal edges of the expanding contact, both in groups of two cells (arrowheads in , , and Supplementary Material Movies 1–4) and in cells within a colony (arrowhead in , , , , and Supplementary Material Movie 5). In contrast, the central part of the region of cell-cell contact showed a signal of lower intensity (asterisks in , , , and Supplementary Material Movies 1–5).
Figure 3. Dynamic localization of cingulin and paracingulin in dividing MDCK cells. Captured still frames from time-lapse movies of isolated MDCK cells expressing either GFP-CGN (A–D from Movie n. 3, J–M from Movie n. 5, N–O from Movie n. 6, see Supplementary Material, available online) or YFP-CGNL1 (E to I, from Movie n. 2, see Supplementary Material). Arrows indicate the periphery of the cells, except in N and O, where they indicate the junction formed between migrating cells. Arrowheads indicate either labelling at the cleavage furrow (B, C, F, H), or the distal edges of newly formed cell-cell contacts (D, I, L, M, N, O). Asterisks (D, I, M) indicate the central region of newly formed junctional contacts. The time in minutes (‘) and hours (h) is indicated in the upper right-hand corner of each panel, starting arbitrarily from time 0 for the first image. Bar = 10 μm.
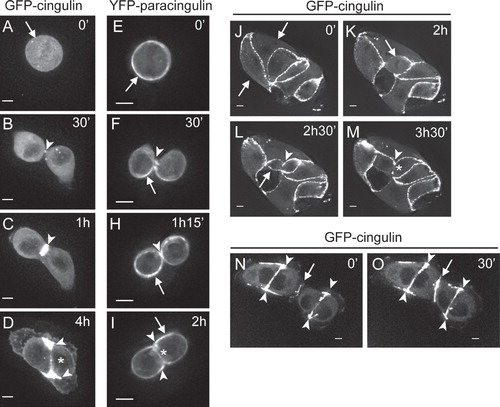
In cells within a colony, no cingulin signal was detected along the sides of the cells that were facing the medium (arrows in , and Supplementary Material Movie 5). In contrast, in a cell undergoing mitosis within the colony (arrow in , and Supplementary Material Movie 5) cingulin was detected in the regions of contact with adjacent cells (arrow in , and Supplementary Material Movie 5), indicating that cell-cell contact is necessary and sufficient to maintain the peripheral localization of cingulin in dividing cells.
New cell-cell junctions can also assemble when migrating cells come into contact. In this case, the accumulation of cingulin fluorescence signal was symmetrical throughout the length of the cell-cell contact (arrows in , , and Supplementary Material Movie 6, available online), in contrast to the asymmetric accumulation at the distal edges that was observed in junctions resulting from mitosis (arrowheads in ,, and Supplementary Material Movie 6). This observation suggested that the asymmetric localization of cingulin and paracingulin in dividing cells is linked to the actomyosin-driven expansion of the region of cell-cell contact.
The junctional localization of paracingulin, unlike cingulin, requires the integrity of the microtubule cytoskeleton
The establishment and maintenance of AJ and TJ requires cadherin-mediated adhesion, and the formation of a belt of actin filaments at cell-cell adhesion sites (Yonemura et al. Citation1995). To clarify the role of the actin cytoskeleton in the junctional localization of cingulin and paracingulin, we treated confluent MDCK monolayers with latrunculin B, which prevents actin polymerization. In addition, since the microtubule cytoskeleton regulates the stability of AJ (Meng et al. Citation2008), we also treated cells with nocodazole, which prevents the polymerization of microtubules. After treatment with drugs, cells were immunofluorescently labelled to localize cingulin, paracingulin, ZO-1, E-cadherin, actin filaments and microtubules.
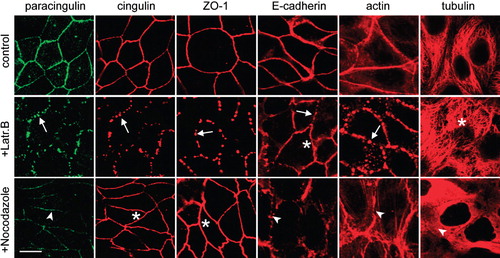
In control, non-treated cells, the labelling for cingulin, paracingulin, ZO-1, E-cadherin and actin filaments was distributed along cell-cell junctions, in a continuous pattern and individual microtubules were detectable throughout the cytoplasm (control in ). Treatment of monolayers with latrunculin B resulted in the fragmentation of the junctional labelling of cingulin, paracingulin, ZO-1 and E-cadherin, into either segments or dot-like structures along the region of cell-cell contact (arrows in , +Latr.B), showing that the correct assembly of actin filaments is necessary for the junctional localization of these proteins (see also Citi et al. Citation1994, Stevenson and Begg Citation1994). Confirming the notion that latrunculins do not affect microtubules (Spector et al. Citation1983), the labelling for α-tubulin was not influenced by treatment with latrunculin B. Treatment of cells with nocodazole significantly affected only the junctional localization of paracingulin and E-cadherin, whose fluorescent signal was significantly decreased (arrowheads in , +Nocodazole). In contrast, the junctional localization of cingulin and ZO-1 in nocodazole-treated cells was similar to that of non-treated cells (asterisks in , +Nocodazole). Treatment of cells with nocodazole not only resulted in the loss of normal microtubule labelling, but also perturbed the distribution of actin filaments, since in control cells the perijunctional actin labelling was homogeneous and compact, whereas in nocodazole-treated cells it was disorganized, with frayed filaments in the submembrane cytoplasm (arrowheads in , +Nocodazole). However, the actin filaments were not fragmented by nocodazole along the junction, consistent with the maintenance of a continuous peripheral distribution of cingulin and ZO-1. Taken together, these results indicate that only paracingulin and E-cadherin, but not cingulin nor ZO-1, require the integrity of microtubule cytoskeleton to remain stably anchored to junctions.
Figure 4. Paracingulin and E-cadherin, but not cingulin and ZO-1 require the integrity of the microtubule cytoskeleton for their stable association with junctions. Immunofluorescent localization of paracingulin, cingulin, ZO-1, E-cadherin, actin and α-tubulin in control MDCK cells (control), in cells treated with latrunculin B (+Latr.B), and in cells treated with nocodazole (+Nocodazole). Arrows and arrowheads indicate labelling that is either fragmented or reduced or disrupted (see text of results). Asterisks indicate normal labelling, not affected by the drug treatment. Note that only for cingulin/paracingulin labelling the images correspond to double-labelled cells. Neither treatment with latrunculin B nor nocodazole modified the levels of expression of cingulin and paracingulin (data not shown). Bar = 10 μm.
Cingulin and paracingulin participate in a common molecular complex, but are recruited to junctions independently
Previous studies have shown that cingulin can undergo both intra- and inter-molecular interaction and assembly (Cordenonsi et al. Citation1999, Citi et al. Citation2000, D'Atri et al. Citation2002). Since cingulin and paracingulin have similar sequence features and a common domain organization, we speculated that cingulin and paracingulin might interact together and form heteropolymers, and this interaction might be required for their efficient junctional recruitment. To test this hypothesis, we carried out immunoblot analysis of cingulin and paracingulin immunoprecipitates, that showed that the two proteins are detectable in the same molecular complex (). Since paracingulin was partially co-localized with E-cadherin in isolated cells (), and behaved similarly to E-cadherin following nocodazole treatment of confluent cells (), we also examined whether paracingulin and E-cadherin form a complex. Analysis of immunoprecipitates from cells expressing exogenous proteins revealed that E-cadherin was detected in paracingulin, but not cingulin immunoprecipitates (). This indicated that a fraction of paracingulin is present in an E-cadherin-containing complex, that does not contain cingulin. To determine whether cingulin and paracingulin can interact in vitro, a bacterially expressed fusion protein comprising the head region of paracingulin was incubated with full-length cingulin, expressed in baculovirus-infected insect cells. Pulldown experiments showed that full length cingulin could interact with the head of paracingulin, but the binding was not saturable, indicating a low affinity of interaction ().
Figure 5. Cingulin and paracingulin form a complex together, but are independently recruited to junctions. (A) Paracingulin and cingulin form a complex. Immunoblot analysis, with antibodies against cingulin and paracingulin of immunoprecipitates prepared from kidney epithelial cell lysates, using antibodies against cingulin and paracingulin, and a rabbit preimmune serum. Input = 1/10 of the volume of lysate used for the immunoprecipitation. (B) Paracingulin and E-cadherin form a complex. Immunoblot analysis, with anti-E-cadherin and anti-myc antibodies of lysates (Input) and immunoprecipitates obtained using either anti-GFP (GFP) or control antibodies on lysates of MDCK cells expressing either GFP-CGN-myc or YFP-CGNL1-myc or GFP (as control) proteins, or on lysates of normal control cells that do not express any exogenous protein (wt). Control immunoprecipitations (control IP) were carried out with an unrelated monoclonal antibody (anti-HA). (C) Above, schematic diagram of the domain organization of paracingulin, and the bait GST fusion protein (GST-CGNL1 residues 1-530) used for the pulldown experiment shown below. Below, immunoblot analysis, using anti-His antibodies, of GST pulldowns where a fixed amount of bait protein was incubated with increasing amounts (50, 100, 250 μl) of insect cell lysate containing full-length, His-tagged CGN. Note that very little CGN was pulled down by the control GST protein (using 100 μl of insect cell lysate). In. = input (3.5 μl lysate). Ponceau-S staining shows the amounts of GST fusion protein and GST (asterisks) in the pulldown. (D) and (E) Immunofluorescence (D) and immunoblotting (E) analysis of cingulin (CGN) and paracingulin (CGNL1) in wild-type cells (wt) and in depleted lines (CGN kd, CGNL1 kd) (Guillemot and Citi Citation2006a, Guillemot et al. Citation2008a). Bar = 10 μm. (F) Mobile fractions (determined by FRAP analysis) of either GFP-CGN or YFP-CGNL1, carried out either in wild-type cells (left bar) or paracingulin-depleted cells (for GFP-CGN) or cingulin-depleted cells (for YFP-CGNL1) (right bar). The differences in the mobile fractions are not statistically significant.
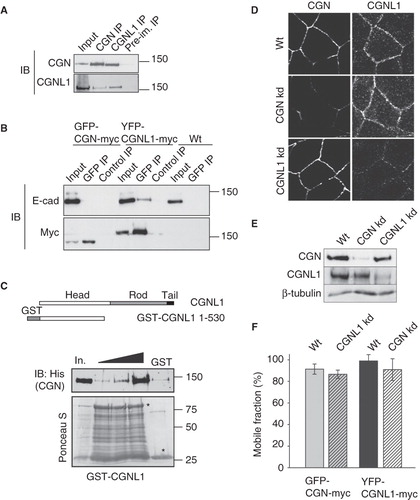
Next, to test the possible role of cingulin in paracingulin junctional recruitment, we examined the localization of paracingulin in cingulin-depleted cells which we described previously (Guillemot and Citi Citation2006a). Immunofluorescence analysis revealed that the junctional localization of paracingulin was not affected by the reduced expression of cingulin (). In addition, confirming previous data on paracingulin-depleted cells (Guillemot et al. Citation2008a), the localization of cingulin at junctions was not affected by paracingulin depletion (). Immunoblot analysis confirmed that depletion of one protein did not affect the total protein levels of the other (). If the junctional recruitment and dynamics of cingulin is independent of paracingulin (and vice-versa) we would predict that the in vivo rate of exchange of each protein with the junction is independent of the other. To test this hypothesis, we carried out FRAP analysis of cingulin in paracingulin-depleted cells, and paracingulin in cingulin-depleted cells. The data showed that cingulin FRAP was unaffected by paracingulin depletion and, conversely, paracingulin FRAP was unaffected by cingulin depletion (), demonstrating that the exchanges of cingulin and paracingulin are independent of one another.
Discussion
In this paper we show that the dynamic behaviour of cingulin and paracingulin is nearly identical in confluent monolayers. The patterns of fluorescence recovery after photobleaching (FRAP) show very rapid exchange rates for both proteins, with 60 sec or less required for half-maximal recovery, with the mobile fraction representing nearly the entire cellular pool. This is most similar to actin, which also exchanges rapidly and completely. ZO-1 requires twice as long as cingulin and paracingulin for half-maximal recovery, and only ∼70% of ZO-1 is in the mobile fraction (Shen et al. Citation2008). Thus, the dynamic behaviours of cingulin and paracingulin are distinct from ZO-1. The slower mobility of ZO-1 may be due to its interaction with multiple membrane and cytoplasmic protein partners (Furuse et al. Citation1994, Fanning et al. Citation1998, Itoh et al. Citation1999, Wittchen et al. Citation1999, Bazzoni et al. Citation2000). Another similarity in the dynamic behaviour of cingulin and paracingulin is their accumulation at the distal edges of the expanding cell-cell contact, following mitosis. This is mechanistically relevant, since at these sites RhoA activation induces actomyosin contraction to stabilize and expand the cell-cell contact (Ehrlich et al. Citation2002, Yamada and Nelson Citation2007). Therefore, cingulin and paracingulin may be required at these sites to fine-tune RhoA activity.
Although the cytoplasmic pool of cingulin and paracingulin was detectable in live cells, no nuclear localization was detected, despite earlier evidence suggesting such a localization (Citi and Cordenonsi Citation1999, Nakamura et al. Citation2000, Lopez-Bayghen et al. Citation2006). This is probably not due to the presence of the GFP moiety, since other large GFP-tagged TJ proteins can be targeted to the nucleus (Riesen et al. Citation2002). Thus, our results suggest that unlike other TJ proteins, such as ZO-2 (Jaramillo et al. Citation2004) or Par-3 (Fang et al. Citation2007), cingulin and paracingulin cannot shuttle to the nucleus. If this is the case, the effects of cingulin and paracingulin depletion on gene expression (Guillemot et al. Citation2004, Citation2008a, Guillemot and Citi Citation2006a, Citi et al. Citation2009) are not the result of a nuclear activity, but occur indirectly, through interactions with signalling molecules in the cytoplasm.
Despite the similar dynamic behaviour of cingulin and paracingulin in confluent monolayers, we identified specific features of paracingulin, that are not shared with cingulin. First, in the absence of cell-cell contact, only paracingulin was detected along the whole cell periphery. Second, nocodazole treatment resulted in loss of paracingulin and E-cadherin from junctions, but not cingulin and ZO-1. Third, E-cadherin was found in a complex with paracingulin, but not cingulin. This is the first molecular evidence for the previously reported association of paracingulin with AJ (Ohnishi et al. Citation2004). Taken together, all these observations confirm that paracingulin is functionally distinct from cingulin, and indicate that paracingulin participates in at least two molecular complexes: One with cingulin, presumably at TJ, and one with E-cadherin, presumably at AJ, and linked to microtubules. In addition, the effect of latrunculin B on paracingulin and cingulin localizations, as well as their rapid dynamics of exchange, indicates a direct or indirect association of both proteins with actin filaments. Significantly, cingulin has been shown to interact in vitro both with myosin and F-actin (Cordenonsi et al. Citation1999, D'Atri and Citi Citation2001).
An important finding of our study was that although cingulin and paracingulin can be found in a complex, they are targeted to junctions and exchange with the junctional membrane independently of one another. Since depletion of either cingulin or paracingulin does not affect the recruitment of several junctional proteins (Guillemot and Citi Citation2006a, Guillemot et al. Citation2008a), we conclude that cingulin and paracingulin are not upstream regulators in the hierarchy of junctional assembly, but function as cytoskeleton-associated adaptors for guanine nucleotide exchange proteins (Aijaz et al. Citation2005, Guillemot and Citi Citation2006a, Guillemot et al. Citation2008a). The precise molecular mechanisms that regulate the recruitment of paracingulin to TJ and AJ, and its interaction with actin and microtubules, are open questions for further investigations.
Conclusions
In this paper we provide new information about the dynamic localization of cingulin and paracingulin in epithelial cells, identify several unique features of paracingulin, characterize the role of the actin and the microtubule cytoskeletons in the association of cingulin and paracingulin with junctional membranes, and establish that their junctional recruitment is mutually inter-independent. Because of the role of cingulin and paracingulin in regulating the activity of RhoA and Rac1 (Aijaz et al. Citation2005, Guillemot and Citi Citation2006a, Guillemot et al. Citation2008a), these results contribute to our understanding of the molecular mechanisms of spatio-temporal regulation of Rac1 and RhoA activity.
Movies 1–6
Download MS Word (26 KB)Supplementary Material
Download MP4 Video (270.8 KB)Supplementary Material
Download MP4 Video (268.5 KB)Supplementary Material
Download MP4 Video (503.1 KB)Supplementary Material
Download MP4 Video (508.6 KB)Supplementary Material
Download MP4 Video (237.8 KB)Supplementary Material
Download MP4 Video (343 KB)Acknowledgements
We thank the colleagues cited in the text for generous gifts of reagents, to the Imaging Platform of the NCCR “Frontiers in Genetics”, and Dr Christoph Bauer for excellent microscopy support.
Declaration of interest: Supported by grants from the Swiss National Fonds (3100A0-116763/1), the Swiss Cancer League (OCS-01916-08-2006) (SC), and by the US National Institutes of Health (DK061931 and DK068271) (JRT). The authors report no conflicts of interest. The authors alone are responsible for the content and writing of the paper.
References
- Aijaz S, D'Atri F, Citi S, Balda MS, Matter K. 2005. Binding of GEF-H1 to the tight junction-associated adaptor cingulin results in inhibition of Rho signaling and G1/S phase transition. Dev Cell 8:777–786.
- Anderson JM, Van Itallie CM, Fanning AS. 2004. Setting up a selective barrier at the apical junction complex. Curr Opin Cell Biol 16:140–145.
- Bazzoni G, Martinez-Estrada OM, Orsenigo F, Cordenonsi M, Citi S, Dejana E. 2000. Interaction of junctional adhesion molecule with the tight junction components ZO-1, cingulin, and occludin. J Biol Chem 275:20520–20526.
- Braga VM, Yap AS. 2005. The challenges of abundance: Epithelial junctions and small GTPase signalling. Curr Opin Cell Biol 17:466–74.
- Citi S, Cordenonsi M. 1999. The molecular basis for the structure, function and regulation of tight junctions. In: Garrod DR, North AJ, Chidgey MAJ, editors. Adhesive interactions of cells. Greenwich, CT: JAI Press, Inc.
- Citi S, D'Atri F, Parry DAD. 2000. Human and Xenopus cingulin share a modular organization of the coiled-coil rod domain: Predictions for intra- and intermolecular assembly. J Struct Biol 131:135–145.
- Citi S, Paschoud S, Pulimeno P, Timolati F, De Robertis F, Jond L, Guillemot L. 2009. The tight junction protein cingulin regulates gene expression and RhoA signalling. Ann NY Acad Sci 1165:88–98.
- Citi S, Sabanay H, Jakes R, Geiger B, Kendrick-Jones J. 1988. Cingulin, a new peripheral component of tight junctions. Nature 333:272–276.
- Citi S, Sabanay H, Kendrick-Jones J, Geiger B. 1989. Cingulin: Characterization and localization. J Cell Sci 93:107–122.
- Citi S, Volberg T, Bershadsky AD, Denisenko N, Geiger B. 1994. Cytoskeletal involvement in the modulation of cell-cell junctions by the protein kinase inhibitor H-7. J Cell Sci 107:683–692.
- Cordenonsi M, D'Atri F, Hammar E, Parry DA, Kendrick-Jones J, Shore D, Citi S. 1999. Cingulin contains globular and coiled-coil domains and interacts with ZO-1, ZO-2, ZO-3, and myosin. J Cell Biol 147:1569–1582.
- D'Atri F, Citi S. 2001. Cingulin interacts with F-actin in vitro. FEBS Lett 507:21–24.
- D'Atri F, Nadalutti F, Citi S. 2002. Evidence for a functional interaction between cingulin and ZO-1 in cultured cells. J Biol Chem 277:27757–27764.
- Ehrlich JS, Hansen MD, Nelson WJ. 2002. Spatio-temporal regulation of Rac1 localization and lamellipodia dynamics during epithelial cell-cell adhesion. Dev Cell 3:259–270.
- Etienne-Manneville S, Hall A. 2002. Rho GTPases in cell biology. Nature 420:629–635.
- Fang L, Wang Y, Du D, Yang G, Tak Kwok T, Kai Kong S, Chen B, Chen DJ, Chen Z. 2007. Cell polarity protein Par3 complexes with DNA-PK via Ku70 and regulates DNA double-strand break repair. Cell Res 17:100–116.
- Fanning AS, Jameson BJ, Jesaitis LA, Anderson JM. 1998. The tight junction protein ZO-1 establishes a link between the transmembrane protein occludin and the actin cytoskeleton. J Biol Chem 273:29745–29753.
- Farquhar MG, Palade GE. 1963. Junctional complexes in various epithelia. J Cell Biol 17:375–412.
- Furuse M, Itoh M, Hirase T, Nagafuchi A, Yonemura S, Tsukita S, Tsukita S. 1994. Direct association of occludin with ZO-1 and its possible involvement in the localization of occludin at tight junctions. J Cell Biol 127:1617–1626.
- Furuse M, Tsukita S. 2006. Claudins in occluding junctions of humans and flies. Trends Cell Biol 16:181–188.
- Gonzalez-Mariscal L, Tapia R, Chamorro D. 2008. Crosstalk of tight junction components with signaling pathways. Biochim Biophys Acta 1778:729–756.
- Guillemot L, Citi S. 2006a. Cingulin regulates claudin-2 expression and cell proliferation through the small GTPase RhoA. Mol Biol Cell 17:3569–3577.
- Guillemot L, Citi S. 2006b. Cingulin, a cytoskeleton-associated protein of the tight junction. In: Gonzalez-Mariscal L, editor. Tight junctions. New York, NY USA: Landes Bioscience-Springer Science.
- Guillemot L, Hammar E, Kaister C, Ritz J, Caille D, Jond L, Bauer C, Meda P, Citi S. 2004. Disruption of the cingulin gene does not prevent tight junction formation but alters gene expression. J Cell Sci 117:5245–5256.
- Guillemot L, Paschoud S, Jond L, Foglia A, Citi S. 2008a. Paracingulin regulates the activity of Rac1 and RhoA GTPases by recruiting Tiam1 and GEF-H1 to epithelial junctions. Mol Biol Cell 19:4442–4453.
- Guillemot L, Paschoud S, Pulimeno P, Foglia A, Citi S. 2008b. The cytoplasmic plaque of tight junctions: A scaffolding and signalling center. Biochim Biophys Acta 1778:601–613.
- Gumbiner BM. 2005. Regulation of cadherin-mediated adhesion in morphogenesis. Nat Rev Mol Cell Biol 6:622–634.
- Halbleib JM, Nelson WJ. 2006. Cadherins in development: Cell adhesion, sorting, and tissue morphogenesis. Genes Dev 20:3199–3214.
- Itoh M, Furuse M, Morita K, Kubota K, Saitou M, Tsukita S. 1999. Direct binding of three tight junction-associated MAGUKs, ZO-1, ZO-2, and ZO-3, with the COOH termini of claudins. J Cell Biol 147:1351–1363.
- Jamora C, Fuchs E. 2002. Intercellular adhesion, signalling and the cytoskeleton. Nat Cell Biol 4:E101–108.
- Jaramillo BE, Ponce A, Moreno J, Betanzos A, Huerta M, Lopez-Bayghen E, Gonzalez-Mariscal L. 2004. Characterization of the tight junction protein ZO-2 localized at the nucleus of epithelial cells. Exp Cell Res 297:247–258.
- Jou TS, Schneeberger EE, Nelson WJ. 1998. Structural and functional regulation of tight junctions by RhoA and Rac1 small GTPases. J Cell Biol 142:101–115.
- Lechler T, Fuchs E. 2007. Desmoplakin: An unexpected regulator of microtubule organization in the epidermis. J Cell Biol 176:147–154.
- Lopez-Bayghen E, Jaramillo BE, Huerta M, Betanzos A, Gonzalez-Mariscal L. 2006. TJ proteins that make round trips to the nucleus. In: Gonzalez-Mariscal L, editor. Tight junctions. Georgetown, TX, USA: Landes Bioscience.
- Madara JL. 1987. Intestinal absorptive cell tight junctions are linked to the cytoskeleton. Am J Physiol 253:C171–175.
- Matter K, Aijaz S, Tsapara A, Balda MS. 2005. Mammalian tight junctions in the regulation of epithelial differentiation and proliferation. Curr Opin Cell Biol 17(5):453–458.
- Meng W, Mushika Y, Ichii T, Takeichi M. 2008. Anchorage of microtubule minus ends to adherens junctions regulates epithelial cell-cell contacts. Cell 135:948–959.
- Meng W, Takeichi M. 2009. Adherens junction: Molecular architecture and regulation. Cold Spring Harbor Perspectives in Biology (doi:10.1101/cshperspect.a002899).
- Mitic LL, Anderson JM. 1998. Molecular architecture of tight junctions. Annu Rev Physiol 60:121–142.
- Nakamura T, Blechman J, Tada S, Rozovskaia T, Itoyama T, Bullrich F, Mazo A, Croce CM, Geiger B, Canaani E. 2000. huASH1 protein, a putative transcription factor encoded by a human homologue of the Drosophila ash1 gene, localizes to both nuclei and cell-cell tight junctions. Proc Natl Acad Sci USA 97:7284–7289.
- Nelson WJ, Drees F, Yamada S. 2005. Interaction of cadherin with the actin cytoskeleton. Novartis Found Symp 269:159–168; discussion 168–177,223–230.
- Ohnishi H, Nakahara T, Furuse K, Sasaki H, Tsukita S, Furuse M. 2004. JACOP, a novel plaque protein localizing at the apical junctional complex with sequence similarity to cingulin. J Biol Chem 279:46014–46022.
- Paschoud S, Citi S. 2008. Inducible overexpression of cingulin in stably transfected MDCK cells does not affect tight junction organization and gene expression. Mol Membr Biol 25:1–13.
- Perez-Moreno M, Jamora C, Fuchs E. 2003. Sticky business: Orchestrating cellular signals at adherens junctions. Cell 112:535–548.
- Riesen FK, Rothen-Rutishauser B, Wunderli-Allenspach H. 2002. A ZO1-GFP fusion protein to study the dynamics of tight junctions in living cells. Histochem Cell Biol 117:307–315.
- Samarin S, Nusrat A. 2009. Regulation of epithelial apical junctional complex by Rho family GTPases. Front Biosci 14:1129–1142.
- Schneeberger EE, Lynch RD. 2004. The tight junction: A multifunctional complex. Am J Physiol Cell Physiol 286:C1213–1228.
- Shen L, Turner JR. 2005. Actin depolymerization disrupts tight junctions via caveolae-mediated endocytosis. Mol Biol Cell 16:3919–3936.
- Shen L, Weber CR, Turner JR. 2008. The tight junction protein complex undergoes rapid and continuous molecular remodeling at steady state. J Cell Biol 181:683–695.
- Shin K, Fogg VC, Margolis B. 2006. Tight junctions and cell polarity. Annu Rev Cell Dev Biol 22:207–235.
- Spector I, Shochet NR, Kashman Y, Groweiss A. 1983. Latrunculins: Novel marine toxins that disrupt microfilament organization in cultured cells. Science 219:493–495.
- Stevenson BR, Begg DA. 1994. Concentration-dependent effects of cytochalasin D on tight junctions and actin filaments in MDCK epithelial cells. J Cell Sci 107:367–375.
- Takai Y, Miyoshi J, Ikeda W, Ogita H. 2008. Nectins and nectin-like molecules: Roles in contact inhibition of cell movement and proliferation. Nat Rev Mol Cell Biol 9:603–615.
- Turner JR. 2000. ‘Putting the squeeze’ on the tight junction: Understanding cytoskeletal regulation. Semin Cell Dev Biol 11:301–308.
- Wheelock MJ, Johnson KR. 2003. Cadherins as modulators of cellular phenotype. Annu Rev Cell Dev Biol 19:207–235.
- Wittchen ES, Haskins J, Stevenson BR. 1999. Protein interactions at the tight junction. Actin has multiple binding partners, and zo-1 forms independent complexes with zo-2 and zo-3. J Biol Chem 274:35179–35185.
- Yamada S, Nelson WJ. 2007. Localized zones of Rho and Rac activities drive initiation and expansion of epithelial cell-cell adhesion. J Cell Biol 178:517–527.
- Yonemura S, Itoh M, Nagafuchi A, Tsukita S. 1995. Cell-to-cell adherens junction formation and actin filament organization: Similarities and differences between non-polarized fibroblasts and polarized epithelial cells. J Cell Sci 108:127–142.
- Yu D, Marchiando AM, Weber CR, Raleigh DR, Wang Y, Shen L, Turner JR. 2010. MLCK-dependent exchange and actin binding region-dependent anchoring of ZO-1 regulate tight junction barrier function. Proc Natl Acad Sci USA 107:8237–8241.