Abstract
After de novo synthesis of lysosome-associated membrane proteins (LAMPs), they are sorted in the trans-Golgi network (TGN) for delivery to lysosomes. Opposing views prevail on whether LAMPs are targeted to lysosomes directly, or indirectly via prelysosomal stages of the endocytic pathway, in particular early endosomes. Conflicting evidence is based on kinetic measurements with too limited quantitative data for sufficient temporal and organellar resolution. Using cells of the mouse macrophage cell line, P338D1, this study presents detailed kinetic data that describe the extent of, and time course for, the appearance of newly-synthesized LAMP-1 in organelles of the endocytic pathway, which had been loaded selectively with horse-radish peroxidase (HRP) by appropriate periods of endocytosis. After a 5-min pulse of metabolic labelling, LAMP-1 was trapped in the respective organelles by HRP-catalyzed crosslinking with membrane-permeable diaminobenzidine (DAB). These kinetic observations provide sufficient quantitative evidence that in P338D1 cells the bulk of newly-synthesized endogenous LAMP-1 first appeared in early endosomes, before it was delivered to late endosomes and lysosomes about 25 min later.
Introduction
Lysosomes are single-membrane-bound organelles that are the main site of degradation in the endocytic pathway of eukaryotic cells. The crucial role that lysosomes play in cellular metabolism is evident from the many diseases associated with lysosomal malfunctioning (Harms Citation1989). The lysosomal membrane is enriched in a group of highly glycosylated trans-membrane proteins (LAMPs, LIMPs or LGPs), the role of which has not been clearly determined and continues to be investigated (reviewed in Eskelinen et al. Citation2003). In addition to functioning in lysosomes, LAMPs may also function at the cell surface and in early endosomes. In human peripheral blood mononuclear cells LAMP-1 and LAMP-2 are activation-dependent cell-surface glycoproteins that mediate cell adhesion to the vascular endothelium (Kannan et al. Citation1996). LAMP-2 and LAMP-3 may be indicators of platelet activation (Kannan et al. Citation1995). LAMPs are required for the maturation of phagosomes: LAMP-1- and LAMP-2-deficient phagosomes are positive for early endosomal markers Rab5b and phosphatidylinostol 3-phosphate, fail to accumulate the late endosomal marker Rab7 and do not fuse with lysosomes (Huynh et al. Citation2007). LAMPs are the most abundant glycoproteins in the lysosomal membrane (∼50%) (Marsh et al. Citation1987; Granger et al. Citation1990; Fukuda Citation1991; Andrejewski et al. Citation1999), predominantly localized to lysosomes (Chen et al. Citation1985a, Citation1985b; Lewis et al. Citation1985; D'Souza and August Citation1986; Barriocanal et al. Citation1986; Mane et al. Citation1989) and have thus been identified as a marker for lysosomes.
The molecular processes that underly lysosomal biogenesis remain poorly defined (reviewed in Mullins and Bonifacino Citation2001). In particular, knowledge about the route for delivery of LAMPs, from the TGN to lysosomes as their final destination, has remained uncertain. Three main pathways have been investigated: (i) An intracellular route directly to lysosomes, (ii) an intracellular route via early endosomes, or (iii) a route along the secretory pathway to the cell surface, followed by delivery along the endocytic pathway. Low concentratons of LAMPs on the plasma membrane and endosomes (Chen et al. Citation1985b; Lewis et al. Citation1985; Mane et al. Citation1989) suggest that the endocytic pathway may be involved. In fact, LAMP has been observed trafficking through the plasma membrane, along the endocytic pathway and cycling between the plasma membrane and lysosomes at steady state (Lippincott-Schwartz and Fambrough Citation1986, Citation1987; Akasaki et al. Citation1993; Groux-Degroote et al. Citation2008). However, it is not clear whether newly-synthesized LAMPs reach the endocytic organelles en route from the TGN to lysosomes or by recycling from lysosomes. Most studies have implied that newly-synthesized LAMPs are delivered to lysosomes along an intracellular route, and if at all, only a minor fraction first passes through the cell surface (D'Souza and August Citation1986; Green et al. Citation1987; Harter and Mellman Citation1992; Carlsson and Fukuda Citation1992; Akasaki et al. Citation1995, Citation1996; Obermuller et al. Citation2002; Rous et al. Citation2002; Cook et al. Citation2004). Only three studies have suggested that a substantial fraction of LAMP is delivered to lysosomes via the plasma membrane (Nabi et al. Citation1991; Mathews et al. Citation1992; Janvier and Bonifacino Citation2005). These results may appear contradictory, but can be explained by the rapid endocytosis-related, dynamic equilibrium between the plasma membrane and early endosomes (Burgert and Thilo Citation1983; Lippincott-Schwartz and Fambrough Citation1986). As has been indicated by Janvier and Bonifacino (Citation2005), the newly-synthesized LAMPs observed to accumulate on the cell surface as a result of AP-2 depletion may have come from early endosomes. Hunziker and Geuze (Citation1996) suggest the same about newly-synthesized endogenous LAMP-2 encountered by antibody added from the basolateral surface at 37°C (Nabi et al. Citation1991). Appearance of LAMP on the cell surface may depend on the efficiency of sorting mechanisms in the plasma membrane/early endosome compartment (Harter and Mellman Citation1992, Honing and Hunziker Citation1995) and may thus not be an accurate measure of the relative importance of the site along the delivery path of newly-synthesized LAMP. It is thus generally thought that LAMPs are transported from the TGN to endosomes/lysosomes mainly via an intracellular route without appearing on the cell surface (Eskelinen et al. Citation2003; Luzio et al. Citation2003). Considering the intracellular route, it is not clear whether LAMPs are delivered indirectly via early endosomes, late endosomes or directly to lysosomes. Two studies have indicated that newly-synthesized LAMP is delivered to lysosomes via multiple pathways, a major portion of LAMP-1 being delivered via late endosomes (Akasaki et al. Citation1995) and a major portion of LAMP-2 being delivered via early endosomes (Akasaki et al. Citation1996). Another study has suggested that LAMP-1 is delivered mainly via early endosomes (Cook et al. Citation2004). Evidence against trafficking via early endosomes comes from Rous et al. (Citation2002). Disruption of trafficking between early endosomes and lysosomes by chloroquine treatment does not prevent localization of a major fraction of CD63 (LAMP-3) on lysosomes (Rous et al. Citation2002). This suggests that newly-synthesized LAMP mainly bypasses early endosomes. Although evidence for delivery via early endosomes has been mounting, the results have thus remained contradictory, mainly due to technical limitations.
The requirement of long pulses of synthetic labelling to observe adequate amounts of newly-synthesized lysosomal membrane proteins allowed for only limited kinetic resolution of how labelled proteins move transiently through different compartments (Akasaki et al. Citation1995, Citation1996). The shapes of the time courses for the entry of newly-synthesized LAMPs into compartments have been compared and interpreted as determining their pathways. An increase of LAMPs in a specific compartment has been interpreted to imply entry into the respective compartment from the TGN. However, that does not indicate the order or pathway of events. In some studies (Green et al. Citation1987; Akasaki et al. Citation1995, Citation1996), half-times, t1/2, have been compared as a measure for the rate at which LAMP is delivered into a specific compartment. However, by itself, t1/2 is not a measure for the rate at which constituents flow into a compartment. This rate is expressed as the flux, f [molecules per time], and is related to t1/2 as f α m/t1/2, with m [number of molecules] representing the pool-size of constituents in this compartment at steady state. Therefore, the same flux would suffice to fill a smaller compartment more rapidly (shorter t1/2) than a larger one. Another approach to observe the trafficking of labelled proteins through cellular compartments is based on subcellular fractionation on Percoll density-gradients. This method has been considered as being of limiting resolving power, in particular with respect to the isolation of early endosomes (Haylett and Thilo Citation1986; Green et al. Citation1987; Carlsson and Fukuda Citation1992; Stoorvogel Citation1998). In an effort to circumvent the technical limitation presented by long labelling pulses and subcellular fractionation, a LAMP chimera has been designed that could be labelled to a high specific activity during a post-translational modification step in the trans-Golgi/TGN (Cook et al. Citation2004). After its exit from the TGN, this chimera can then be captured by a fluid-phase endocytic marker as soon as it entered an endocytic compartment that harboured the marker. Due to its degradation in lysosomes, however, its kinetics of entry into early endosomes can not be compared directly with those of its entry into lysosomes or into the endocytic pathway as a whole. To determine delivery via late endosomes, subcellular fractionation has been used, although, as shown by the authors themselves, with the resulting limited resolution for separation of early and late endosomes. Within these limitations, the observations show that LAMP-1 is delivered to lysosomes via transit through early endosomes.
In the present study, the required kinetic resolution to quantitatively characterize the pathway of newly-synthesized endogenous LAMP-1 was obtained by using sufficiently short periods (5 min) of pulse-labelling with 35S-methionine of high specific-activity after methionine starvation. The resulting small amounts of newly-synthesized 35S-LAMP-1 were measured by scintillation counting of solubilized gel pieces containing the LAMP-1 band. This technique was 300-fold more sensitive than Imager densitometry. In order to measure the rate at which a pulse of newly-synthesized LAMP-1 entered the respective endocytic organelles, HRP-DAB crosslinking was used. Endocytic organelles were loaded selectively with HRP by appropriate regimes of endocytic uptake, and LAMP-1 was trapped by HRP-catalysed crosslinking with membrane-permeable DAB (Courtoy et al. Citation1984). The choice of kinetic parameters was based on predictions by mathematical modelling as shown in . The quantitative and qualitative differences between the predictions for the two different pathways ( vs. ; cf. curve n1 in A with n2 in B) suggested that even limited quantitative resolution would enable a clear distinction between the two pathways. While previous studies have shown passage of LAMP-1 through the early endosome/plasma membrane compartment, these were not sufficiently quantitative. Our kinetic observations confirm unambiguously that the bulk of newly-synthesized endogenous LAMP-1 delivered to lysosomes via the endocytic pathway first transits early endosomes.
Figure 1. Modelling the pathways for lysosomal delivery of newly-synthesized LAMP-1. Newly-synthesized (labelled) LAMP-1 (LAMP-1*) enters a steady-state pool of existing LAMP-1 (pool size n1) at a rate S. From n1 it equilibrates by membrane traffic to a second pool, n2. The curves indicate the time course for the respective accumulation of LAMP-1* in pools n1 and n2 as well as in the combined endocytic pathway (EP = n1 + n2). In panel A, input is via early endosomes (n1 = eEn), followed by exchange with n2 as representing lysosomes (n2 = Ly). In panel B, input occurs directly into lysosomes, with n1 = Ly and n2 = eEn. The simulation is based on the assumption that at steady state the bulk of LAMP-1 resides in lysosomes (here taken as 90%). (The curves are an approximation because the input function S has been treated as a first-order process, S = Stotal · [1-e-λ·t], as indicated by the curves for (n1 + n2). This approximation allows for algebraic integration of the underlying differential equations. The more realistic input by sigmoidal characteristics cannot be integrated algebraically. The approximation resulted in the absence of a lag phase at early times as observed experimentally in this study, ).
![Figure 1. Modelling the pathways for lysosomal delivery of newly-synthesized LAMP-1. Newly-synthesized (labelled) LAMP-1 (LAMP-1*) enters a steady-state pool of existing LAMP-1 (pool size n1) at a rate S. From n1 it equilibrates by membrane traffic to a second pool, n2. The curves indicate the time course for the respective accumulation of LAMP-1* in pools n1 and n2 as well as in the combined endocytic pathway (EP = n1 + n2). In panel A, input is via early endosomes (n1 = eEn), followed by exchange with n2 as representing lysosomes (n2 = Ly). In panel B, input occurs directly into lysosomes, with n1 = Ly and n2 = eEn. The simulation is based on the assumption that at steady state the bulk of LAMP-1 resides in lysosomes (here taken as 90%). (The curves are an approximation because the input function S has been treated as a first-order process, S = Stotal · [1-e-λ·t], as indicated by the curves for (n1 + n2). This approximation allows for algebraic integration of the underlying differential equations. The more realistic input by sigmoidal characteristics cannot be integrated algebraically. The approximation resulted in the absence of a lag phase at early times as observed experimentally in this study, Figure 8).](/cms/asset/6d8ecb3b-3327-4b02-b078-df272b1d9ba6/imbc_a_572567_f0001_b.jpg)
Methods
Materials
The rat hybridoma cell line was obtained from the Developmental Studies Hybridoma Bank, Department of Biology, University of Iowa; the mouse macrophage cell line, P388D1, from the Institute of Genetics, University of Cologne, Germany; Dulbecco's Minimum Essential Medium (DMEM) RPMI-1640 (developed by Moore et al. in 1966 at the Roswell Park Memorial Institute) and bovine foetal-calf serum from Highveld Biological, South Africa; NCTC-135 medium (developed by the Tissue Culture Section, Laboratory of Biology, National Cancer Institute (NCI), Bethesda, MD; cat. no. N-3262) and opi media supplement (oxaloacetate, pyruvate, and bovine insulin; cat. no. O-5003) from Sigma-Aldrich, USA; Ultrafree-15 centrifugal filter devices from Millipore, USA; methionine-free minimum essential medium (MEM) or methionine-free RPMI 1460 and trans-label 35S-L-Methionine (Specific-Activity = 1175 μCi/mmole) (cat. no. 51006) from MP Biomedicals, USA; horseradish-peroxidase from Seravac Biotech, South Africa; 3′3 DAB from Sigma-Aldrich, USA; Complete Protease Inhibitor Cocktail Tablets from Roche Pharmaceuticals, Switzerland; ImmunoPure Immobilized Protein-G (cat. no. 20398/9) beads from Pierce, USA; Precision Plus protein standards (cat. no. 161-0374) from Biorad, California; KPL LumiGLO (cat. no. 54-61-02) from KPL, USA; Aquasafe 500 Plus liquid scintillation cocktail from Zinsser Analytic, Germany; poly-allomer centrifuge tubes from Beckman Coulter, USA; rabbit polyclonal anti-mouse EEA1 antibody (cat. no. ab14453-50) from Abcam, UK; rabbit polyclonal anti-human Rab5b IgG (cat. no. SC-598) from Santa Cruz Biotechnology, USA; peroxidase-linked polyclonal anti-rabbit secondary antibody (cat. no. NIF824) and nitrocellulose (NC) membrane from GE Healthcare Biosciences, UK.
Cell culture
The hybridoma cell line, ID4B, was cultured in DMEM supplemented with 10% (v/v) NCTC-135, 20% (v/v) heat-inactivated (56°C, 0.5 h) foetal-bovine serum and opi (1vial/l medium), as specified by the suppliers (Hybridoma Bank, University of Iowa) for the production of the monoclonal antibody, ID4B, against mouse LAMP-1 (Immunogen: NIH/3T3 mouse embryo fibroblast tissue culture cell membranes). Antibody-Tissue-Culture Medium (ab-TCM) was harvested from a confluent monolayer and dying cells as described in Harlow and Lane (Citation1988). The mouse macrophage cell line, P388D1, was cultured from a confluent monolayer into suspension in RPMI 1640 medium and cells were harvested as described previously (Haylett and Thilo Citation1986).
Preparation of antibody
Harvested ab-TCM was prepared for storage as described in Harlow and Lane (Citation1988). When ab-TCM was thawed for use, it was centrifuged at 1250 g for 15 min to remove any precipitable protein (Harlow and Lane Citation1988). ab-TCM was concentrated by filtration through an Ultrafree-15 centrifugal filter device at 1250 g. (∼15 h to concentrate 1395 ml to 62 ml, i.e., 22.5-fold concentrated ab-TCM).
Preparation of organelles
Non-crosslinked lysosomes
Harvested P388D1 cells were pooled into 10 ml HeS-BSA (10 mM Hepes, 140 mM NaCl, 1 mg/ml BSA, pH 7.4), washed once with 10 ml HeS-BSA and once with 10 ml homogenization buffer [(HB: 27 ml dH2O + 73 ml HB27 (342 mM Sucrose, 2.74 mM EDTA, 13.7 mM Hepes)]. Cells were re-suspended in HB that contained 1 mM PMSF, 0.1 mM leupeptin at 20–40·106 cells/ml. Cells were cracked in a cell cracker with 12 passes. The cracked cells were transferred to a 10 ml tube and centrifuged at 1000 g for 15 min. If the separation between the pellet and supernatant was not clear, the pellet was re-suspended in 2 ml HB, PMSF, leupeptin. The re-suspended pellet and supernatant were centrifuged again at 1000 g for 15 min. The post-nuclear supernatants (PNS) were pooled. The PNS (1.7 ml) was carefully layered on top of 10 ml 27% Percoll in HB (27 ml Percoll + 73 ml HB27), resting on a 0.5 ml sucrose cushion at the bottom of a poly-allomer tube and centrifuged in an ultra-centrifuge at 35,000 g for 1.5 h at 4°C in a SW40Ti swing-out rotor. Two bands were visible on the resultant gradient. Based on organellar markers, lysosomes were present in the lower band and early endosomes and plasma membrane in the upper band (Haylett and Thilo Citation1986). Fractions (0.5 ml) were collected from the bottom of the gradient using a fraction collector. Lysosomal fractions were pooled and stored at −20°C (or at −70°C for longer periods). To remove the Percoll, lysosomes (about 1 ml) were resuspended in HB, 1 mM PMSF, 0.1 mM leupeptin (final volume = 11.5 ml), transferred to poly-allomer tubes and centrifuged at 100,000 g, for 1 h at 4°C in an SW40Ti swing-out rotor. The supernatant was removed with a Pasteur pipette and discarded. A little supernatant was left to collect the lysosomes which easily slid off the Percoll pellet. To remove the remaining Percoll, lysosomes were centrifuged once or twice for 20 min at 100,000 g (30 psi) in an airfuge at 4°C. Lysosomal membranes were solubilized in lysis buffer (10 mM Tris (pH 7.5), 5 mM EDTA, 150 mM NaCl, 0.5% NP-40, 1 mM PMSF, 0.1 mM leupeptin or 25-fold diluted Complete Protease Inhibitors Cocktail) (D'Souza and August Citation1986) and stored at 4°C if used the next day or at −20°C until use.
Crosslinked early endosomes and lysosomes
P388D1 cells were harvested and washed twice with 10 ml RPMI/Hepes/BSA. The cell suspension was split into two equal aliquots that were re-suspended at 5·106 cells/ml RPMI/Hepes/BSA. Mannan (1 mg/ml) was added to both batches. Mannan blocks the binding of HRP to mannose receptors and thus ensures that HRP is internalized as a fluid-phase marker (Stahl et al. Citation1980; Lang and de Chastellier Citation1985). Cells were warmed for 10 min at 37°C and then HRP (1 mg/ml) was added. One batch of cells was allowed to internalise HRP for 5 min (to prepare early endosomes), the other batch for 30 min (to prepare lysosomes). HRP internalization was stopped by adding 50 ml cold HeSBSA and cooling on ice. Cells were pelleted (200 g for 4 min). The cells with HRP-filled early endosomes were washed twice with 10 ml cold HeSBSA and kept aside on ice for further processing. The cells that contained the 30 min HRP pulse were washed three times with cold 10 ml RPMI/Hepes/BSA and re-suspended at 5·106 cells/ml RPMI/Hepes/BSA. HRP was chased into lysosomes by incubating the cells for 70 min at 37°C followed by cooling on ice. The cells were washed twice with 10 ml cold HeSBSA. Both sets of cells, irrespective of prior HRP uptake, were then processed for HRP−DAB crosslinking. The cells were washed once with 10 ml HB and re-suspended at 40·106 cells/ml cold HB that contained Complete Protease Inhibitors (1 tablet/ml of dH2O, diluted 25-fold). Each set of cells was cracked separately in a cell cracker with 12 passes. The homogenates were centrifuged at 800 g for 5 min and 2−3 ml of each supernatant were centrifuged on a 27% Percoll column as above. Crosslinked early endosomes or lysosomes were collected as a brown band in the upper or lower part, respectively, of the gradient. (White bands were collected in the case of non-crosslinked organelles.) The fractions were stored at 4°C and were washed the next day in a final volume of about 12.5 ml HB to remove the Percoll (100,000 g for 2 h at 4°C). The crosslinked material was collected and concentrated by low-speed centrifugation (8,000 g for 30 min at 4°C). Membranes were solubilized in 10 mM Tris/HCL pH 7.4, 0.9% NaCl (TBS), 1% Triton-X 100, 25-fold diluted Complete Protease Inhibitors Cocktail. Detergent-resistant material was pelleted at 8,000 g for 30 min and the supernatant collected. The protein concentration was determined using the bicinchoninic acid (BCA) assay, as per manufacturer's instructions.
Metabolic labelling of cells
Continuous labelling experiments
Cells were washed once with MEM and incubated at 37°C for 2 h in MEM containing 35S-methionine at 1.16·10-7 M (trans-label 35S-L-Methionine, specific-activity = 1175 μCi/mmole), 10·106 cells/ml. The labelling process was stopped by cooling on ice.
Pulse-chase experiments
Cells were washed twice with 4°C methionine-free RPMI 1640 and starved in this medium at 10·106 cells/ml for 30 min at 37°C. 35S-Methionine was then added to the warm medium at 10-7 to 10-6 M (specific-activity = 1175 Ci/mmole) and the cells were metabolically labelled at 37°C for 5 min. The labelling was stopped by cooling in ice-water. Cells were pelleted by centrifugation at 200 g for 4 min at 4°C and washed three times with 10 ml cold RPMI/Hepes/BSA. The pelleted cells were re-suspended in 1 ml cold RPMI/Hepes/BSA and diluted in pre-warmed medium to 5·106 cells/ml at time zero, followed by incubation for the specified chase periods. The chase was stopped by collecting samples of 1 ml (5·106 cells) and cooling by dilution in 10 volumes of ice-cold HeS-BSA. During the labelling process HRP was either localized to the endocytic pathway, lysosomes or early endosomes.
Localization of HRP in endosomes to trap proteins
Endocytosis of HRP was in medium with 1 mg/ml HRP and 1 mg/ml mannan, unless otherwise stated. Mannan was always added at least 5 min prior to the addition of HRP. To load the endocytic pathway, HRP was present for 70 min prior to and during the 30-min starvation of the cells and throughout all subsequent incubations. Early endosomes were loaded with HRP during the last 5 min of the chase periods. To load lysosomes, HRP was endocytosed for 30 min and then chased for 40 min prior to the 30-min starvation period. The rest of the experiment was performed in the absence of HRP.
HRP−DAB crosslinking
Metabolically labelled and HRP-containing cells were subjected to HRP−DAB crosslinking (Courtoy et al. Citation1984; Ajioka and Kaplan Citation1987). Cells (∼5·106 cells) were washed twice with cold HeS-BSA (10 ml) and once with 10 ml HeS, during which the cells were transferred to a clean tube. Cells were re-suspended in 2 ml HeS and split into two 1 ml aliquots. One aliquot (∼2·106 cells) was treated with DAB and hydrogen peroxide (H202) as follows: DAB was prepared fresh at 3 mg/ml in HeS. The DAB suspension was mixed in a sonicator bath for 5 min and filtered through a 0.4 μm Millipore filter. The filtered DAB was added at 180 μl/ml of cell suspension. The cells were gently mixed and incubated in the dark on ice for 30 min with occasional mixing. Cells were then rapidly warmed to room temperature using a 37°C water bath. H2O2 (0.3%) was added to a final concentration of 0.03%. Cells were incubated in the dark for 20 min at room temperature with occasional mixing. The crosslinking process was stopped by adding four volumes of cold HeS-BSA. Cells were washed three times with 10 ml cold HeS-BSA. The aliquots for non-crosslinked controls were treated exactly the same, but without DAB and H2O2 being present.
Cell lysis
Continuous labelling experiments
The cells were washed three times with 10 ml cold HeS-BSA. On the third wash the cells were transferred to a clean tube. The labelled cells were then incubated on ice for 30 min in lysis buffer at a final concentration of ∼40·106 cells/ml, with occasional mixing on a vortex. The lysate was freeze-thawed three times, using liquid N2 for snap freezing and a 37°C water bath for rapid thawing (D'Souza and August Citation1986). Detergent-resistant material was removed by centrifugation in a microfuge, twice at 8,000 g for 15 min at 4°C. The detergent-soluble material was retained for immunoprecipitation.
Pulse-chase experiments
After HRP-DAB crosslinking, cells were pelleted at 200 g for 4 min, re-suspended in ∼1 ml HeS-BSA and transferred to Eppendorf tubes (1.5 ml). Cells (<2.5·106) were again pelleted at 200 g for 4 min and re-suspended in 200 μl lysis buffer. The lysate was agitated overnight at 4°C. Detergent-resistant material was removed by centrifugation, twice at 8,000 g for 30 min at 4°C. The detergent-soluble material was retained for immunoprecipitation.
Immunoprecipitation
Antibody (10 μl of 10-fold concentrated ID4B-TCM) was added to 160–180 μl of the detergent-soluble fraction of the lysate. The antibody-lysate mixture was incubated overnight at 4°C on a vortex shaker. Precipitable material was then removed by centrifugation at 8,000 g for 15 min at 4°C. The soluble protein suspension was then incubated with 50 μl protein-G beads for 2 h at 4°C on a vortex shaker. The immuno-complexed beads were washed three times with cold lysis buffer, transferred to a clean tube during the 4th wash, washed again twice with cold lysis buffer and once with distilled H2O. Subsequently, antigen-antibody complexes were eluted with 0.1 M Gly/HCl, pH 2.6 at room temperature. Beads were incubated with 55 μl of buffer for 5 min on a vortex shaker at room temperature, pelleted and the eluent (40 μl) was collected. The elution was repeated with 20 μl elution buffer that was pooled with the first eluent. The pH of the eluent was increased to 7.0 with 3.6 μl of 2 M Tris at pH 8.0.
SDS-PAGE and product analyses of samples from crosslinking experiments
Three-fold-concentrated, reducing-sodium dodecyl sulphate (SDS)-sample buffer (31.8 μl) was added to the total eluent of 60 μl. Samples were incubated at 95°C for 5 min. High molecular-weight (MW) markers or precision-plus dual-colour MW markers (2.5 μl per sample) were added to aid in the cutting-out of the LAMP-1 bands. The eluents were then chromatographed by SDS-PAGE on mini-gels (7%) until the dye front was run off the gel for 40 min. The gel was silver-stained (as adapted from Meril et al. Citation1984) and the LAMP-1 bands were excised from the gel using the MW markers as reference points. The gel pieces (1.5 mm thick, ∼1 cm wide, ∼1–2 cm long) were solubilized in 2 ml 30% H2O2 at 60°C overnight. Aquasafe 500 Plus liquid scintillation cocktail (18 ml) was added to the solubilized gel pieces and samples were counted in a Packard Liquid Scintillation Analyzer.
Western blot
BioRad's Miniprotein II or III cell system was used to resolve the proteins by SDS-PAGE and to transfer the proteins to a NC membrane (Burnette Citation1981) using transfer buffer, 20 mM Tris, 150 mM Gly, 20% methanol (100 V for 1 h, 4°C). Immediately following transfer, the NC membrane was blocked in 5% fat-free milk powder, TBS-T (10 mM Tris/HCL pH 7.4, 0.9% NaCl, 0.1% Tween 20) overnight at 4°C and washed with TBS-T as specified in Amersham's package insert. The blot was then incubated in primary antibody in TBS-T, 0.5% fat-free milk powder for 1 h at room temperature and the washing process was repeated. The primary antibody was detected with peroxidase-linked secondary antibody in TBS-T, 0.5% fat-free milk powder and the washing process was repeated. The blot was developed with KPL luminoGLO.
Results
Optimizing experimental conditions for the quantitative assessment of LAMP-1 in endocytic organelles by HRP-catalyzed crosslinking with DAB
The measurements in this study depended on quantitating the amount of newly-synthesized, 35S-methionine-labelled LAMP-1 (35S-LAMP-1) in endocytic organelles where it was trapped by HRP-mediated crosslinking with DAB. Because crosslinking rendered LAMP-1 detergent-insoluble, the fraction of trapped [crosslinked] 35S-LAMP-1 was determined by measuring the complementary amount of 35S-LAMP-1 in the soluble fraction and expressing this as a fraction of the total 35S-LAMP-1 as in non-crosslinked duplicate samples. Accordingly, this ratio depended on two quantitative measurements of soluble LAMP-1 as captured by immunoprecipitation. Due to the semi-quantitative nature of this method, conditions were optimized as stringently as was possible in order to ensure reproducible measurements. Because the aim was to provide kinetic information of sufficient resolution and extent, data from independent experiments had to be pooled in order to obtain the required number of data points for each time course. It was therefore essential that the results were quantitatively reproducible within and between experiments. In order to obtain a high kinetic resolution, cells were starved for 30 min in serum- and methionine-free media so that only a short period (5 min) of metabolic labelling with 35S-methionine would result in sufficient signal.
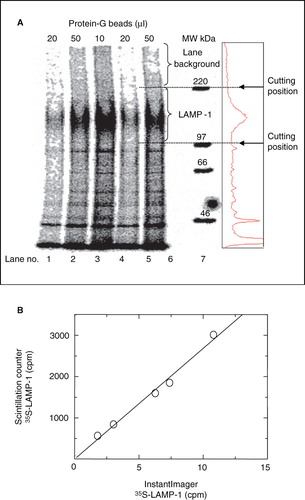
The amounts of soluble 35S-LAMP-1 were determined as illustrated in . Immunoprecipitated LAMP-1 was separated by SDS-PAGE and detected by auto-radiography. Although quantification could be performed directly through digital analysis of the LAMP-1 band on the auto-radiographs, experimental conditions with only a 5-min labelling period yielded amounts of 35S-LAMP-1 that would have required long exposure times to generate a sufficient signal. A more efficient way of quantification consisted of cutting out the LAMP-1 band directly, without auto-radiography, and solubilizing the protein for measurement by scintillation counting. In the absence of an auto-radiographic band as guidance, the position on the gel of 35S-LAMP-1 to be cut out was determined by reference markers as indicated in . A linear relationship between quantification by the two methods indicated that scintillation counting was a valid way of measuring the amount of soluble 35S-LAMP-1 and was 300-fold more sensitive than Imager densitometry.
Figure 2. Quantification of immunoprecipitated 35S-LAMP-1 using Instant Imager scanning software versus liquid scintillation counting. (A) P388D1 cells were metabolically labelled with 35S-methionine at 10-7 M (specific-activity = 1175 Ci/mmol) for 2 h. Soluble 35S-LAMP-1 was immunoprecipitated from 200 μl soluble cell extract (10·10-6 cells) with 10 μl ID4B-containing, 50-fold concentrated TCM and the indicated protein-G bead volumes. Eluents were subjected to SDS-PAGE, followed by autoradiography for 64 h. The immunoprecipitated 35S-LAMP-1 was quantified by digital analysis using Instant Imager software. The radio-activity profile of lane 5 was aligned to the lane by eye (box at right). (B) LAMP-1 bands were excised relative to MW markers, as indicated, dissolved in 2 ml 30% H2O2 overnight at 60°C and quantified by scintillation counting in a scintillation counter. The counts obtained from the scintillation counter correlated linearly (slope of 268) with the counts obtained from the Instant Imager detection method.
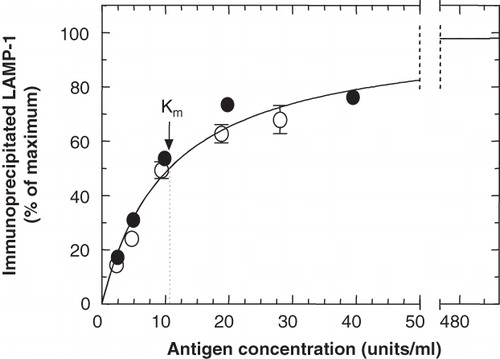
In order to determine the concentration range of LAMP-1 over which a linear dose-response for its detection could be observed, fixed amounts of protein-G beads and anti-LAMP-1 antibodies (ID4B) were used to precipitate LAMP-1 from increasingly higher concentrations of this antigen, . According to the indicated curve for Michaelis-Menton kinetics, the response could be considered linear up to an antigen concentration of approximately 10 units/ml (the concentration of LAMP-1 when 107 cells were lysed in 1 ml lysis buffer). Therefore, the pulse-chase experiments were designed so as to keep the concentrations of LAMP-1 below this level.
Figure 3. Optimization of the cell-concentration range to be used for the quantitative immunoprecipitation of LAMP-1. 35S-LAMP-1 was immunoprecipitated from a detergent-soluble fraction of cell lysate (160 μl) at increasing concentrations (1 unit of LAMP-1 was as obtained from 106 cells), with ID4B (2 μl of 50-fold concentrated TCM) and protein-G beads (50 μl). Error bars (where larger than symbol) indicate variation between duplicate samples from the same experiment. Different symbols refer to independent experiments. The curve shows Michaelis-Menton kinetics with a Km = 10.63 units/ml.
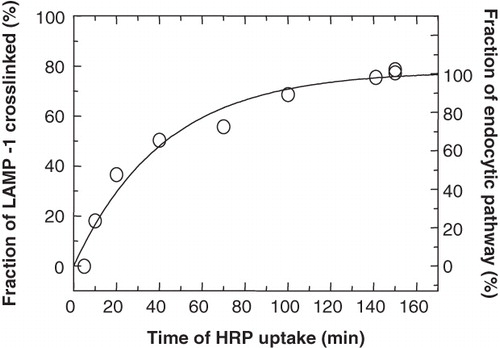
The established conditions for the quantification of LAMP-1 could now be used to determine the conditions for its effective DAB-crosslinking as catalyzed by HRP in endocytic organelles. First, it was determined how the period of HRP internalization related to the efficiency of LAMP-1 crosslinking when it was present in the entire endocytic pathway. After labelling LAMP-1 with 35S-methionine for 1 h, followed by a chase to maturation and steady-state distribution for 1 h in the presence of unlabelled methionine, HRP was entered into the endocytic pathway by continuous uptake of HRP at 3 mg/ml, followed by DAB-crosslinking and measuring the fraction of 35S-LAMP-1 that remained soluble. As shown in , the complementary fraction of crosslinked LAMP-1 reached a maximum after HRP internalization for about 100 min. From this we concluded that in pulse-chase experiments where LAMP-1 was to be crosslinked in the entire endocytic pathway, HRP had to be internalized for at least 100 min before the 5-min pulse of 35S-LAMP-1 was chased to steady state in the continued presence of HRP. To ensure that the same pool of lysosomal LAMP-1 was reached in pulse-chase experiments where LAMP-1 was to be crosslinked only in lysosomes, an HRP pulse had to be internalized and chased for at least the same total length of time, i.e., 100 min. It has been shown in P388D1 cells that endocytic content markers (HRP or labelled dextran) start to enter lysosomes at about 5 min after uptake and requires a chase of at least 60 min to allow for delivery and proper distribution within lysosomes (Thilo et al. Citation1995). Therefore, a 30-min pulse of HRP could be chased for at least 70 min, allowing for a total period of 100 min before the 5-min pulse of 35S-LAMP-1 was chased to steady state.
Figure 4. Maximal crosslinking of LAMP-1 in the endocytic pathway. P388D1 cells were starved in serum-free and methionine-free medium for 30 min and metabolically labelled with 35S-methionine for 1 h, followed by a chase to maturation for 1 h in the presence of unlabelled methionine. Subsequently, HRP (3 mg/ml) was endocytosed for the indicated times, when samples were taken and cooled on ice. Samples were split into two fractions, one of which was treated for HRP-DAB crosslinking. The other fraction served as a measure for total 35S-LAMP-1. In both fractions, the soluble (non-crosslinked) 35S-LAMP-1 was quantified by scintillation counting of the appropriate band after SDS-PAGE of the immunoprecipitated soluble LAMP-1. The degree of 35S-LAMP-1 crosslinking was obtained by expressing the complementary LAMP-1 that remained soluble as a fraction of the total 35S-LAMP-1 in each sample. A curve was fitted manually. Close to maximum levels were reached after 100 min with a maximum crosslinking of 76% after about 150 min.
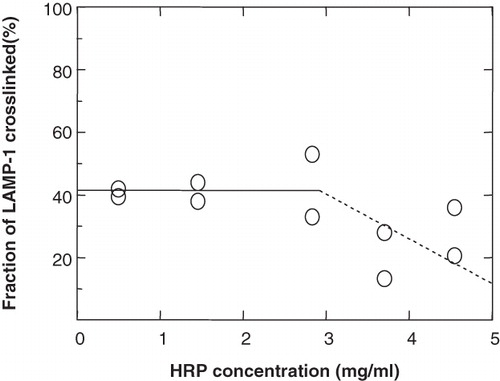
The next step was to determine whether a 30-min pulse of HRP was sufficient to crosslink LAMP-1 selectively in lysosomes and that possible degradation did not cause HRP depletion in lysosomes. For this, a 30-min pulse of increasing HRP concentrations was chased for a period of about 2.5 h. (The total duration of a crosslinking experiment was ∼3 h). As shown in , the fraction of LAMP-1 crosslinked in lysosomes remained constant (40%) and independent of HRP concentration below 3 mg/ml, but for unknown reasons seemed to decrease and become less reproducible at higher concentrations. Accordingly, an HRP concentration less than 3 mg/ml (i.e., 1 mg/ml) was chosen for crosslinking in lysosomes.
Figure 5. The effect of HRP concentration in a 30-min pulse on the crosslinking of LAMP-1 in lysosomes. P388D1 cells were starved for 15 min in serum-free and methionine-free medium. 35S-methionine was added, the cell suspension split into 5 aliquots and cells were metabolically labelled at 37°C for 1.5 h. HRP was internalized at the indicated concentrations during the last 30 min of the labelling period. The internalized HRP was chased to lysosomes for a further 2.5 h (total duration of a crosslinking experiment was ∼3 h). Aliquots were split into two fractions, one of which was treated for HRP-DAB crosslinking. Samples were analysed for the degree of crosslinking, as described in . Symbols refer to duplicate immunoprecipitations of individual samples within the same experiment.
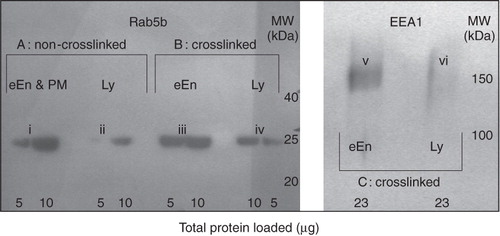
It has been shown kinetically that the average maturation time of early endosomes in P388D1 cells is about 3 min and that endocytic content markers (HRP or labelled dextran) only start to enter lysosomes from about 5 min after uptake (Haylett and Thilo Citation1986; Thilo et al. Citation1995). A 5-min HRP pulse was thus chosen to load early endosomes. To confirm qualitatively that a 5-min pulse of HRP uptake consisted essentially of early endosomes, the crosslinked organelles were isolated and tested for the early-endosome markers, Rab5b (Bucci et al. Citation1995) and EEA1 (Mu et al. Citation1995). The intensity of staining was compared with non-crosslinked early endosomes and crosslinked lysosomes (30 min HRP pulse, chased for 70 min) (). After crosslinking in whole-cells, cells were fractionated and centrifuged on a 27% Percoll density-gradient to separate early endosomes (eEn; top of gradient), from a high-density fraction of lysosomes (Ly; bottom of gradient), as had been determined previously with organellar markers (Haylett and Thilo Citation1986). Crosslinked organelles were separated from HRP-free membranes on the basis of their increased density by low-speed centrifugation. Crosslinked organelles that resulted from a 5-min HRP-pulse stained positive for both early endosomal markers (, bands iii and v). The extent of staining of Rab5b was similar to that observed for non-crosslinked early endosomes (, band i). Some limited staining for Rab5b and EEA1 was also observed for crosslinked lysosomes (, bands iv and vi) and limited Rab5b was also observed in non-crosslinked lysosomes (, band ii). This could be due to contamination of the lysosomal fraction on the 27% Percoll gradient with early endosomes, although no plasma membrane has previously been detected in the high-density lysosomal fraction (Haylett and Thilo Citation1986). A protein similar to Rab5b has been detected in lysosomes in low abundance (Bagshaw et al. Citation2005).
Figure 6. Characterization of crosslinked early endosomes by EEA1 and Rab5b. Early endosomes (eEn; 5 min HRP pulse) or lysosomes (Ly; 30 min HRP pulse, 70 min chase) were filled with HRP, crosslinked and collected as brown bands from the low-density or high-density fractions of a 27% Percoll gradient, respectively, as was previously determined with organellar markers (Haylett and Thilo Citation1986). Crosslinked organelles were then separated from non-crosslinked membranes through precipitation by low-speed centrifugation. Peripheral proteins were solubilized, subjected to SDS-PAGE and Western blotting. Rab5b was separated on a 13% gel and identified with primary rabbit polyclonal anti-human Rab5b antibody (2 μg/ml). EEA1 was separated on a 7% gel and identified with rabbit polyclonal primary antibody against mouse EEA1 (2 μg/ml). Detection was via a peroxidase-labelled anti-rabbit secondary antibody. Early endosomes were positive for EEA1 and Rab5b. Section A: Non-crosslinked, soluble, HRP-free membranes as from top (eEn and PM) or bottom (Ly) fractions of the Percoll density-gradient. Sections (B) and (C): Crosslinked organelles only, with HRP-free organelles removed. Crosslinked organelles that resulted from a 5-min HRP-pulse stained positive for both early endosomal markers (bands iii and v).
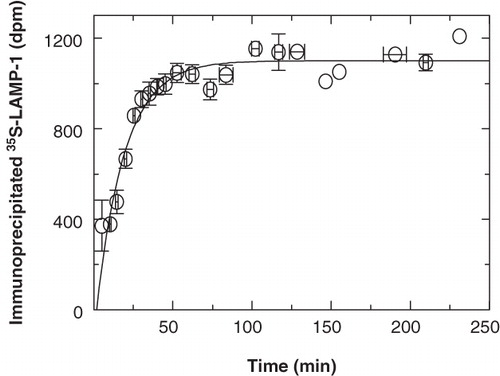
Because the amount of LAMP-1 served as the time reference for studying the kinetics for its delivery into organelles of the endocytic pathway, it was important to ensure that its rate of synthesis remained constant throughout experiments. shows the kinetics of how newly-synthesized 35S-LAMP-1 was processed into immunoprecipitable antigen as observed at full length on SDS-PAGE. After a 5-min pulse of 35S-methionine labelling, LAMP-1 was processed into mature immunoprecipitable 35S-LAMP-1 with a half-time of approximately 14 min, resulting in full immunoprecipitability within 50–60 min. What do these kinetics imply? Because the experimental conditions were chosen such that the methionine concentration did not present a rate-limiting factor, it could be assumed that the rate of protein synthesis, including LAMP-1, remained constant from immediately after the pulse-labelling period when excess unlabelled methionine had been added. Therefore, the gradual decrease in the rate at which full-length 35S-LAMP-1 became immunoprecipitable with time was not due to a decrease in the rate of overall LAMP-1 synthesis. It was also not due to a gradual dilution of the 35S-methionine concentration when it was replaced by excess unlabelled methionine, as judged by a rapid termination in the incorporation of 35S-methionine into total protein (by acid precipitation) after 5 min (data not shown). Because 35S-LAMP-1 was observed with immunoprecipitation and SDS-PAGE, it would only be detected once it had become immunoprecipitable and had attained its full molecular size. Therefore, the first-order decrease in the rate at which 35S-LAMP-1 became immunoprecipitable suggested that immature 35S-LAMP-1 in the Golgi became diluted with subsequently synthesized, unlabelled LAMP-1 while it was processed into immunoprecipitable, full-length protein on a random, rather than on a first-come-first-serve, basis.
Figure 7. Biosynthetic processing of immunoprecipitable 35S-LAMP-1. P388D1 cells were starved in methionine-free medium for 30 min at 37°C. At time zero, 35S-methionine was added at 10-7 M (specific activity = 1175 Ci/mmole) and cells were labelled for 5 min. 35S-LAMP-1 was then chased for the indicated time, immunoprecipitated, processed via SDS-PAGE and quantitated by scintillation counting. The data were obtained by combining the values for total newly-synthesized soluble immunoprecipitable 35S-LAMP-1 as from all non-crosslinked fractions of the kinetic experiments to follow. Since all experiments did not extend across the entire time-course, data from individual experiments were normalized to a best-fit steady state that started at approximately 60 min and averaged around 1000 dpm. The average from the different experiments is shown. Vertical error bars indicate variation (SEM) among the data obtained in the time intervals indicated by the horizontal bars. The first-order curve, fitted to the data with the background as a free parameter, indicated a half-time of 14 min for the processing of LAMP-1 into immunoprecipitable full-length protein.
Kinetics for the entry of newly-synthesized LAMP-1 into organelles of the endocytic pathway
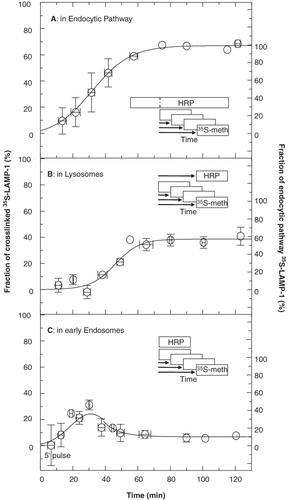
The conditions as established above were applied to investigate the time course for the presence of newly-synthesized LAMP-1 in specific compartments of the endocytic pathway, namely, the entire endocytic pathway, early endosomes, and lysosomes, as experimentally defined by the time regime of endocytosed HRP. The kinetics with which newly-synthesized LAMP-1 entered the endocytic pathway in general served as a reference for the specific entry into either early endosomes or directly into lysosomes. The data in showed that the entry of 35S-LAMP-1 into the endocytic pathway followed a sigmoidal time course which commenced almost immediately after the 5-min labelling pulse. The appearance of LAMP-1 in lysosomes occurred with a lag of about 25 min and reached a steady state after about 60–70 min when about 39% of 35S-LAMP-1 localized in lysosomes (). A comparison with the entry of 35S-LAMP-1 into the endocytic pathway showed that it entered lysosomes with a clearly pronounced lag ( vs. ). This suggested that the bulk of 35S-LAMP-1 entered the endocytic pathway via an endocytic organelle other than lysosomes. The time course for entry of LAMP-1 into early endosomes was as in . 35S-LAMP-1 appeared in early endosomes immediately after the 5-min labelling pulse, concurrently and to the same initial extent as its appearance in the endocytic pathway as a whole. This implied that the bulk of 35S-LAMP-1 entered the endocytic pathway via this compartment. Its transient presence in early endosomes showed that these organelles represented a station en route to lysosomes. Because technical constraints limited the number of data points within a single experiment to 9, the data as indicated represent a composite of six independent experiments. Experimental variations did not interfere with the general pattern. The conclusions about the movement of LAMP-1 were not dependent on any particular time point(s), but were based on the general trend and shape of the kinetic curves in comparison to predicted time courses as in .
Figure 8. Delivery of newly-synthesized 35S-LAMP-1 into endocytic organelles. (A) The entire endocytic pathway. The endocytic pathway of P388D1 cells was filled with HRP (70 min). In the continued presence of HRP, cells were starved in serum-free and methionine-free medium (30 min) and then metabolically labelled with 35S-methionine for 5 min at time zero. In total, HRP was endocytosed for 100 min before metabolic labelling was performed. This was followed by further incubation in the presence of unlabelled methionine and HRP for the indicated times, when samples were taken and cooled on ice. One half of each sample was treated for HRP-mediated DAB crosslinking. The other half served to measure total immunoprecipitable 35S-LAMP-1. In both aliquots, soluble 35S-LAMP-1 was quantified by scintillation counting of the appropriate band after SDS-PAGE of immunoprecipitated LAMP-1. Delivery of 35S-LAMP-1 into the endocytic pathway was expressed as the amount of crosslinked 35S-LAMP-1, as a fraction of the total 35S-LAMP-1. The average from six independent experiments is shown. Vertical error bars indicate variation (SEM) among the data obtained from different experiments as grouped in the time intervals indicated by the horizontal bars. The curve was fitted manually. 67% of 35S-LAMP-1 was crosslinked at steady state. As indicated by the ordinate at the right, this value was normalized to represent a steady state of 100% LAMP-1 in the endocytic pathway. (B) Lysosomes. An HRP-uptake pulse (30 min) was chased into lysosomes for 70 min. This was equivalent to a total time for HRP delivery of 100 min before metabolic labelling. Cells were starved in serum-free and methionine-free medium during the last 30 min of the HRP-chase and then labelled with 35S-methionine for 5 min. This was followed by further incubation in the presence of unlabelled methionine, but absence of HRP for the indicated times. Samples were processed and data analysed as in (A). The fraction of total 35S-LAMP-1 crosslinked in lysosomes at steady state was ∼39%. The ordinate at the right indicates the fraction of crosslinked LAMP-1 as a percentage of maximal crosslinking in the endocytic pathway (i.e., 58%). (C) Early endosomes. Cells were starved and metabolically labelled as in (A). HRP was only added during the last 5 min of each time point. Samples were processed and data were analysed as described in (A). The fraction of crosslinked 35S-LAMP-1 reached a maximum of about 25% after 30 min and then levelled off to a steady state of ∼ 6.8% that was equivalent to 10% of endocytic pathway LAMP-1, as indicated by the ordinate at the right. The data are compatible with a transient presence of LAMP-1 in early endosomes.
Discussion and conclusion
The kinetic observations in P388D1 cells agree with the set of modelled curves that depict LAMP-1 delivery via early endosomes (cf. with , disregarding the difference at early time points due to the idealized exponential input of newly synthesized LAMP-1 instead of the observed sigmoid kinetics). The bulk of 35S-LAMP-1 entered the endocytic pathway via early endosomes with subsequent delivery to lysosomes. It can be expected that this delivery proceeds via the late endosomes as an intermediate stage. Because HRP could not be loaded exclusively into late endosomes, it was not possible to measure specific crosslinking of LAMP-1 in this compartment. Therefore, the presence of 35S-LAMP-1 in late endosomes was calculated as the difference between the amount of LAMP-1 in the total endocytic pathway and the combined amounts in early endosomes and lysosomes. When the curves in were combined in this way, the kinetics of delivery to late endosomes could be calculated as in . Kinetic resolution between late endosomes and lysosomes was not possible, but the steady-state values clearly indicated that late endosomes constituted a significant (HRP-containing) reservoir in the endocytic pathway.
Figure 9. Comparison of the entry of 35S-LAMP-1 into individual compartments. The curves obtained for the experiments where 35S-LAMP-1 was crosslinked in the endocytic pathway (EP), lysosomes (LYS) and early endosomes (early EN) were used to calculate the curve for 35S-LAMP-1 entry into the late endosomes (late EN) by subtracting the sum of the early endosomal and lysosomal curves from that of the endocytic pathway. At steady state, the fraction of total 35S-LAMP-1 crosslinked in late endosomes was 21%. The ordinate at the right indicates the fraction of crosslinked LAMP-1 as a percentage of maximal crosslinking in the endocytic pathway, i.e., 32%. The congruence between the curves for early EN and the EP at early times (≤25 min) indicated that all LAMP entered via early EN.
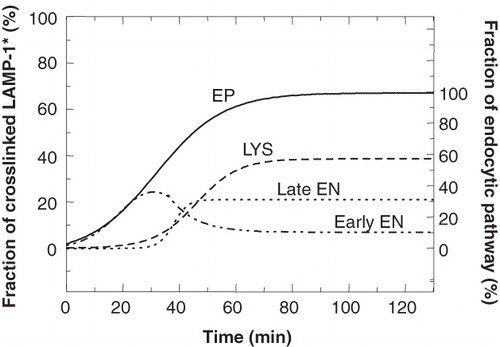
The values at early times (<25 min) clearly showed that the full complement of newly synthesized LAMP-1 in the endocytic pathway could initially be ascribed to its presence in early endosomes (no lag and difference of abundance between endocytic pathway and early endosomes). Only after about 25 min did LAMP-1 start to appear in late endosomes and lysosomes. This allows the conclusion that the pathway via early endosomes is the only major pathway during the initial stages of entry into the endocytic pathway. The values at later times indicated the relative amounts of LAMP-1 in the respective organelles at steady state. The maximum crosslinking in the endocytic pathway of 67% () was slightly less than the 76% observed for a very long labelling pulse with 35S-methionine () and could be considered to be within the experimental variation resulting from the two different labelling conditions (5 vs. 60 min, respectively). This still left the complementary fraction of about 30% of total soluble, non-crosslinked LAMP-1 unaccounted for. Although some of this might be due to LAMP-1 in the biosynthetic pathway at steady state, the major contribution probably resulted from less than 100% crosslinking efficiency in HRP-containing organelles, as suggested by only 77% crosslinking efficiency for the luminal lysosomal enzyme, hexose aminidase (data not shown). A minor fraction of non-crosslinked LAMP-1 could also be attributed to the plasma membrane, with 2% of LAMP-1 occurring on the cell surface of chicken fibroblasts (Lippincott-Schwartz and Fambrough Citation1986) and of HL60 cells (Carlsson and Fukuda Citation1992). When considering only LAMP-1 in the endocytic pathway (67% normalized to 100%), we could conclude that at steady state 58% resided in lysosomes, 10% in early endosomes and 32% in late endosomes (right ordinates of and ). It is important to point out that our data and conclusions have been based on the P388D1 cell line and will most likely apply to other macrophage-like cells as well, but may not be valid for all cell types.
Under steady-state conditions, as in our experiments, it could be expected that the rate at which LAMP-1 enters into the endocytic pathway was constant. The initial 10- to 15-min lag () could be ascribed to processing of 35S-LAMP-1 through the endoplasmic reticulum and Golgi. The observation that the 5-min pulse of 35S-LAMP-1 was processed within 50–60 min into mature immunoprecipitable 35S-LAMP-1 (), and that by that time almost the full endocytic contingent of 35S-LAMP-1 had entered the endocytic pathway (), suggested that entry into the endocytic pathway is a rapid process. This is in accordance with previous observations that for most proteins the rate-limiting step in their trafficking from the site of synthesis to their final destination is their exit from the ER, with subsequent steps being rapid (Lodish et al. Citation1983).
Our experiments have not measured the fraction of newly-synthesized LAMP-1 that trafficks through the plasma membrane. The membrane of early endosomes is in rapid dynamic equilibrium with the plasma membrane and is turned over within less than 3 min by internalization and recycling of plasma membrane (Burgert and Thilo Citation1983; Lippincott-Schwartz and Fambrough Citation1986). Due to this rapid turnover, it is experimentally difficult to resolve the plasma membrane and early endosomes kinetically, and not possible by the approach of the present study. The extent of movement through either plasma membrane or early endosomes may thus not necessarily differentiate between delivery from the TGN along the secretory pathway to the plasma membrane in rapid exchange with early endosomes, or along an intracellular pathway directly to early endosomes (Hunziker and Geuze Citation1996; Janvier and Bonifacino Citation2005).
Several studies have demonstrated the involvement of adaptor proteins, AP-1, AP-2 and AP-3, in sorting steps for LAMP delivery to lysosomes. Evidence for the involvement of AP-2 and AP-3 supports passage of LAMP through the plasma membrane/early endosome compartment. The cytosolic domain of LAMP-1 binds AP-2, an adaptor localized to the cell surface (Honing et al. Citation1996). AP-2 depletion results in a three- to five-fold higher increase in cell-surface expression of LAMPs than do the depletion of any of the other adaptor proteins. This results in a 40–60% reduction in targeting of LAMP to lysosomes (Janvier and Bonifacino Citation2005). This suggests that a substantial fraction of newly synthesized LAMP trafficks via the cell surface. However, the authors have indicated that the increased proportion of LAMP on the cell surface could be due to new arrival from the TGN either via the secretory pathway or early endosomes. Depletion of AP-3, in HeLa, NRK cells and mouse fibroblasts, causes transient misrouting of LAMP-1 to the plasma membrane without affecting its overall steady-state distribution (Le Borgne et al. Citation1998). AP-3 deficiency in Hermansky-Pudlak syndrome patients' fibroblasts results in increased steady-state surface expression of LAMPs, but not of non-lysosomal proteins (Dell'Angelica et al. Citation1999). Also, depletion of AP-3 increases LAMP trafficking through the cell surface and causes a less than two-fold increase of LAMP-1 at the cell-surface (Janvier and Bonifacino Citation2005). These observations implicate AP-3 in LAMP sorting to lysosomes. Evidence that AP-3 mediates LAMP trafficking mainly via endosomes has been mounting (Dell'Angelica et al. Citation1997, Citation1998; Peden et al. Citation2004; Theos et al. Citation2005, Baust et al. Citation2008). The fact that LAMP-1 has been localized to AP-1 clathrin-coated vesicles (CCVs) on the trans region of the Golgi complex (Honing et al. Citation1996) has suggested that LAMPs are delivered to the plasma membrane/early endosome compartment from the TGN via an intracellular route since CCVs do not transport their cargo along the secretory route to the plasma membrane (Urbe et al. Citation1997). Nevertheless, observations both for and against the possible involvement of AP-1 in LAMP trafficking indicate that it may only play a minor or a secondary role (Ohno et al. Citation1995; Honing et al. Citation1996; Karlsson and Carlsson Citation1998; Meyer et al. Citation2000; Janvier and Bonifacino Citation2005; Chapuy et al. Citation2008). Immunofluorescence in mammalian cells has also localized AP-3 to peri-nuclear buds or vesicles of the TGN (Simpson et al. Citation1996, Citation1997; Dell'Angelica et al. Citation1997, Citation1998). While this was observed to a lesser extent by Peden et al (Citation2004), in vitro experiments have also shown that the incorporation of LAMP-1 into Golgi/TGN-derived vesicles is AP-3 dependent (Chapuy et al. Citation2008). Thus the issue whether AP-3 is involved in LAMP trafficking at the TGN remains controversial (Dell'Angelica, Citation2009). The fact that depletion of AP-1 or AP-3 does not result in accumulation of LAMP in either the TGN or early endosomes (Janvier and Bonifacino Citation2005) suggests that an alternative mechanism/adaptor may also function in LAMP trafficking at the TGN or early endosomes.
The involvement of AP-3 in LAMP sorting in early endosomes may serve to explain the noticeable observation of the present study that newly-synthesized LAMP-1 started to appear in late endosomes and lysosomes only after a lag of about 25 min, rather than after 5 min, concurrent to the delivery of endocytic contents (e.g., HRP or fluorescently tagged dextran) to lysosomes (Thilo et al. Citation1995). One explanation for the delayed forwarding of newly-synthesized LAMP-1 from early endosomes could be that in contrast to endocytic contents in vesicular aspects of early endosomes, they become part of the tubular sorting endosomes and have to undergo a sorting step prior to lysosomal delivery. In this regard it is of interest that LAMPs co-localise with AP-3 to a novel tubular sorting endosome, where AP-3 has been implicated in sorting LAMPs from recycling membrane proteins destined for the plasma membrane or the TGN (Peden et al. Citation2004). The accumulation of tyrosinase, destined for melanosomes (lysosome-related organelles), in endosomes of AP-3-deficient melanocytes suggests that AP-3 sort proteins directly from endosomes (Theos et al. Citation2005). Knockdown of PI-3P and PI-3 kinase IIIC3 alters AP-3 binding onto peripheral structures and increases LAMP-1 accessibility to the cell surface (Baust et al. Citation2008). This evidence strongly points to a role of AP-3 in sorting of lysosomal membrane proteins in early sorting endosomes. The present observation of a lag in lysosomal delivery of LAMP can have mechanistic implications. Random processing of a molecular pulse will result in first-order kinetics, to be observed by a slow, but immediate appearance of the pulse. The observation of a lag under the present pulse-chase conditions implies that the sorting process occurs on the basis of ‘first-come-first-sorted’ events. Since such a non-random process cannot be expected to happen at the level of individual protein interactions, it strongly suggests that sorting involves segregation into larger structures with subsequent zero-order processing.
Declaration of interest : This work was funded in part by a grant to LT from the South African Medical Research Council. The authors report no conflicts of interest. The authors alone are responsible for the content and writing of the paper.
References
- Ajioka RS, Kaplan J. 1987. Characterization of endocytic compartments using the Horseradish peroxidase-diaminobenzidine density shift technique. J Cell Biol 104:77–85.
- Akasaki K, Fukuzawa M, Kinoshita H, Furuno K, Tsuji H. 1993. Cycling of two endogenous lysosomal membrane proteins, lamp-2 and acid phosphatase between the cell surface and lysosomes in cultured rat hepatocytes. J Biochem 114:598–604.
- Akasaki K, Michihara A, Mibuka K, Fujiwara Y, Tsuji H. 1995. Biosynthetic transport of a major lysosomal membrane glycoprotein, Lamp-1: Convergence of biosynthetic and endocytic pathways occurs at three distinctive points. Exp Cell Res 220:464–473.
- Akasaki K, Michihara A, Fujiwara Y, Mibuka K, Tsuji H. 1996. Biosynthetic transport of a major lysosome-associated membrane glycoprotein 2, LAMP-2: A significant fraction of newly synthesized LAMP-2 is delivered to lysosomes by way of early endosomes. J Biochem 120:1088–1094.
- Andrejewski N, Punnonen E-L, Guhde G, Tanaka Y, Lullmann-Rauch R, Hartmann D, von Figura K, Saftig P. 1999. Normal lysosomal morphology and function in LAMP-1-deficient mice. J Biol Chem 274:12692–12701.
- Bagshaw RD, Mahuran DJ, Callahan JW. 2005. A proteomic analysis of lysosomal integral membrane proteins reveals the diverse composition of the organelle. Mol Cell Proteomics 4:133–143.
- Barriocanal JG, Bonifacino JS, Yuan L, Sandoval IV. 1986. Biosynthesis, glycosylation, movement through the Golgi system, and transport to lysosomes by an N-linked carbohydrate-independent mechanism of three lysosomal integral membrane proteins. J Biol Chem 261:16755–16763.
- Baust T, Anitei M, Czupalla C, Parshyna I, Bourel L, Thiele C, Krause E, Hoflack B. 2008. Protein networks supporting AP-3 function in targeting lysosomal membrane proteins. Mol Biol Cell 19:1942–1951.
- Bucci C, Lutcke A, Steele-Mortimer O, Olkkonen VM, Dupree P, Chiariello M, Bruni CB, Simons K, Zerial M. 1995. Co-operative regulation of endocytosis by three RAB5 isoforms. FEBS Letters 366:65–71.
- Burgert H-G, Thilo L. 1983. Internalization and recycling of plasma membrane glycoconjugates during pinocytosis in the macrophage cell line, P388D1: Kinetic evidence for compartmentation of internalized membranes. Exp Cell Res 144:127–142.
- Burnette WN. 1981. Western blotting: Electrophoretic transfer of proteins from SDS-PAGE to unmodified nitrocellulose and radiographic detection with antibody and radioiodinated protein A. Anal Biochem 112:195–203.
- Carlsson SR, Fukuda M. 1992. The lysosomal membrane glycoprotein Lamp-1 is transported to lysosomes by two alternative pathways. Arch Biochem Biophys 296:630–639.
- Chapuy B, Tikkanen R, Muhlhausen C, Wenzel D, von Figura K, Honing S. 2008. AP-1 and AP-3 mediate sorting of melanosomal and lysosomal membrane proteins into distinct post-Golgi trafficking pathways. Traffic 9:1157–1172.
- Chen JW, Murphy TL, Willingham MC, Pastan I, August JT. 1985a. Identification of two lysosomal membrane glycoproteins. J Cell Biol 101:85–95.
- Chen JW, Pan W, D'Souza MP, August JT. 1985b. Lysosome-associated membrane proteins: Characterisation of LAMP-1 of macrophage P388D1 and mouse embryo 3T3 cultured cells. Arch Biochem Biophys 239:574–586.
- Cook NR, Row PE, Davidson HW. 2004. Lysosome-associated membrane protein 1 (Lamp1) traffics directly from the TGN to early endosomes. Traffic 5:685–699.
- Courtoy PJ, Quintart J, Baudhuin P. 1984. Shift of equilibrium density induced by 3,3′-diaminobenzidine cytochemistry: A new procedure for the analysis and purification of peroxidase-containing organelles. J Cell Biol 98:870–876.
- Dell'Angelica EC, Ohno H, Ooi CE, Rabinovich E, Roche KW, Bonifacino JS. 1997. AP-3: An adaptor-like protein complex with ubiquitous expression. EMBO J 16:917–928.
- Dell'Angelica EC, Klumperman J, Stoorvogel W, Bonifacino JS. 1998. Association of the AP-3 adaptor complex with clathrin. Science 280:431–434.
- Dell'Angelica EC, Shotelersuk V, Aguilar RC, Gahl WA, Bonifacino JS. 1999. Altered trafficking of lysosomal proteins in Hermansky-Pudlak syndrome due to mutations in the β3A subunit of the AP-3 adaptor. Mol Cell 3:11–21.
- Dell'Angelica EC. 2009. AP-3-dependent trafficking and disease: The first decade. Curr Opin Cell Biol 21:552–559.
- D'Souza PM, August JT. 1986. A kinetic analysis of biosynthesis and localisation of a lysosome-associated membrane glycoprotein. Arch Biochem Biophys 249:522–532.
- Eskelinen E-L, Tanaka Y, Saftig P. 2003. At the acidic edge: Emerging functions for lysosomal membrane proteins. Trends Cell Biol 13:137–145.
- Fukuda M. 1991. Lysosomal membrane glycoproteins. J Biol Chem 266:21327–21330.
- Granger BL, Green SA, Gabel CA, Howe CL, Mellman I, Helenius A. 1990. Characterisation and cloning of lgp110, a lysosomal membrane glycoprotein from mouse and rat cells. J Biol Chem 265:12036–12043.
- Green SA, Zimmer K-P, Griffiths G, Mellman I. 1987. Kinetics of intracellular transport and sorting of lysosomal membrane and plasma membrane proteins. J Cell Biol 105:1227–1240.
- Groux-Degroote S, van Djik SM, Wolthoorn J, Neumann S, Theos AC, De Maziere AM, Klumperman J, van Meer G, Sprong H. 2008. Glycolipid-dependent sorting of melanosomal from lysosomal membrane proteins by lumenal determinants. Traffic 9:951–963.
- Harlow E, Lane D. 1988. Antibodies – a laboratory manual. Chs 6, 7, 8 and 11. New York: Cold Spring Harbor Laboratory.
- Harms E. 1989. Understanding Human Lysosomal Diseases: A Review. In: Lonsdale-Eccles JD, Lehanan JK, editors. Protein traffic in parasites and mammalian cells: Proceedings of a Workshop Held at the International Laboratory for Research on Animal Diseases, Nairobi, Kenya, 29 August to 1 September 1988. Accessed 4 December 2010 from the website: http://www.fao.org/wairdocs/ilri/x5550e/x5550e0f.htm.
- Harter C, Mellman I. 1992. Transport of the lysosomal membrane glycoprotein lgp120 (lgp-A) to lysosomes does not require appearance on the plasma membrane. J Cell Biol 117:311–325.
- Haylett T, Thilo L. 1986. Limited and selective transfer of plasma-membrane glycoproteins to membrane of secondary lysosomes. J Cell Biol 103:1249–1256.
- Honing S, Griffith J, Geuze HJ, Hunziker W. 1996. The tyrosine-based lysosomal targeting signal in lamp-1 mediates sorting into Golgi-derived clathrin-coated vesicles. EMBO J 15:5230-5239.
- Honing S, Hunziker W. 1995. Cytoplasmic determinants involved in direct lysosomal sorting, endocytosis and basolateral targeting of rat lgp 120 (lamp-1) in MDCK cells. J Cell Biol 128:321–332.
- Hunziker W, Geuze HJ. 1996. Intracellular trafficking of lysosomal membrane protein. BioEssays 18:379–389.
- Huynh KK, Eskelinen E-L, Scott CC, Malevanets A, Saftig P, Grinstein S. 2007. LAMP proteins are required for fusion of lysosomes with phagosomes. EMBO J 26:313–324.
- Janvier K, Bonifacino JS. 2005. Role of the endocytic machinery in the sorting of lysosome-associated membrane proteins. Mol Biol Cell 16:4231–4242.
- Kannan K, Divers SG, Lurie AA, Chervenak R, Fukuda M, Holcombe RF. 1995. Cell surface expression of lysosome-associated membrane protein-2 (lamp2) and CD63 as markers of in vivo platelet activation in malignancy. Eur J Haematol 55:145–151.
- Kannan K, Stewart RM, Bounds W, Carlsson SR, Fukuda M, Betzing KW, Holcombe RF. 1996. Lysosome-associated membrane protein h-LAMP1 (CD107a) and h-LAMP2 (CD107b) are activation-dependent cell surface glycoproteins in human peripheral blood mononuclear cells which mediate cell adhesion to vascular endothelium. Cell Immunol 171:10–19.
- Karlsson K, Carlsson SR. 1998. Sorting of lysosomal membrane glycoproteins lamp-1 and lamp-2 into vesicles distinct from mannose 6-phosphate receptor/γ-adaptin vesicles at the trans-Golgi network. J Biol Chem 273:18966–18973.
- Lang T, de Chastellier C. 1985. Fluid phase and mannose receptor-mediated uptake of horseradish peroxidase in mouse bone marrow-derived macrophages. Biochemical and ultrastructural study. Biol Cell 53:149–154.
- Le Borgne R, Alconada A, Bauer U, Hoflack B. 1998. The mammalian AP-3 adaptor-like complex mediates the intracellular transport of lysosomal membrane glycoproteins. J Biol Chem 273:29451–29461.
- Lewis V, Green SA, Marsh M, Vihko P, Helenius A, Mellman I. 1985. Glycoproteins of the lysosomal membrane. J Cell Biol 100:1839–1847.
- Lippincott-Schwartz J, Fambrough DM. 1986. Lysosomal membrane dynamics: Structure and interorganellar movement of a major lysosomal membrane glycoprotein. J Cell Biol 102:1593–1605.
- Lippincott-Schwartz J, Fambrough DM. 1987. Cycling of the integral membrane glycoprotein, LEP 100, between plasma membrane and lysosomes: Kinetic and morphological analysis. Cell 49:669–677.
- Lodish HF, Kong N, Snider M, Strous Ger JAM. 1983. Hepatoma secretory proteins migrate from rough endoplasmic reticulum to Golgi at characteristic rates. Nature 304:80–83.
- Luzio JP, Poupon V, Lindsay MR, Mullock BM, Piper RC, Pryor PR. 2003. Membrane dynamics and the biogenesis of lysosomes. Mol Membr Biol 20:141–154.
- Mane SM, Marzella L, Bainton DF, Holt VK, Ying C, Hildreth JEK, August JT. 1989. Purification and characterization of human lysosomal membrane glycoproteins. Arch Biochem Biophys 268:360–378.
- Marsh M, Schmid S, Kern H, Harms E, Male P. 1987. Rapid analytical and preparative isolation of functional endosomes by free flow electrophoresis. J Cell Biol 104:875–886.
- Mathews PM, Martinie JB, Fambrough DM. 1992. The pathway and targeting signal for delivery of the integral membrane glycoprotein LEP100 to lysosomes. J Cell Biol 118:1027–1040.
- Meril CR, Goldman D, Van Keuren ML. 1984. Gel protein stains: Silver stain. Methods Enzymol 104:441–447.
- Meyer C, Zizioli D, Lausmann S, Eskelinen E-L, Hamann J, Saftig P, von Figura K, Schu P. 2000. μ1A-adaptin-deficient mice: Lethality, loss of AP-1 binding and rerouting of mannose 6-phosphate receptors. EMBO J 19:2193–2203.
- Mullins C, Bonifacino JS. 2001. The molecular machinery for lysosome biogenesis. BioEssays 23:333–343.
- Mu F-T, Callaghan JM, Steele-Mortimer O, Stenmark H, Parton RG, Campbell PL, McCluskey J, Yeo J-P, Tock EPC, Toh B-H. 1995. EEA1, an early endosome-associated protein. EEA1 is a conserved α-helical peripheral membrane protein flanked by cysteine ‘fingers’ and contains a calmodulin-binding IQ motif. J Biol Chem 270:13503–13511.
- Nabi IR, Le Bivic A, Fambrough D, Rodriguez-Boulan E. 1991. An endogenous MDCK lysosomal membrane glycoprotein is targeted basolaterally before delivery to lysosomes. J Cell Biol 115:1573–1584.
- Obermuller S, Kiecke C, von Figura K, Honing S. 2002. The tyrosine motifs of Lamp 1 and LAP determine their direct and indirect targeting to lysosomes. J Cell Sci 115:185–194.
- Ohno H, Stewart J, Fournier M-C, Bosshart H, Rhee I, Miyatake S, Takashi S, Gallusser A, Kirchhausen T, Bonifacino JS. 1995. Interaction of tyrosine-based sorting signals with clathrin-associated proteins. Science 269:1872–1874.
- Peden AA, Oorschot V, Hesser BA, Austin CD, Scheller RH. 2004. Localization of the AP-3 adaptor complex defines a novel endosomal exit site for lysosomal membrane proteins. J Cell Biol 164:1065–1076.
- Rous BA, Reaves BJ, Ihrke G, Briggs JAG, Gray SR, Stephens DJ, Banting G, Luzio JP. 2002. Role of adaptor complex AP-3 in targeting wild-type and mutated CD63 to lysosomes. Mol Biol Cell 13:1071–1082.
- Simpson F, Bright NA, West MA, Newman LS, Darnell RB, Robinson MS. 1996. A novel adaptor-related protein complex. J Cell Biol 133:749–760.
- Simpson F, Peden AA, Christopoulou L, Robinson MS. 1997. Characterization of the adaptor-related protein complex, AP-3. J Cell Biol 137:835–845.
- Stahl P, Schlesinger PH, Sigardson E, Rodman JS, Lee YC. 1980. Receptor-mediated pinocytosis of mannose glycoconjugate macrophages:characterization and evidence for receptor recycling. Cell 19:207–215.
- Stoorvogel W. 1998. Analysis of the endocytic system by using horseradish peroxidase. Trends in Cell Biol 8:503–505.
- Theos AC, Tenza D, Martina JA, Hurbain I, Peden AA, Sviderskaya EV, Stewart A, Robinson MS, Bennett DC, Cutler DF, 2005. Functions of adaptor protein (AP)-3 and AP-1 in tyrosinase sorting from endosomes to melanosomes. Mol Biol Cell 16:5356–5372.
- Thilo L, Stroud E, Haylett T. 1995. Maturation of early endosomes and vesicular traffic to lysosomes in relation to membrane recycling. J Cell Sci 108:1791–1803.
- Urbe S, Tooze SA, Barr FA. 1997. Formation of secretory vesicles in the biosynthetic pathway. Biochim Biophys Acta 1358:6–22.