Abstract
In the last 15 years, 80% of all recombinant proteins reported in the literature were produced in the bacterium, Escherichia coli, or the yeast, Pichia pastoris. Nonetheless, developing effective general strategies for producing recombinant eukaryotic membrane proteins in these organisms remains a particular challenge. Using a validated screening procedure together with accurate yield quantitation, we therefore wished to establish the critical steps contributing to high yields of recombinant eukaryotic membrane protein in P. pastoris. Whilst the use of fusion partners to generate chimeric constructs and directed mutagenesis have previously been shown to be effective in bacterial hosts, we conclude that this approach is not transferable to yeast. Rather, codon optimization and the preparation and selection of high-yielding P. pastoris clones are effective strategies for maximizing yields of human aquaporins.
Introduction
Membrane proteins account for 30% of the proteins in a proteome. They are key molecules in a cell's communication and transport processes and consequently 60–70% of current drug targets are membrane proteins. However, membrane proteins are difficult to isolate, purify and crystallize (Lundstrom Citation2006, White Citation2009), which hampers structure-aided drug design: There are only 288 unique membrane protein structures (http://blanco.biomol.uci.edu/Membrane_Proteins_xtal.html) in the Protein Data Bank (http://www.rcsb.org/) of which 35% are eukaryotic; one quarter of these (9%) are of human origin. Obtaining sufficient functional material for subsequent structural analysis has been clearly identified as a bottleneck to progress in membrane protein structural biology (Bill et al. Citation2011).
In the last 15 years, 80% of all recombinant proteins reported in the literature were produced in the bacterium, Escherichia coli, or the yeast, Pichia pastoris (Sorensen Citation2010). P. pastoris has gained increasing attention for its ability to drive expression from its powerful and tightly-regulated AOX1 promoter as well as its ability to reach very high cell densities in bioreactors (Cereghino et al. Citation2002). Very high yields have been reported for soluble proteins expressed and purified from P. pastoris, e.g., 3–6 g/l of synthetic gelatine (Werten et al. Citation2001) and human growth factor (Fantoni et al. Citation2007). Moreover, P. pastoris is a common source for eukaryotic membrane protein structures, a potassium channel (Chen et al. Citation2010) and a gated plant aquaporin (Tornroth-Horsefield et al. Citation2006) being just two of eight examples to date. The ability to obtain yields as high as 115 mg highly-pure membrane protein per litre culture has been central to this success (Tornroth-Horsefield et al. Citation2006, Nyblom et al. Citation2007).
The P. pastoris system requires that the gene of interest is integrated into the host genome. Transformation of the relevant plasmid DNA can be achieved by two different methods: Chemical transformation using lithium chloride or electroporation. Electroporation is commonly recommended as the higher transformation frequency achieved by this method is suggested to result in a higher frequency of multiple insertions of the gene to be integrated (Invitrogen Citation2005). This higher gene dosage, resulting in so-called ‘jack-pot’ clones, is assumed to further result in a higher yield of the final protein product (Cregg et al. Citation2009). However, for integral membrane proteins this correlation has not been systematically examined, and indeed may not hold since an overloading of the transcription and translation machinery might occur. In this study, members of the aquaporin family that give different overproduction yields in P. pastoris were therefore used to assess the impact of the transformation method on the final protein yield, as quantified using our previously-validated method for accurate yield determination (Nyblom et al. Citation2007, Öberg et al. Citation2009).
A common strategy for the recombinant production of novel targets with an intrinsically low production yield is fusion with a stable and highly-produced peptide sequence. This strategy has been especially successful in E. coli. For soluble proteins, fusions to the maltose binding protein (MBP) as well as other fusion partners (e.g., the carboxyl terminal fragment of the Mycobacterium tuberculosis antigen) have significantly increased the overall yields of soluble recombinant proteins in both E. coli and yeast (Perez-Martin et al. Citation1997, Hennig and Schafer Citation1998, Wang et al. Citation2003). Recently, the protein Mistic was suggested to perform the same role for eukaryotic integral membrane proteins in bacteria (Roosild et al. Citation2005, CitationPetrovskaya et al. 2010). Further investigations of Mistic homologues revealed that the hydrophobic core and the length of the linker between the proteins are crucial for successful production of fusion proteins in E. coli (Roosild et al. Citation2006). The development of a similar approach for the production of eukaryotic membrane proteins in yeast was therefore evaluated in this study.
Codon usage in a given organism is commonly referred to as the Codon Adaptation Index (CAI) (Sharp and Li Citation1987). For situations when the gene and host are markedly different in CAI, codon adaptation is an appropriate strategy as exemplified by the successful production of the AQP from the malaria parasite Plasmodium falciparum in P. pastoris (Hedfalk et al. Citation2008). However, for genes and hosts that are very similar in CAI, gene optimization might not be the obvious way forward, as exemplified by the human aquaporins produced in P. pastoris. Notably, even though human aquaporins represent a fairly homogenous group of targets, their yield in P. pastoris has shown a surprisingly high variation (Öberg et al. Citation2009). Therefore, gene optimization in the context of differences in CAI, gene sequence repeats, codon usage, GC content, polyA sites, splice sites and RNA secondary structure (GeneArt) was tested for one of the poorest-producing human aquaporins.
Here, we combined a rapid, small-scale screening procedure with accurate yield quantitation to identify the critical steps contributing to increased eukaryotic membrane protein yield in P. pastoris. We show that the use of a fusion strategy is not transferable from E. coli to yeast. Instead the choice of transformation protocol, the clone selection step and codon optimization are critical in establishing a high-yielding experiment.
Methods
Cloning
All construct are based on the P. pastoris vector pPICZB (Invitrogen) for intracellular protein production. Primers used for specific constructs are listed in Supplementary Table S1, available online. For all PCR reactions and ligations, Phusion DNA polymerase (Finnzymes) and Quick T4 DNA Ligase (New England Biolabs) were used, respectively. For all constructs, a carboxy-terminal hexa-histidine tag directly followed by a stop codon, was included. A codon-optimized gene of Mistic for production in P. pastoris was ordered from GeneArt. The gene was amplified by PCR and cloned into the P. pastoris vector pPICZB creating a 16 amino acid linker, containing a spacer region and a TEV protease cleavage site (see Supplementary Figure S1, available online), between the protein and the XbaI site. This construct, Opt-mistic/pPICZB, was used as the vector for the M1 and M2 construct (see ). Genes encoding both full-length haqp1 and haqp8 were previously cloned into pPICZB (Öberg et al. Citation2009) and were also amplified and inserted downstream of the linker in Opt-mistic/pPICZB. A codon-optimized gene of haqp4 for production in P. pastoris was ordered from GenScript. The gene was flanked by restriction sites for SfuI and XbaI which were used to sub-clone the gene into the P. pastoris vector pPICZB, creating the construct Opt-haqp4/pPICZB. hAQP4* (a double mutant of haqp4 containing the mutations M48N L50K) and haqp4*-N185D (a triple mutant) were generated previously (Öberg et al. Citation2009). For imaging, a pPICZB vector containing Strongly Enhanced Green Fluorescence Protein (sgfp2) (Kremers et al. Citation2007) was made by amplification of sgfp2. The resulting vector, sgfp2/pPICZB, was used in creation of haqp1-sgfp2 and haqp8-sgfp2 where the haqp1 and the haqp8 gene, respectively, were cloned into sgfp2/pPICZB upstream of the sgfp2 gene creating a 12 amino acid long linker with a spacer region (see Supplementary Figure S1, available online). For F1 (see ) two primers were annealed to each other creating a double-stranded DNA fragment with two cleavage sites for restriction enzymes. This fragment was inserted into a new vector, haqp8M/pPICZB (described below), upstream of the haqp8 gene with restriction enzymes creating a linker of 16 amino acids, containing a spacer region and a TEV protease cleavage site (see Supplementary Figure S1, available online), between the two genes. The haqp8M /pPICZB vector contains haqp8 in pPICZB with the first methionine removed. F2 was made in a single PCR reaction where the forward primer contained a 17 amino acid long linker with a spacer region and a TEV protease cleavage site (see Supplementary Figure S1, available online). The PCR product was inserted into pPICZB-haqp1-Myc-His6 (Nyblom et al. Citation2007) downstream the haqp1 gene. For C1 (see ) the sequence encoding the amino-terminus of hAQP1 was included in the forward primer, whereas for C2-C4 (see ) two different gene fragments were amplified in separate reactions and ligated in a blunt end ligation. The resulting DNA fragments were used as a template for a new PCR reaction and the resulting chimeric fragments were cloned into the P. pastoris vector pPICZB. S1 (see ) was made in the same way as C1 whereas for S2 (see ) two different reactions were needed to create two PCR fragments with complementary parts. A third PCR reaction with the S2SoPIP2;1 -260 forward primer and the S2hAQP1 228- reverse primer created the final fragment which was subsequently cloned into the P. pastoris vector pPICZB. The gene encoding full-length sopip2;1 was previously cloned into pPICZB (Tornroth-Horsefield et al. Citation2006). All constructs were verified by sequencing (Eurofins MWG Operon).
High zeocin concentration screen
A total of 20 transformants were screened for growth on YPD plates containing a high concentration of zeocin (2000 μg/ml) and analyzed after 2–7 days. The protein production yields of selected transformants were quantified using a small-scale screening method, which has been described previously (Fantoni et al. Citation2007, Öberg et al. Citation2009). In brief, cells corresponding to 0.5 OD600 units were resuspended in sample buffer (50 mM Tris-HCl pH 6.8, 2% SDS, 0.1% bromophenol blue, 10% glycerol, 20 mM DTT), incubated at 95°C for 10 min and loaded on a gel. To optimize the screen for growth on high zeocin YPD plates, 40 colonies were compared in three different variants of the method. In the first screen, a pipette tip was used to streak cells on the high zeocin plate, having the intrinsic disadvantage that slightly different amounts of cells are streaked out, which in turn affects accurate comparison. For a more reliable comparison, the screen was improved by resuspending the cells in YPD medium and adjusting OD600 to 20 mOD units in each drop. To improve the screen even further, the volume in each drop was adjusted in addition to the amount of cells. In this case 10 mOD of cells were plated in each drop. The plates where incubated at 30°C, and observed for seven days.
Protein production in P. pastoris
All constructs were linearized using the PmeI restriction endonuclease (Fermentas) before transformation of P. pastoris wild type strain X-33. Constructs S1 and S2 () were transformed using the lithium chloride method, since this was the original transformation method for the reference protein SoPIP2;1: P. pastoris cells were grown to an OD600 of 0.9, washed stepwise with water and then 100 mM LiCl and resuspended in 100 mM LiCl. Cells, 50% mM polyethylene glycol, salmon sperm DNA (2 mg/ml) and 5–10 μg plasmid DNA were mixed in an eppendorf tube, incubated at 30°C for 1 h and then subjected to a heat shock at 42°C for 25 min. Finally, the cells were incubated for up to 4 h at 30°C and spread on zeocin-containing YPD plates. For comparison, the lithium chloride method was also used for selected constructs (hAQP1, hAQP4 and hAQP8) in . Based on these results, all other constructs were transformed by electroporation (Invitrogen). In brief, P. pastoris cells were grown to an OD600 of 1.3, washed with ice-cold distilled water and resuspended in cold 1 M sorbitol. Cells and DNA were mixed in an electroporation cuvette and subjected to a pulse of 2.2 kV, directly followed by addition of 1 ml 1 M sorbitol. Finally, the cells are incubated for 1 h at 30°C and spread on zeocin-containing YPDS plates (YPD 1 M sorbitol). Protein production, quantitation of total production yields and densitometry measurements were performed as described earlier (Öberg et al. Citation2009). An anti-His6 monoclonal antibody (Clonetech) was used as primary antibody and an anti-mouse IgG-HRP conjugate antibody (Promega) as secondary.
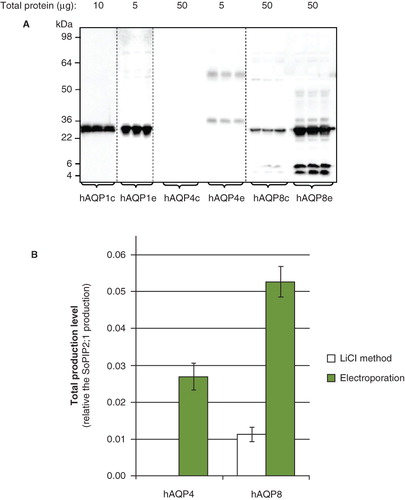
Figure 1. Total yield is dependent on the transformation method. (A) Immunoblot showing whole cell lysate for hAQP1, hAQP4 and hAQP8, respectively, from triplicate P. pastoris cultures. Chemical transformation is indicated by c and electroporation by e, respectively. Samples from different immunoblots are separated with a dashed line. (B) Bar graph showing the quantified production yield relative to the reference protein SoPIP2;1. The left bar indicates the total production yield of clones transformed using the lithium chloride method whereas the right bar shows clones transformed by electroporation.
Determination of yield profile
To measure the membrane yield profile, line intensity plots were generated of confocal images of individual live cells. A minimum of three line profiles distributed at regular intervals covering the entire cell were measured in at least three independent experiments. The fluorescence intensity over this distance was also measured. The difference between the mean of the two outermost fluorescence peaks and the mean of the fluorescence between these two peaks was divided by the maximum fluorescence along the line scan to calculate the percentage of fluorescence at the outermost membrane. This was termed the relative expression (RE) (Viard et al. Citation2004, Conner et al. Citation2010). An RE of 100% indicated that all fluorescence was detected in the outer circumference of the cell. An RE of 0% indicated that all fluorescence was detected in the cytoplasm and/or within invaginated membranes with no outer circumference fluorescence.
Purification of optimized hAQP4
For high level production, P. pastoris transformed with hAQP4*-N185D was grown in a 3-l bioreactor as previously described (Nyblom et al. Citation2007). Membranes containing the hAQP4*-N185D produced from pPICZB were washed with urea and NaOH (Karlsson et al. Citation2003, Nyblom et al. Citation2007). Washed membranes (3 mg) were solubilized in solubilization buffer (50 ml; 20 mM Tris-HCl pH 8.0, 20 mM NaCl, 10% glycerol, 0.5% n-octyl-β-D-glucopyranoside (β-OG, Anatrace), protease inhibitor cocktail [Complete EDTA-free, Roche Diagnostics]). The mixture was incubated at 4°C for 3 h with shaking. Solubilized material was collected by centrifugation at 160,000 g for 30 min at 4°C. The 160,000 g supernatant containing solubilized hAQP4*-N185D was incubated for 3 h at 4°C with Ni-NTA agarose. The resin was washed three times in Ni-wash buffer (20 mM Tris-HCl pH 8.0, 300 mM NaCl, 10% glycerol, 0.5% β-OG, 35 mM imidazole) and eluted three times in Ni-elution buffer (20 mM Tris-HCl pH 8.0, 300 mM NaCl, 10% glycerol, 0.5% β-OG, 750 mM imidazole) protease inhibitor cocktail, 1% β-OG). For analysis, samples were mixed 1:3 with 4 × sample buffer (187.5 mM Tris-HCl pH 6.8, 6% SDS, 0.03% bromophenol blue, 30% glycerol, 20 mM DTT) and analyzed by SDS-PAGE (12%).
Protein activity measurement using stopped-flow light-scattering
E. coli polar lipid extract (Avanti Polar Lipids Inc.) consisting of 67% PE (phosphatidylethanolamine), 23.2% PG (phopsphatidylglycerol) and 9.8% CA (cardiolipin) was used for liposome formation. The lipids were dissolved in reconstitution buffer (50 mM NaCl, 50 mM Tris-HCl pH 8.0) to a final concentration of 4 mg/ml. n-Octyl-β-D-glucopyranoside (Affymetrix) was added (final concentration 2%, w/v) and hAQP4*-N185D to a LPR (lipid-protein ratio) = 50 giving a total volume of 1 ml. After a few minutes incubation, polystyrene divinylbenzene beads (Bio-Beads SM2 Adsorbent, Bio-Rad Laboratories) were added to absorb the detergent. The samples were left on a rolling table overnight and pelleted (126,800 g, 1 h, 10°C). The liposome pellet was resuspended to a final concentration of 4 mg/ml lipid in reconstitution buffer before measurements in the stopped-flow spectrophotometer (μSFM-20, BioLogic Science Instruments) at 90° to the excitation beam.
Results
Electroporation is superior to lithium chloride transformation for generating high-yielding P. pastoris clones
Chemical transformation and electroporation were evaluated for the generation of high-yielding P. pastoris clones. Members of the aquaporin family, for which we had previously established accurate production yields in P. pastoris were selected as targets in order to determine whether their yields could be further improved in the clone generation step. hAQP1, hAQP8 and hAQP4 had previously been shown to be produced respectively in high-, moderate- and no-yield following chemical transformation (Öberg et al. Citation2009). Total production yields were therefore quantified after either chemical transformation or electroporation. Using our established method for reliable quantitation of membrane protein production yields, we estimated the relative yields in total cell extracts using immunoblots of triplicate cultures compared with a reference target and an internal standard (Öberg et al. Citation2009). The resulting yield of each target from whole cell lysates was quantified as shown in . hAQP1 was seen in its monomeric form, hAQP4 was distributed as both monomers and dimers and hAQP8 was monomeric with some degradation. For hAQP1, the production yield was 40% that of our highest yielding clone (SoPiP2:1 (Tornroth-Horsefield et al. Citation2006)), irrespective of the transformation method used (data not shown). For hAQP8, which is produced to moderate yields in P. pastoris after chemical transformation, the production was increased by a factor of five when using electroporation (). The yield of hAQP4 was below the detection limit after chemical transformation, while electroporation resulted in yields that were appropriate for scale up and purification trials ().
Screening at high zeocin concentrations is an efficient way to identify P. pastoris clones with high membrane protein yield
In order to increase the efficiency of screening for positive transformants, we examined the relationship between the final recombinant protein yield in whole cell lysates and the growth of the recombinant host at high zeocin concentrations (2,000 μg/ml; ). For the aquaporins under study, a clear correlation between the ability to grow on high concentrations of antibiotic and membrane protein production yields emerged. The largest colonies also showed the highest protein production yield, consistent with the observation that multiple insertion events can lead to high protein yields. To make this qualitative assessment more quantitative, an equal density of cells was plated () and compared to plates in which the volume was additionally adjusted to be equivalent for all samples (). In the simplest variant of the screening method (), differences were difficult to identify on account of differences in cell density. A more accurate variant therefore compared an equal density of cells (). However, the most reliable screen was achieved when both the cell density and volume were adjusted (). Based on this screen, the crude extract from the two best growing colonies, 11 and 21 (; ), were compared on an immunoblot confirming that production was high, with colony 21 giving a better yield than colony 11 (data not shown).
Figure 2. A high-zeocin growth screen can identify high-yielding clones. (A) Immunoblot showing the total production yield following a small-scale screen for the production of the hAQP1-hAQP8 fusion (F2) in P. pastoris. The corresponding growth on high zeocin is shown for each transformant just below the blot. (B) A screen where re-streaked cells are spread to find colonies which can survive high concentrations of zeocin. The left plate has been incubated for two days and the right plate for seven days. (C) A screen where equal amounts of cells resuspended in liquid medium are plated but in a different total volume. The left plate has been incubated for two days and the right plate for three days. (D) A screen where both the amount of cells and the volume of the drop have been adjusted. The left plate has been incubated for two days and the right plate for three days. This Figure is reproduced in colour in Molecular Membrane Biology online.
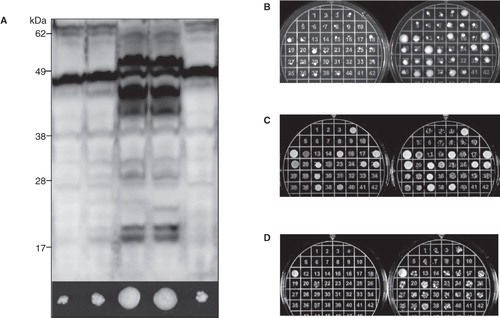
Table I. High zeocin screen on Pichia pastoris transformants The largest, densest colonies from a total of 40 (Fig. 2) are listed after different incubation times at 30°C.
Recombinant hAQP1 and hAQP8 are localized to the P. pastoris membrane
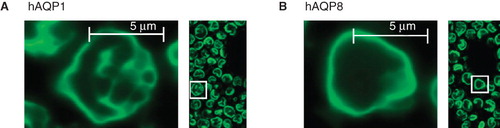
Confocal imaging of recombinant P. pastoris cells showed membrane localization of both hAQP1-GFP and hAQP8-GFP (). This supports the production of correctly-folded, recombinant human aquaporins in this host. Bleaching of hAQP8-GFP was more rapid than that of hAQP1-GFP suggesting that hAQP1-GFP is produced at higher yields than hAQP8-GFP. In the absence of GFP, AQP1 is produced at higher yields than hAQP8, as determined by immunoblot (). The confocal data also indicate that the yield profiles for the two aquaporins are different at 48 h post-induction, with an RE of 79 ± 2% and 27 ± 2% for hAQP8-GFP and hAQP1-GFP, respectively.
Figure 3. Membrane localization of hAQP1 and hAQP8 in P. pastoris. Yield profiles for GFP fusion proteins of hAQP1 (A) and hAQP8 (B) in P. pastoris. Cells shown are from a culture at 48 h post-induction.
Mistic-hAQP fusions are stable in P. pastoris but do not increase yield
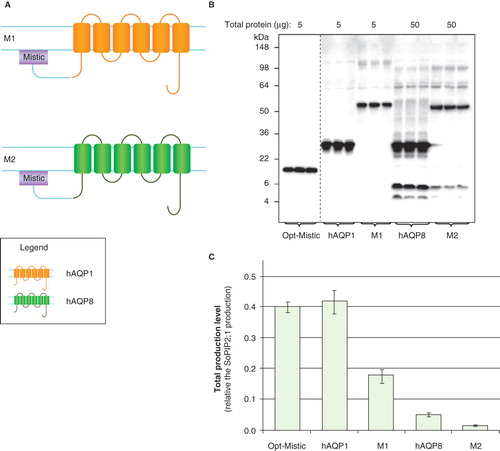
We examined whether production of our low-yielding AQP targets could be improved by fusing them to Mistic, a protein which has previously been shown to be stably produced at high yields in bacterial membranes. Chimeras were made in various combinations (). For use in P. pastoris, Mistic was specifically codon optimized (Opt-Mistic) and its production was found to be remarkably stable () with yields in the same range as the highest hAQP1 yield (). The fusion of Opt-Mistic to hAQP1 (M1) resulted in a stable product of the expected molecular weight where the monomeric band was dominant on the immunoblot but a dimeric form was also observed (). For Opt-Mistic-hAQP8 (M2) the majority of the product corresponded to the expected molecular weight, but some degradation, as seen for hAQP8 alone, was also observed (). However, for both M1 and M2, the fusion to Mistic resulted in lower yields compared to non-fused targets (). These data suggest that the concept of increasing eukaryotic membrane protein yields using Mistic partners cannot be extrapolated from E. coli to P. pastoris.
Figure 4. Mistic is not a good fusion partner in P. pastoris. (A) Fusion constructs of Opt-Mistic and human aquaporin homologues; M1 and M2. hAQP1 (yellow), hAQP8 (green) and the linker (light blue) are indicated. (B) Immunoblots showing the total production in whole P. pastoris cell extracts of Mistic fusions; M1 and M2; as well as individual fusion partners. Samples representing the total yield in P. pastoris are loaded in triplicates for each construct. The amount of total protein loaded for each construct is stated above each immunoblot. Samples from different immunoblots are separated with a dashed line. (C) Bar chart showing the total yields of Mistic fusions and individual fusion partners. All yields are relative to SoPIP2;1 production, for which the yield is set to one. Each bar represents the average from triplicate cultures. Error bars show the standard deviation (n = 3). This Figure is reproduced in colour in Molecular Membrane Biology online.
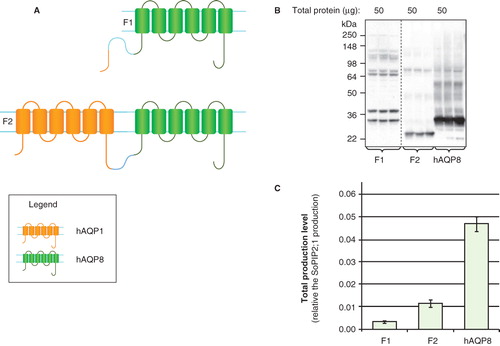
The carboxy-terminal hydrophilic extensions of AQP1 may direct high yields of human aquaporins
In order to explore further the use of a fusion strategy, hAQP1 was identified as a highly-homologous partner for low-yielding hAQP8. Full length hAQP8 was therefore fused either to the amino terminus of hAQP1 (F1: ), or to the whole protein (F2; ). As seen in , full-length F1 was produced as well as a smaller protein product of the same size as hAQP8 itself (27 kDa). For F2, the band on the immunoblot was smaller than any of the individual fusion partners consistent with degradation and instability of the product (). Overall the total yields were not improved (). For F1 and F2, a linker of 17 amino acids was included between the two proteins, but when this was removed the same outcome was obtained (data not shown). When hAQP1 TMD1, TMD1–2 or TMD1–3, respectively, were also fused to the amino terminus of hAQP8 there was no yield improvement (data not shown).
Figure 5. Production of hAQP1 fusions in P. pastoris. (A) Fusion constructs of human aquaporin homologues; F1 and F2. hAQP1 (yellow), hAQP8 (green) and the linker (light blue) are indicated. (B) Immunoblots showing the total yield in whole P. pastoris cell extracts of fusion constructs; F1 and F2. Samples representing the total production yield in P. pastoris are loaded in triplicates for each construct. The amount of total protein loaded for each construct is stated above each immunoblot. Samples from different immunoblots are separated with a dashed line. (C) Bar chart showing the total production yield of fusion constructs; F1 and F2, compared with hAQP8. All yields are relative the SoPIP2;1 production, for which the yield is set to one. The bars are the average of triplicate cultures; error bars show the standard deviation (n = 3). This Figure is reproduced in colour in Molecular Membrane Biology online.
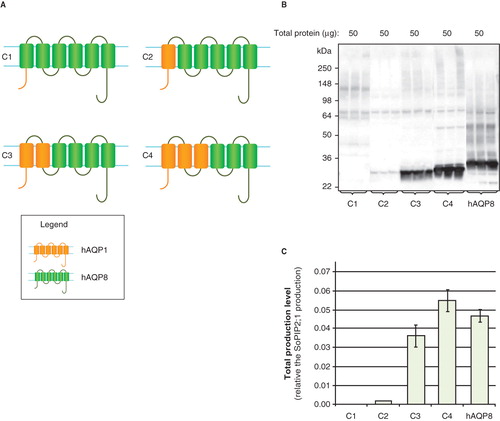
To more specifically identify regions of AQP1 that might direct high yields, four additional chimeric constructs were made (C1–C4; ). These constructs were comprised of hAQP8 in which the amino-terminus, TMD1, TMD1–2 or TMD1–3 were substituted in turn for the corresponding sequences of hAQP1. When the amino-terminal sequences of hAQP8 were substituted with the corresponding hAQP1 sequences, yields were very low (). In contrast, exchanging the first two or three helices did not substantially affect the yield (). This pointed to the importance of the carboxy-terminal half of hAQP1 being a potential determinant of successful membrane protein overproduction.
Figure 6. Production of hAQP chimeras in P. pastoris. (A) Chimeric constructs of aquaporin homologues; C1–C4. hAQP1 (yellow) and hAQP8 (green) are indicated. (B) Immunoblots showing the total production in whole P. pastoris cell extracts of chimeric constructs; C1–C4. Samples representing the total production yield in P. pastoris are loaded in triplicates for each construct. The amount of total protein loaded for each construct is stated above each immunoblot. All samples shown are from the same immunoblot, but the lanes have been re-ordered for clarity. (C) Bar chart showing the total production yield of chimeric constructs; C1–C4, compared with hAQP8. All yields are relative the SoPIP2;1 production, for which the production is set to one. The bars represent the average of triplicate cultures; error bars show the standard deviation (n = 3). This Figure is reproduced in colour in Molecular Membrane Biology online.
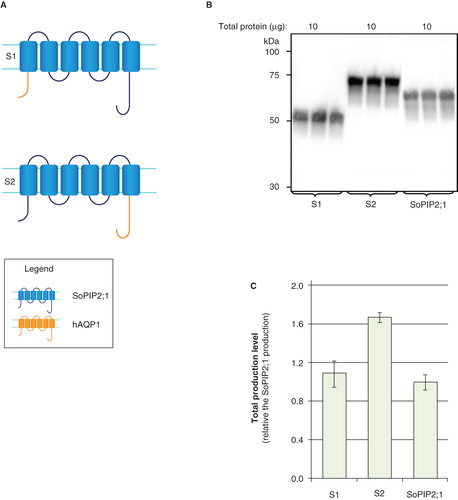
In order to investigate the role of the termini with regard to production yields, the hydrophilic domains of two highly-produced targets, hAQP1 and SoPIP2;1, were exchanged. The amino- and carboxy-termini of SoPIP2;1 were replaced with the corresponding sequences of hAQP1, to give S1 and S2, respectively (). For this approach, the hAQP1 construct giving the highest yield in P. pastoris, i.e., hAQP1-Myc-His6 with a yield of 1.5 relative to SoPIP2;1 production (Öberg et al. Citation2009), was used. Notably, S1 and S2 were stably produced, no degradation was observed () and the yield of SoPIP2;1 was not affected by the exchange of the amino-terminus. In contrast, exchange of the carboxy-terminus led to an even higher yield than for SoPIP2;1 itself () supporting the view that sequences within the carboxy-terminus of hAQP1 can direct high yields of human aquaporins.
Figure 7. Production of hAQP domain swaps in P. pastoris. (A) Domain swaps of aquaporin homologues; S1 and S2. SoPIP2;1 (blue) and hAQP1 (yellow) are indicated. (B) Immunoblots showing the total production in whole P. pastoris cell extracts of domain swaps; S1 and S2. Samples representing the total production yield in P. pastoris are loaded in triplicate for each construct. The amount of total protein loaded for each construct is stated above each immunoblot. (C) Bar chart showing the total production yield of domain swaps; S1 and S2. All yields are relative the SoPIP2;1 production, for which the production is set to one. The bars represent average from triplicate cultures; error bars show the standard deviation. This Figure is reproduced in colour in Molecular Membrane Biology online.
Codon optimization results in substantially higher production yields for hAQP4
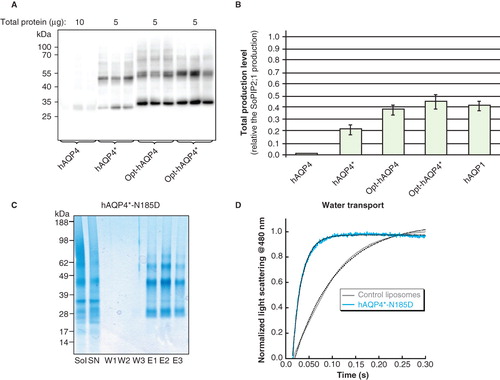
As part of this study, the Mistic protein was codon optimized for production in P. pastoris and high yields were observed (). On account of its low yields (Öberg et al. Citation2009 and ), hAQP4 was therefore subjected to codon optimization, giving Opt-hAQP4. Opt-hAQP4 showed a substantial increase in yield, comparable with that of hAQP1 (), clearly supporting the use of codon optimization in order to increase initial production yields. As seen in , Opt-hAQP4 was stably produced in P. pastoris and bands corresponding to both the monomeric and oligomeric forms were observed on the immunoblot. In a previous study, two mutations directing the folding pathway were introduced into hAQP4 (M48N, L50K; Öberg et al. Citation2009) resulting in hAQP4* being produced at higher yields than hAQP4. When hAQP4* was codon optimized, giving Opt-hAQP4*, stable products at slightly higher yields than Opt-hAQP4 were achieved in P. pastoris (). In both cases, there was sufficient material for further functional characterization and crystallization attempts.
Figure 8. Production of gene optimized hAQP4 in P. pastoris. (A) Immunoblot showing the production of hAQP4, hAQP4*, Opt-hAQP4 and Opt-hAQP4*, respectively, in total cell extracts. Samples representing the total production yield are loaded in triplicates for each construct produced in P. pastoris. The amount of protein loaded for each target is indicated on top of the immunoblot. All samples shown are from the same immunoblot, but the lanes have been re-ordered for clarity. (B) Bar chart showing the yield of hAQP4*, Opt-hAQP4 and Opt-hAQP4*, respectively, compared with hAQP4 and related to the SoPIP2;1 yield, which is set to one. The bars represent the average of triplicate cultures; error bars show the standard deviation (n = 3). (C) Solubilization and purification of hAQP4*-N185D. A SDS-PAGE gel showing solubilized membrane (Sol), solubilized supernatant (SN), three washes (W1–3) and three elutions (E1–3) from the Ni-matrix. All bands in the eluted fraction were verified to be hAQP4 by mass spectrometry. (D) Activity measurements of hAQP4*-N185D reconstituted into liposomes and assayed using stopped flow and light scattering following a hyper-osmotic shift. This Figure is reproduced in colour in Molecular Membrane Biology online.
hAQP4*-N185D oligomers can be purified for further study
For an optimization strategy to be successful, any mutations introduced to increase the production yield must not interfere with the folding and activity of the target. We therefore chose to purify a hAQP4 construct optimized by three mutations to afford yields substantially higher than the wild-type protein (Öberg et al. Citation2009). hAQP4*-N185D, when solubilized in β-OG, could be isolated in a highly-pure state after one purification step using a Ni-matrix. In addition to the monomeric form, oligomeric bands were observed by SDS-PAGE () indicating proper folding and tetramerization.
Wild-type-like water transport is observed for hAQP4*-N185D
To confirm that hAQP4*-N185D was fully functional after purification, the protein was reconstituted into proteoliposomes and the P f value for its water transport was measured. As seen in , the increase in scattered light was substantially higher for proteoliposomes into which hAQP4*-N185D had been reconstituted compared with control liposomes containing no protein. P f values for hAQP4*-N185D and the control were 7.5 ± 0.03 and 2.4 ± 0.01, respectively. The water transport for hAQP4*-N185D is in the same range as that for hAQP1 produced in P. pastoris (9.1 +/− 0.4; Nyblom et al. Citation2007). From this comparison it is clear that the mutations introduced into hAQP4*-N185D to increase its yield do not have a major impact on the activity of the protein.
Discussion
In order to optimize any protein production experiment, several parameters must be considered. Here we evaluated the role of clone selection, fusion partners and codon optimization in obtaining high yields of members of the aquaporin family.
Clone selection
Chemical transformation using lithium chloride has previously been used routinely in generating P. pastoris strains (Öberg et al. Citation2009) despite the fact that electroporation is likely to result in a higher frequency of multi-copy integrants (Invitrogen Citation2005). This in turn should result in higher production yields. While several studies have suggested that slowing the rate of translation may increase the functional yield of recombinant membrane proteins (Tate Citation2001), including members of the aquaporin family (Bonander et al. Citation2005), a link has not been established between gene dosage and yield in these reports. Consequently, we investigated the impact of the transformation method on the final yield. For the low-yielding targets, hAQP4 and hAQP8, a significant yield improvement was observed following electroporation () suggesting that low yielding targets benefit from increasing gene dosage. This was supported by the observation that the highest yielding clones also survived growth on high zeocin concentrations (), as multi-copy insertions contain repeated insertions of the gene of interest together with a zeocin resistance gene. The frequency of multi-copy insertion is predicted to be 1–10% and hence it would be necessary to screen up to 1,000 transformants in order to identify them. We noted that screening on 2,000 μg/ml zeocin is a rapid and effective way to identify these high-yielding clones.
Notably, confocal microscopy imaging of hAQP1-GFP and hAQP8-GFP showed that both high- and moderate-yielding targets were localized to the yeast membrane, supporting proper processing of recombinant integral membrane proteins in the host cell. Moreover, the total amount estimated by imaging is in good agreement with the total production yields quantified by immunoblot (). Interestingly, the expression profile of the two proteins in P. pastoris cells differed (). This observation could be consistent with saturation and overload resulting from a membrane protein production level as high as the one observed for hAQP1 in the P. pastoris plasma membrane (Nyblom et al. Citation2007, Öberg et al. Citation2009). Further support for the correct membrane localization of highly-expressed recombinant proteins was seen for hAQP4*-N185D (), where the pure material is sufficient for subsequent characterization of its structure and function.
Fusion partners
In this study a set of constructs was designed with different combinations of fusion partners, chimeras and domain swaps, analogous to previous approaches predominantly in E. coli (Perez-Martin et al. Citation1997, Hennig and Schafer Citation1998, Wang et al. Citation2003, Roosild et al. Citation2005, CitationPetrovskaya et al. 2010). In a first approach, Mistic (Roosild et al. Citation2005) was codon optimized for production in P. pastoris and used as a fusion partner for hAQP1 and hAQP8, which are a high- and a low yielding target, respectively. Even though codon-optimized Mistic itself was produced at high yields in P. pastoris, it did not direct high yields of its fusion partners (). A possible explanation for this is that fusion of the two proteins results in a chimera that cannot be easily processed by the yeast translocon machinery, compared with its prokaryotic counterpart. More likely, however, is that Mistic, which is a prokaryotic protein, does not behave in the same way when produced in a yeast cell and hence does not bring the same positive influence in a eukaryotic context. In contrast, a eukaryotic membrane protein that has already been shown to be stably produced in high yields in P. pastoris should be a suitable fusion partner. Consequently, hAQP1 (Nyblom et al. Citation2007, Öberg et al. Citation2009) was selected to drive the production of a homologous, but less well produced protein, hAQP8. Fusion with either the full-length protein, or parts of its amino-terminus was not a successful strategy resulting in unstable products and low yields (). Interestingly, different folding routes are observed for aquaporins when their transmembrane domains are inserted in various orders which may explain this observation (Foster et al. Citation2000). In relation to this, we noted that shorter amino-terminal exchanges resulted in more unstable proteins compared to the situation where half the protein was exchanged (). This coincides well with the fact that aquaporins are comprised of an inverted repeat of three helices (Reizer et al. Citation1993), and hence chimeras combining two homologous repeats are more stable.
To follow up the observation that shorter swaps were less tolerated when fused to hAQP8, shorter domains were swapped between two proteins both known to be stably produced to high yields in yeast, namely hAQP1 and SoPIP2;1 (Karlsson et al. Citation2003, Nyblom et al. Citation2007). Notably, both the amino- and the carboxy-terminus of SoPIP2;1 could be replaced with the corresponding terminus of hAQP1 without a decrease in production yield (). The substitution of the carboxy terminus resulted in an even higher yield compared with native SoPIP2;1. This emphasizes the importance of hydrophilic extensions for high production yields. In addition, the ability to generate stable domain swapped mutants between hAQP1 and SoPIP2;1 suggests that these two proteins share the same folding pathway, while hAQP8 has another folding route giving rise to unstable hAQP1-hAQP8 chimeras (). Our previous work on improving the production yield of hAQP4 by a redirection of its folding pathway (Öberg et al. Citation2009) further supports this explanation.
Codon optimization
Codon bias is an intrinsic problem in heterologous protein production and needs to be taken into account in the experimental design (Gustafsson et al. Citation2004). Codon optimization has been used with great success previously for Plasmodium falciparum AQP produced in P. pastoris (Hedfalk et al. Citation2008). The Codon Adaptation Index (CAI) for the low-yielding human aquaporin target, hAQP4, is very similar in humans and in yeast; 0.760 and 0.707, respectively (http://genomes.urv.es/CAIcal). This might suggest that low yields of hAQP4 in P. pastoris are not explained by CAI. However, despite this similarity, the preferred codons differ between the two species in 14 cases out of 20. Moreover, when comparing the codon usage in the wild-type gene and the codon-optimized variant, we find that the optimized gene does not contain the range of triplets seen in the wild-type gene (see Supplementary Table S2, available online). In addition, the optimized gene benefits from exclusion of gene sequence repeats as well as a balanced GC content.
While codon optimization improves the translation process by ensuring there is no depletion of specific tRNAs, other strategies must be applied to improve the translocation of recombinant membrane proteins. Indeed, translocation has been highlighted as the main bottleneck to successful membrane protein production, especially for heterologous production (Tate Citation2001). Specific mutations affecting the folding pathway and tetramer stability of hAQPs have also been shown to have a very positive influence on the recombinant yield (Öberg et al. Citation2009). However, for such protein-dependent effects, specific knowledge of the selected target is a critical pre-requisite. Overall, a combined approach that improves both translation and translocation processes, appears promising (Opt-hAQP4*; ).
Conclusion
Substantial improvements in membrane protein yields can be achieved by selecting high-yielding transformants. This is achieved by using electroporation in combination with screening at high zeocin concentrations. The use of fusion partners appears to have variable effects, whilst the careful application of gene optimization is a route worth pursuing in order to optimize productivity.
Supplementary Figure S1
Download MS Word (200.5 KB)Acknowledgements
We thank Anna Polyakova for assistance in making the Opt-hAQP4 clone and the Carnegie Foundation.
Declaration of interest: This work was supported by contracts LSHG-CT-2004-504601 (E-MeP), LSHG-CT-2006-037793 (OptiCryst), HEALTH-F4-2007-201924 (EDICT) and QLG2-CT-2002-00988 (SPINE). The authors report no conflicts of interest. The authors alone are responsible for the content and writing of the paper.
References
- Bill RM, Henderson PJ, Iwata S, Kunji ER, Michel H, Neutze R, Newstead S, Poolman B, Tate CG, Vogel H. 2011. Overcoming barriers to membrane protein structure determination. Nature Biotechnol 29:335–340.
- Bonander N, Hedfalk K, Larsson C, Mostad P, Chang C, Gustafsson L, Bill RM. 2005. Design of improved membrane protein production experiments: Quantitation of the host response. Protein Sci 14:1729–1740.
- Cereghino GP, Cereghino JL, Ilgen C, Cregg JM. 2002. Production of recombinant proteins in fermenter cultures of the yeast Pichia pastoris. Curr Opin Biotechnol 13:329–332.
- Chen X, Wang Q, Ni F, Ma J. Structure of the full-length Shaker potassium channel Kv1.2 by normal-mode-based X-ray crystallographic refinement. Proc Natl Acad Sci USA 2010;107:11352–11357.
- Conner MT, Conner AC, Brown JE, Bill RM. 2010. Membrane trafficking of aquaporin 1 is mediated by protein kinase C via microtubules and regulated by tonicity. Biochemistry 49:821–823.
- Cregg JM, Tolstorukov I, Kusari A, Sunga J, Madden K, Chappell T. 2009. Expression in the yeast Pichia pastoris. Methods Enzymol 463:169–189.
- Fantoni A, Bill RM, Gustafsson L, Hedfalk K. 2007. Improved yields of full-length functional human FGF1 can be achieved using the methylotrophic yeast Pichia pastoris. Protein Expr Purif 52:31–39.
- Foster W, Helm A, Turnbull I, Gulati H, Yang B, Verkman AS, Skach WR. 2000. Identification of sequence determinants that direct different intracellular folding pathways for aquaporin-1 and aquaporin-4. J Biol Chem 275:34157–34165.
- Gene Art. Method and device for optimising a nucleotide sequence for the purpose of expression of a protein. http://www.geneart.com/.
- Gustafsson C, Govindarajan S, Minshull J. 2004. Codon bias and heterologous protein expression. Trends Biotechnol 22:346–353.
- Hedfalk K, Pettersson N, Öberg F, Hohmann S, Gordon E. 2008. Production, characterization and crystallization of the Plasmodium falciparum aquaporin. Protein Expr Purif 59:69–78.
- Hennig L, Schafer E. 1998. Protein purification with C-terminal fusion of maltose binding protein. Protein Expr Purif 14:367–370.
- Invitrogen C. 2005. EasySelect Pichia Expression Kit, version G. Accessed from the website: http://www.invitrogen.com/content/sfs/manuals/easyselect_man.pdf.
- Karlsson M, Fotiadis D, Sjovall S, Johansson I, Hedfalk K, Engel A, Kjellbom P. 2003. Reconstitution of water channel function of an aquaporin overexpressed and purified from Pichia pastoris. FEBS Lett 537:68–72.
- Kremers GJ, Goedhart J, Van Den Heuvel DJ, Gerritsen HC, Gadella TW JR. 2007. Improved green and blue fluorescent proteins for expression in bacteria and mammalian cells. Biochemistry 46:3775–3783.
- Lundstrom K. 2006. Structural genomics: The ultimate approach for rational drug design. Mol Biotechnol 34:205–212.
- Nyblom M, Öberg F, Lindkvist-Petersson K, Hallgren K, Findlay H, Wikstrom J, Karlsson A, Hansson O, Booth PJ, Bill RM, Neutze R, Hedfalk K. 2007. Exceptional overproduction of a functional human membrane protein. Protein Expr Purif 56:110–120.
- Öberg F, Ekvall M, Nyblom M, Backmark A, Neutze R, Hedfalk K. 2009. Insight into factors directing high production of eukaryotic membrane proteins; production of 13 human AQPs in Pichia pastoris. Mol Membr Biol 26:215–227.
- Perez-Martin J, Cases I, De Lorenzo V. 1997. Design of a solubilization pathway for recombinant polypeptides in vivo through processing of a bi-protein with a viral protease. Protein Eng 10:725–730.
- Petrovskaya LE, Shulga AA, Bocharova OV, Ermolyuk YS, Kryukova EA, Chupin VV, Blommers MJ, Arseniev AS, Kirpichnikov MP. Expression of G-protein coupled receptors in Escherichia coli for structural studies. Biochemistry (Mosc) 75:881–891.
- Reizer J, Reizer A, Milton H, Saier J. 1993. The MIP family of integral membrane channel proteins: Sequence comparisons, evolutionary relationships, reconstructed pathway of evolution, and proposed functional differentiation of the two repeated halves of the proteins. Crit Rev Biochem Molec Biol 28:235–257.
- Roosild TP, Greenwald J, Vega M, Castronovo S, Riek R, Choe S. 2005. NMR structure of Mistic, a membrane-integrating protein for membrane protein expression. Science 307:1317–1321.
- Roosild TP, Vega M, Castronovo S, Choe S. 2006. Characterization of the family of Mistic homologues. BMC Struct Biol 6:10.
- Sharp PM, Li WH. 1987. The codon Adaptation Index – a measure of directional synonymous codon usage bias, and its potential applications. Nucleic Acids Res 15:1281–1295.
- Sorensen HP. 2010. Towards universal systems for recombinant gene expression. Microbial Cell Factories 9:27.
- Tate CG. 2001. Overexpression of mammalian integral membrane proteins for structural studies. FEBS Lett 504:94–98.
- Tornroth-Horsefield S, Wang Y, Hedfalk K, Johanson U, Karlsson M, Tajkhorshid E, Neutze R, Kjellbom P. 2006. Structural mechanism of plant aquaporin gating. Nature 439:688–694.
- Wang A, Clapper J, Guderian JA, Foy TM, Fanger GR, Retter MW, Skeiky YA. 2003. A novel method for increasing the expression level of recombinant proteins. Protein Expr Purif 30:124–133.
- Werten MW, Wisselink WH, Jansen-Van Den Bosch TJ, De Bruin EC, De Wolf FA. 2001. Secreted production of a custom-designed, highly hydrophilic gelatin in Pichia pastoris. Protein Eng 14:447–454.
- White SH. 2009. Biophysical dissection of membrane proteins. Nature 459:344–346.
- Viard P, Butcher AJ, Halet G, Davies A, Nurnberg B, Heblich F, Dolphin AC. 2004. PI3K promotes voltage-dependent calcium channel trafficking to the plasma membrane. Nat Neurosci 7:939–946.